IHS Economics Series Working Paper 187
March 2006
Voting Power Derives from the Poll Distribution: Shedding Light on Contentious Issues of Weighted Votes and the Constitutional Treaty
Iain Paterson
Impressum Author(s):
Iain Paterson Title:
Voting Power Derives from the Poll Distribution: Shedding Light on Contentious Issues of Weighted Votes and the Constitutional Treaty
ISSN: Unspecified
2006 Institut für Höhere Studien - Institute for Advanced Studies (IHS) Josefstädter Straße 39, A-1080 Wien
E-Mail: o ce@ihs.ac.atffi Web: ww w .ihs.ac. a t
All IHS Working Papers are available online: http://irihs. ihs. ac.at/view/ihs_series/
This paper is available for download without charge at:
https://irihs.ihs.ac.at/id/eprint/1693/
Voting Power Derives from the Poll Distribution
Shedding Light on Contentious Issues of Weighted Votes and the Constitutional Treaty
Iain Paterson
187
Reihe Ökonomie
Economics Series
187 Reihe Ökonomie Economics Series
Voting Power Derives from the Poll Distribution
Shedding Light on Contentious Issues of Weighted Votes and the Constitutional Treaty
Iain Paterson March 2006
Institut für Höhere Studien (IHS), Wien
Institute for Advanced Studies, Vienna
Contact:
Iain Paterson
Department of Economics and Finance Institute for Advanced Studies
Stumpergasse 56, 1060 Vienna, Austria : +43/1/599 91-152
fax: +43/1/599 91-163 email: paterson@ihs.ac.at
Founded in 1963 by two prominent Austrians living in exile – the sociologist Paul F. Lazarsfeld and the economist Oskar Morgenstern – with the financial support from the Ford Foundation, the Austrian Federal Ministry of Education and the City of Vienna, the Institute for Advanced Studies (IHS) is the first institution for postgraduate education and research in economics and the social sciences in Austria.
The Economics Series presents research done at the Department of Economics and Finance and aims to share “work in progress” in a timely way before formal publication. As usual, authors bear full responsibility for the content of their contributions.
Das Institut für Höhere Studien (IHS) wurde im Jahr 1963 von zwei prominenten Exilösterreichern – dem Soziologen Paul F. Lazarsfeld und dem Ökonomen Oskar Morgenstern – mit Hilfe der Ford- Stiftung, des Österreichischen Bundesministeriums für Unterricht und der Stadt Wien gegründet und ist somit die erste nachuniversitäre Lehr- und Forschungsstätte für die Sozial- und Wirtschafts- wissenschaften in Österreich. Die Reihe Ökonomie bietet Einblick in die Forschungsarbeit der Abteilung für Ökonomie und Finanzwirtschaft und verfolgt das Ziel, abteilungsinterne Diskussionsbeiträge einer breiteren fachinternen Öffentlichkeit zugänglich zu machen. Die inhaltliche Verantwortung für die veröffentlichten Beiträge liegt bei den Autoren und Autorinnen.
Abstract
Analysis of the Constitutional Treaty of the European Union shows that there is a serious discrepancy between the voting power gradient of Member States computed by the Shapley- Shubik and Banzhaf indices. Given the lack of compelling arguments to choose between these indices on purely axiomatic grounds, we turn to a probabilistic approach as pioneered by Straffin (1977) focusing on the probability distribution of voting poll outcomes. We present a unifying model of power indices as expected decisiveness, which shows that the defining feature of each approach is a particular distribution of the voting poll. Empirical evidence drawn from voting situations, in addition to a consideration of first principles, leads us to reject one of these approaches. The unified formulation allows us to develop useful related concepts of efficiency and blocking leverage, previously used solely by a 'Banzhaf' approach, for the case of Shapley-Shubik, and a comparison of results is shown.
Keywords
Voting power indices, power gradient, coefficient of representation, expected decisiveness, efficiency, blocking leverage, Constitution of the European Union
JEL Classification
C43, C71, D02, D71, D81
Comments
Thanks go to Peter Silárszky for his lively discussion of concepts. This paper was presented by the author at the Workshop on Institutions and Voting Rules in the European Constitution, which took place at the Fundación El Monte, Sevilla on December 10-11, 2004, and at the European Public Choice Society Conference EPCS 2005 at Durham, March 31 - April 3, 2005 under the title: "A Lesser Known Probabilistic Approach to the Shapley-Shubik Index and Useful Related Voting Measures."
Contents
1. Introduction 1
2. Voting Games 3
2.1 The Shapley-Shubik Power Index ... 3
2.2 The Banzhaf Power Index ... 4
2.3 General definition of Power in terms of Decisiveness ... 4
2.4 Example... 8
3. Which Power Index to Choose in the Light of our Model of Expected Decisiveness? 9
3.1 Empirical Evidence of ‘Random’ versus Binomial Polling ... 93.2 Expected Decisiveness and Logical Probability... 11
4. Related ‘Shapley-Shubik’ measures 14
4.1 Efficiency ... 144.2 Blocking Leverage ... 17
4.3 Example: Calculating Efficiency for QMV of the Council of the EU ... 18
5. Constitutional Power in the European Union 20
5.1 Power Gradient... 216. Conclusion 23
References 24
I H S — Iain Paterson / Voting Power Derives from the Poll Distribution — 1
1. Introduction
There are two major ‘classical’ measures of voting power: the Shapley-Shubik power indices and the Banzhaf power indices. The Shapley-Shubik index, which was the first to be proposed, arose out of co-operative game theory. A small set of plausible axioms has been shown to be sufficient to characterise this index uniquely. Originally the Banzhaf approach was put forward as a heuristic measure, but has subsequently been ‘axiomatised’ in a similar fashion. We will dispense with the usual literature references here, as our approach will leave the game-theoretic background to one side, in part because there would appear to be sometimes strong opinions, but a lack of a compelling consensus, as to the merits of these axiomatic approaches.
Straffin (1997 and 1982) put forward an original characterisation of the power indices using a probabilistic approach. Starting out from basic assumptions about an individual’s voting behaviour Straffin was able to show that Banzhaf indices arise from an independence assumption: the probability
p
i of voting ‘for’, say, being selected independently from the uniform distribution on[ ]
0,1 for each player/voteri
, and that the Shapley-Shubik indices arise from a homogeneity assumption: a numberp
being selected from the uniform distribution on[ ]
0,1 , and thatp
i= p
for alli
.The approach in this paper draws its inspiration from Straffin, but it focuses in contrast on the probabilistic distribution of voting outcomes rather than the assumptions about voting behaviour as inputs.
Voting power indices have been applied and studied in the context of many voting situations, notably to analyse national elections in many countries, but also in the context of the United Nations Security Council, and voting rights in companies, to name but a few examples. We surmise, however, that the various deliberations of the European Union (in Amsterdam, in Nice, in the Convention and at the adoption of the Constitution in Brussels in June 2004) with the purpose of reforming its major voting system in the Council of Ministers – the institution which determines the power of individual member states – has given rise to the largest single body of literature on power indices and a renewed interest in all aspects of voting power.
A great variety of arguments have been put forward in the literature, of a game-theoretic nature or otherwise, on the respective merits or supposed deficiencies of the Shapley-Shubik and Banzhaf measures (as well as writers calling their appropriateness and usefulness per se into question!). Despite this, it can be noted from a practical viewpoint that the difference in results obtained by both approaches is usually only marginal. However, there are
2 — Iain Paterson / Voting Power Derives from the Poll Distribution — I H S
important cases in which the results do in fact differ dramatically. One such case is for
‘oceanic’ games involving a few ‘large’ players (in terms of their voting weight, and very many small players (e.g. stockholders in a company). Another remarkable difference in their respective results concerns the division of power between the President, the Senate and the Congress of the U.S.A. The Shapley-Shubik model attributes 50 % power to the President, but the Banzhaf approach attributes a mere 4 %. The corresponding power in Senate and Congress is 25 %, 25 % and 31 %, 65 % respectively.
Perhaps a uniquely high level of interest has been shown by the many economists and political scientists who have made contributions in recent years to the assessment of power in the European Union. Similar comments about the marginal differences shown in results gained from both approaches to the analysis of voting power in the Council of Ministers also applied … that is, up until the emergence of so-called double-majority systems, These require both a qualified majority of the number of states to be greater than a given threshold value, and the total population of states in favour to exceed a given percentage quota of the population of the whole EU. As is indeed now known, just such a system has been adopted in the text of its Constitutional Treaty, upon which the European Union is now embarking on its ratification process throughout the various 25 member states. It turns out that the results from the Shapley-Shubik and Banzhaf calculations for the Council of Ministers as specified in the EU treaty differ to an enormous, and not ignorable, extent.
The difference in results in illustrated here in terms of a non-parametric measure, the power gradient. (See section 5.2 for details). The power gradient is a summary statistic that relates the “degree of overall proportionality” between the power index of a player (member state) and its share of the total EU population. It is calibrated on a scale between 0 - 100 %: zero applies if all member states have equal power; 100 % applies if the power share is exactly equal to the population share of each member state.
Whereas the difference in power gradient between Shapley-Shubik and (normalised) Banzhaf indices is typically only of the order of between 5 - 7 percentage points, the power gradient using the Shapley-Shubik measure is 32 percentage points higher than for the Banzhaf measure when applied to the EU of currently 25 member states, and 27 percentage points higher in the EU of 27 (with Romania and Bulgaria).
This irreconcilable order of difference poses a particular problem (once again) and puts some questions into sharp focus: which of these classical measures of power do we accept?
in which power index should results be reported? The answer cannot be one of coexisting measures, analogous to measures of, say, money-supply. The latter rest on well-defined
I H S — Iain Paterson / Voting Power Derives from the Poll Distribution — 3
differing factual contexts whereas the power indices claim to measure the same characteristic, namely voting power, uniquely.1 Both would appear to be based on certain differing fundamental assumptions, between which we should be called upon to make a judgement.
It is sufficient to note that no consensus has appeared, mainly because of the lack of, as yet, a common yardstick with which the different approaches may be evaluated. We propose in this paper a common framework for the two main power indices (and perhaps others), and come to a conclusion on their respective appropriateness in the light of empirical evidence and a consideration of first principles.
2. Voting Games
Formally a voting body is represented as a set
N
, which contains all n members in the voting body. The notion of a simple game was introduced by Von Neumann and Morgenstern in 1944. A simple voting game is an n-person game which can be defined as a pair( N , ω )
which satisfies conditions (i) - (iii) i.
φ ∈ ω
ii.
N ∈ ω
iii. If S∈
ω
and T ⊃S , thenT ∈ ω
.In a simple game a coalition S can have a value 0 or 1. If Sis winning it has a value of 1, otherwise S has a value of 0 (all losing coalitions). The characteristic function v for a coalition indicates the value of S:
v ( S ) = 1
, if S is winning, otherwisev ( S ) = 0
.2.1 The Shapley-Shubik Power Index
The Shapley-Shubik power index
φ
was introduced by Lloyd Shapley and Martin Shubik in the 1950s (Shapley and Shubik 1954). The index is based on the Shapley value introduced by Lloyd Shapley (Shapley 1953). Shapley and Shubik came up with the idea that the1 We ignore here certain attempts to characterise the power indices as essentially measuring different phenomena (e.g. Felsenthal et al. (1998) and consider the meaning of so-called “P-power” and “I-power” as being vacuous.
4 — Iain Paterson / Voting Power Derives from the Poll Distribution — I H S
Shapley value could be used in simple games. In their article Shapley and Shubik (1954) introduce a voting scheme as well as the idea of being the pivotal or decisive voter. The calculation is based on all possible voter permutations, from which all the pivotal positions for a voter
i
is analyzed. The sum of all the pivotal positions is divided by all possible orderings (voter permutations) giving voteri
's share on all pivots. Formally, voteri
's Shapley-Shubik index value may also be formulated in terms of swings:( ) ( { } )
[ ] ( ) ( )
!
!
! 1
n l n i l
S v S v
N S
i
= ∑ − − ⋅ − −
⊆
φ
where l = SThe summation is thus over all negative swings, i.e. a non-zero contribution to the sum is obtained only when Sis winning, but
(
S−{ }
i)
is losing.2.2 The Banzhaf Power Index
The (absolute) Banzhaf (or Penrose) Index
β
of a simple game( N , ω )
is defined without considering orderings, but in terms of (negative) swings it is:( ) ( { } )
[ ]
2
−1∑
⊆− −
=
S N ni
i S v S v β
The summation is thus over all negative swings for player
i
.2.3 General definition of Power in terms of Decisiveness
In the following we set out a simple general definition of voting power that encompasses the major power indices of Shapley-Shubik and Banzhaf. The output of a yes/no voting process may be regarded in terms of the number (or percentage) of participants who vote in favour of the proposition to be decided. We call this the voting poll, or poll. Note that this output does not necessarily determine the final outcome of the vote: for example, 62 % in favour leads to the decision being accepted under simple majority, but to rejection when a two-thirds majority is required. The term “poll” is familiar in the contexts of opinion polls, or exit polls, used in the same sense.
Definition: The voting power of a player (participant, committee member, voter) is the expected decisiveness of her vote for a given distribution of the voting poll.
I H S — Iain Paterson / Voting Power Derives from the Poll Distribution — 5
In formal terms:
The decisiveness
d
i of a player for a particular poll (0≤l≤nvotes in favour) is the potential of her vote (for/against) being critical to the outcome of the voting decision. The potential may then be assessed on the basis of the probabilities applied to possible polling behaviours.Considering outcome sets
S
l that have exactly l players voting in favour and the set{ } i if i S and S { } i if i S S
S
i∗= − ∈ ∪ ∉
, then( ) ( ) ( ) ⎟⎟
⎠
⎜⎜ ⎞
⎝
− ⎛
= ∑
∈
∗
l S n
v S v l
d
Sl
S
i i
Decisiveness is thus the share of combinations (coalitions) that are +/- swings for each player i. We note from the above definition that decisiveness
d
i depends only on the parameters of the voting game (e.g. voting weights and the threshold that defines a winning coalition or majority), and not on any probabilistic aspects – in particular it is identical in any particular game for the Shapley-Shubik or Banzhaf approaches.The (voting) poll distribution p
( )
l , l =0,...,n returns the assumed probability of there being l votes in favour (and likewise( n − l )
against). For large n the distribution may take the continuous form on a scale of 0-100 percent. These probabilities have been assessed using the Principle of Indifference or Principle of Insufficient Reason for each of the Shapley- Shubik and Banzhaf models, but significantly in different ways.The expected decisiveness
δ
i of playeri
for a poll distribution p( )
l is thus:∑
==
⋅
=l n
l i
i d l p l
0
) ( )
δ
(Voting power indices are thus solely differentiated by the poll distribution p
( )
l . For Shapley-Shubik:( ) l n
l n
p
Sh, 0 ,...,
1
1 =
= +
6 — Iain Paterson / Voting Power Derives from the Poll Distribution — I H S
i.e. a uniform distribution of poll outcomes on
{
0,...,n}
, and for(absolute) Banzhaf:
( )
l n ln l
n l
l n
p n n
l
aB 2 , 0,...,
0
⎟⎟ =
⎠
⎜⎜ ⎞
⎝
= ⎛
⎟⎟⎠
⎜⎜ ⎞
⎝
⎟⎟ ⎛
⎠
⎜⎜ ⎞
⎝
=⎛
∑
=
i.e. a binomial distribution on
{
0,...,n}
with probability2
= 1
.Theorem 1 (Unifying Voting Poll Property):
i. The Shapley-Shubik voting power index of player
i
is the expected decisiveness under equi-likelihood (unbiased) “random” polling and is given by( )
( ) ( ) ( )
∑ ∑
∑
∑
=
= ∈
∗
=
=
=
=
= +
⎟⎟⋅
⎠
⎜⎜ ⎞
⎝
− ⎛
=
⋅ +
=
⋅
=
n l
l i
S
S i
n l
l i n
l
l
Sh Sh i
i
l n S n
v S v
l n d l
p l d
0 l
0 0
1 1 ) 1 ( )
(
φ δ
ii. The absolute Banzhaf voting power index of player
i
is the expected decisiveness under binomial polling and is given by( )
( ) ( )
∑ ∑
∑
∑
=
= ∈
∗
=
=
=
=
=
−
=
⎟⎟⎠
⎜⎜ ⎞
⎝
⋅⎛
=
⋅
=
n l
l
n i S
S
i n l
l i n n
l
l
aB aB i
i
l
S v S v
l l n d l
p l d
0
0 0
2
2 )
( )
(
β δ
Proof: Similar to Straffin (1977).
i.
∑ ∑
=( ) ( ) ( )
= ∈
∗
⎟⎟ ⋅ +
⎠
⎜⎜ ⎞
⎝
− ⎛
n l
l S S
i
n
l S n
v S v
0 l
1
I H S — Iain Paterson / Voting Power Derives from the Poll Distribution — 7
( ) ( {} )
[ ] [ ( {} ) ( ) ] ( )
∑
=∑ ∑
= ∈ ∈
+
⎟⎟⋅
⎠
⎜⎜ ⎞
⎝
⎛
⎪⎭
⎪⎬
⎫
⎪⎩
⎪⎨
⎧ − − + + −
=l n
l S S S S
l n S n
v i S v i
S v S v
l
0 l
1
transforming sets
T
where T =l−1( ) ( {} )
[ ] ( ) [ ( ) ( {} ) ] ( 1 )
1 1
0 0
+
⎟⎟ ⋅
⎠
⎜⎜ ⎞
⎝
⎛
− −
− +
+
⎟⎟ ⋅
⎠
⎜⎜ ⎞
⎝
− ⎛
−
= ∑ ∑ ∑ ∑
== ∈
=
= ∈
n
l i n T v T v l n
i n S v S
v
l nl T S n
l
l S Sl l
( ) ( { } )
[ ] ( ( ) ) ( ) ( ( ) ( ) )
⎭⎬
⎫
⎩⎨
⎧
+
−
− + −
+
⋅ −
−
−
=
∑
⊆ n !
! l n
! l
! n
! l n
! i l
S v S v
N
S 1
1 1
1
( ) ( { } )
[ ] ( ) ( )
iN
S
n !
! l n
! i l
S v S
v − − ⋅ − − = φ
= ∑
⊆
1
ii.
∑ ∑
=( ) ( )
= ∈
∗
=
n
−
l
l
n S
S
i
l
S v S v
0
2
( ) ( {} )
[ ] [ ( {} ) ( ) ]
∑
=∑ ∑
= ∈ ∈ ⎪⎭
⎪⎬
⎫
⎪⎩
⎪⎨
⎧ − − + + −
=l n
l
n S
S S
S l l
S v i S v i
S v S v
0
2
( ) ( { } )
[ ]
n iN S
i S v S
v − − =
β
×
=
∑
⊆
2 2
Remark: Because 1
1 1
=
=
∑
∑
= = ni i n
i
iSh
φ
δ
, a well-known property, the Shapley-Shubik power indices may itself also be treated as defining a probability distribution over all players: the power index is then the probability of a player having decisive power. A corresponding statement is not true for the absolute Banzhaf power index, as it does not in general sum to unity.8 — Iain Paterson / Voting Power Derives from the Poll Distribution — I H S
(d) (a) (b) (c)
5 3 2 1 >=7 ?
#
5 - - -
- 3 - -
- - 2 -
- - - 1
5 3 - -
- 3 2 -
- - 2 1
5 - - 1
5 - 2 -
- 3 - 1
- 3 2 1
5 - 2 1
5 3 - 1
5 3 2 -
- 1
winning coalition
5 -
3
Vote W eights combinations
"- swing -
1 -
3
2 4
"+ swing 0
4
6
4
1 1
2
0 (a)*(b)
0
(a)*(c) Shapley-Shubik
0 abs. Banzhaf
0
# *(b) / (d)
0
0
⎟⎟⎠
⎜⎜ ⎞
⎝
⎛ l
l
n d3( )
l1 0 0=
4 1
3 1 6 2=
4 1
1 0 0=
( )
l pSh5 1
5 1
5 1
5 1
5 1
20 1 20
1
15 1
( )
l paB16 1
16 1
4 1 16
4 =
4 1 16
4 = 8 3 16
6 = 16
1
8 1
16 1
( )
4 13aB l =
( )
δ 6 13Sh l =
∑
=16 δ15 6 1 5 2×1 =
20 4 3 5 3×1 =
5 1
12 5 60
12 9 4+ + =
Sh= Eff
8 3 16
6 =
aB = Eff
30 6 1 5 1×1 =
20 4 1 5 1×1 =
( ) 12
1 20
1 30 3 = 1 + = nsbSh
( ) ( )
5 1 12
5 12
1
3 = 3 = =
Sh
Sh EffSh
BL nsb
2.4 Example
Consider the 4-person game
{
5,3,2,1;7}
, i.e. a threshold of 7 weighted votes are needed to pass a decision.The calculations for the voting power index of the player with weight 3 are illustrated in the above diagram. The starting point for both Shapley-Shubik and (absolute) Banzhaf calculations is the list of coalitions, as shown in the second column of the table. Both indices also share the same decisiveness function shown in the column marked (a). The indices differ only in the probability distributions shown in columns labelled (c) and (d) respectively.
Alongside the power indices, other measures introduced later in this paper are indicated.
The diagram shows the calculation of efficiency and also the blocking leverage of the player with weight 3 for the Shapley-Shubik approach.
I H S — Iain Paterson / Voting Power Derives from the Poll Distribution — 9
3. Which Power Index to Choose in the Light of our Model of Expected Decisiveness?
3.1 Empirical Evidence of ‘Random’ versus Binomial Polling
The previous section has shown that the classical Shapley-Shubik and Banzhaf power indices may be unified under the probabilistic model of expected decisiveness. In this formulation there is a clear difference between these two approaches. In the Shapley-Shubik approach, the underlying poll distribution (i.e. the distribution of the number of players voting for a decision) is uniform or “random”, whereas it is binomial (with probability = ½) in the Banzhaf model. Note the contrast when these approaches are characterised in terms of voting behaviour instead of poll outcome: Banzhaf models exhibit ‘random’ voting, giving rise to a uniform distribution of individual voting configurations, whereas Shapley-Shubik models exhibit ‘homogeneous’ voting, giving rise to what could be termed an ‘inverse binomial’
distribution of individual voting configurations. The Principle of Insufficient Reason is applied to the poll distribution in the Shapley-Shubik model, but to the voting configuration (of
‘named’ voters) in the Banzhaf model. We can now ask: which approach, using which assumption, is appropriate?
Two recent papers (Gelman, Katz and Bafumi 2002, Gelman, Katz and Tuerlinckx 2002) have been devoted to wide-ranging empirical testing of voting power, using data from U.S.
State House, U.S. State Senate, U.S. Congressional, U.S. Senate, as well as European national elections. Regarding this as a source of data, it can be pointed out that elections with typically half a million upwards of an electorate represents a large ‘committee’ faced with for/against, yes/no-type decisions. (Multi-party elections do not play a significant part in this debate). A well-known property of the binomial distribution is its rapid convergence to approximation to a Normal distribution with standard deviation proportional to
n
, the number of voters (players), so that the Banzhaf model predicts an ever tighter clustering of the proportion of voters voting ‘for’ a decision, say, within two standard deviations of a central mean of n 2 as n increases. Such a tendency should therefore be particularly in evidence in elections where n is very large.When Gelman, Katz and Bafumi (2002) claim in their empirical analysis that “Standard Voting Power Indices Don’t Work”2 they are referring to the Banzhaf power indices, as they make clear. They point out that voting power indices such as that of absolute Banzhaf are derived, explicitly or implicitly, from the assumption that all votes are equally likely (i.e.
random voting) and that from this assumption it can be derived that the probability of a vote being decisive in a jurisdiction with n voters is proportional to
1 n
. In testing, and rejecting2 Title of their paper.
10 — Iain Paterson / Voting Power Derives from the Poll Distribution — I H S
this hypothesis empirically, using data from several different U.S. and European elections they find instead that the probability of a decisive vote is approximately proportional to 1 n. Now a vote in a simple majority election is theoretically decisive when the balance of voters
‘for’ and ‘against’ is 50-50. The voter in this position of balance is one out of n voters, so that under the uniform poll distribution associated, as we have seen, with the Shapley- Shubik model, the probability of the vote being decisive is 1
(
n+1)
, which is of course proportional to 1n for large n. With any fixed poll distribution the probability of a vote being decisive is proportional to 1n, in fact. Experiments with the triangular poll distribution, for example, return power indices “close to” the Shapley-Shubik indices. Thus the empirical findings of Gelman et al. not only lead to a rejection of the Banzhaf or “coin-flip” model, but we observe that these findings also show strong support for the Shapley-Shubik model.Gelman et al. also turn their attention to the recurring claim that, in the voting system for the President of the United States, the Electoral College benefits voters in large states (at the expense of voters in smaller states). For example, Banzhaf (1968) claims to offer “a mathematical demonstration” that it “discriminates against voters in the small and middle- sized states by giving the citizens of the large states an excessive amount of voting power, ” and Brams and Davis (1974) claim that the voter in a large state “has on balance greater potential voting power … than a voter in a small state. ” Gelman et al. conclude that the most important political implication of their result is that proportionally weighted voting systems (that is, each jurisdiction gets a number of votes proportional to n) are basically fair, and that this contradicts the claim in the voting power literature that weights should be approximately proportional to
n
(the so-called “square-root rule”). We concur with these authors, as a consequence of our insights into the Shapley-Shubik model.There is a deal of similarity between the ‘asymmetric’ voting system of American Electoral College and the Council of the European Union, in terms of voting weights that are (more or less) degressively proportional to population size. In the days leading up to the decision taken to adopt the European Constitution in June 2004, a leading group of voting power experts addressed a letter the European Governments and European institutions which called for voting weights of member states to be based on the square-root rule. We pose the open question of whether these scientists would continue such support this demand when armed with the knowledge that it is based on tacit acceptance of the Banzhaf model, but which loses its validity upon acceptance of the Shapley-Shubik model.
I H S — Iain Paterson / Voting Power Derives from the Poll Distribution — 11
Further evidence of the untenability of the square-root rule has been given in the recent US Presidential Election (2004). Many observers3 believe that the narrow avoidance of the same outcome in the close-run race as happened in 2000, namely a win for a candidate whose party received less votes than another, shows that the Electoral College system is unacceptable. In fact, if apportionment of members of the Electoral College did indeed follow the square-root rule, the Republican victory could have been secured without winning the large states Florida and Texas, with states whose combined population is only 38 % of the total US population, as opposed to the 51 % of population that “red” states actually comprised!4 So application of the square-root theory would fly in the face of commonly held beliefs about democracy: this theory is the direct corollary of the Banzhaf voting power model.
It should be mentioned that Leech (2002) found in a study of corporate shareholding in UK results that support Banzhaf voting power and fail for Shapley-Shubik power indices. That study compares the power indices respectively to independent analyses of shareholder voting power related to the separation of ownership and control. It is not clear to us whether this criterion is indeed sufficiently indicative as a means of hypothesis testing.
3.2 Expected Decisiveness and Logical Probability.
The entry contributed by Alan Hacek on logical probability in the Stanford Encyclopedia of Philosophy5 reminds us that along with its early proponent Keynes (1921) by far the most systematic study of logical probability was by Carnap (1950) and that his formulation of logical probability begins with the construction of a formal language. It states:
“Carnap argues for his favored measure “m*” by insisting that the only thing that significantly distinguishes individuals from one another is some qualitative difference, not just a difference in labeling. Call a structure description a maximal set of state descriptions, each of which can be obtained from another by some permutation of the individual names. m* assigns each structure description equal measure, which in turn is divided equally among their constituent state descriptions. It gives greater weight to homogenous state descriptions than to heterogeneous ones, thus ‘rewarding’ uniformity among the individuals in accordance with putatively reasonable inductive practice.”
3 For example, a leader published in the International Herald Tribune one week after the election.
4 Paterson, I., IHS Working Paper (to appear).
5 See http://plato.stanford.edu/entries/probability-interpret/#3.2
12 — Iain Paterson / Voting Power Derives from the Poll Distribution — I H S
As an example:
The measure m* assigns numbers to the state descriptions as follows: first, every structure description is assigned an equal weight, 1/4; then, each state description belonging to a given structure description is assigned an equal part of the weight assigned to the structure description:
State description Structure description Weight m*
1. Fa.Fb.Fc I. Everything is F 1/4 1/4
2. Fa.Fb.Fc 1/12
3. Fa.Fb.Fc II. Two Fs, one ¬F 1/4 1/12
4. Fa.Fb.Fc 1/12
5. Fa. Fb.Fc 1/12
6. Fa.Fb.Fc III. One F, two ¬Fs 1/4 1/12
7. Fa. Fb.Fc 1/12
8. Fa. Fb.Fc IV. Everything is ¬F 1/4 1/4
Notice that m* gives greater weight to homogenous state descriptions than to heterogeneous ones….
Curiously, the Weight in this example could serve exactly for the probability
p
Sh( ) l
and the measure m* forp
'Sh( ) l
, the individual coalition probability (c.f. section 4), in our expected decisiveness model of Shapley-Shubik voting power. Notwithstanding this coincidence, it serves to illustrate that it is legitimate to consider that the appropriate level to apply the so- called Principle of Indifference or Principle of Insufficient Reason can be the poll outcome, and need not be incontrovertibly at the “atomistic” level of voting behaviours, as is implicit in all Banzhaf-type models.I H S — Iain Paterson / Voting Power Derives from the Poll Distribution — 13
There will surely be adherents of the atomistic line of thinking who insist that the free choice of voters in a voting game (that admittedly exists) must lead ‘naturally’ to the uniform distribution over voting coalition outcomes
p
aB'( ) l
. We offer a reply based on Franklin’s (2001) paper. In his claim that “[Karl] Popper was a secret logical probabilist” he notes that“Popper claimed … that theories should be “contentful” or “testable” and aim to survive
“rigorous” or “severe” tests. The natural interpretation of these claims, though one resisted by official Popperian ideology, is that it is a good thing for a theory (in short, it increases the theory’s probability substantially) if it is initially improbable, but predicts something that would be unlikely if it were false.”6
In our case, the Shapley-Shubik model admits the possibility that any election result (say, of a “yes/no” referendum) is possible and assigns equal a priori probability to each poll result.
The fact that indeed a large range of election/referendum poll results are observed in practice increases our likelihood of acceptance of this approach. If the Shapley-Shubik approach is false (because the correct model is Banzhaf) then referendum results of 79 %, 42 %, etc. even 53 % , for example, would occur with near-zero frequency with an electorate of millions.7 This is patently not the case. And there being less than 5 or 6 states in favour/against a decision in EU25 would be outwith the 99 % confidence level! Thus the empirical evidence and a consideration of first principles leads to a rejection of the Banzhaf model.
Why it should be (as we believe) that in most voting situations where voters exercise their individual right to vote independently, the results tend to exhibit ‘random poll’ and not
‘random voting’ behaviour, is a matter for conjecture. Perhaps it lies in the fact that each vote is taken on a particular issue that is in common for each player, so that their polling behaviour is a reflection of the ‘society’ of which they consist. Sometimes there will be a low degree of concurrence, sometimes a high degree of concurrence, sometime a very high degree, sometimes there will be a rough balance etc. On the one hand we cannot a priori predict what the balance in the group/society will be for a particular unknown issue. On the other hand, the vote on a particular decision will give rise to group result, the voting poll, and it is precisely because this poll result is unknown that we invoke the Principle of Insufficient Reason. Indeed, the existence such a phenomenon – namely, that there is an underlying poll tendency on a particular issue, which is the group phenomenon to be uncovered – is the basis for the pervasiveness and utility of opinion polls. Random voting, on the contrary,
6 Note: for a “theory’s probability” here should not be confused with our use of probability in voting power models.
7 In an electorate of 5 million, for example, the result will lie between 49.96 % - 50.04 % (95 % c.l.).
14 — Iain Paterson / Voting Power Derives from the Poll Distribution — I H S
would imply that the voters were oblivious to the issue at hand, voting effectively as automatons, and that nearly all polls would split 50-50. We could indeed postulate an
Axiom of Social Choice: Voting in a group decision follows, a priori, a random poll model.
4. Related ‘Shapley-Shubik’ measures
The probability distribution p
( )
l is defined over equal poll outcomes i.e. with l players voting in favour. (Note that the poll outcome is not the same as the vote outcome: in a weighted voting game, different combinations of l players will in general have a different combined strength of vote.) The poll distribution is testable in practice, as discussed above.We may alternatively consider the corresponding distribution over the possible combinations of ‘individual’ voting behaviour, p'
( )
S = p'( )
l wherel = S , This distribution is rarely made available in practice, and even for moderate-sized n the large number of combinations makes hypothesis testing difficult. We may however write( ) ( ) ( )
( 1 ! ) ! !
1
'
1
+
⋅
= −
⎟⎟ ⎠
⎜⎜ ⎞
⎝
⎛
= +
n l l n l
n S n
p
Sh and paB( )
S n2
' = 1 , where l= S and the
voting power index formulas may be formulated as
( )
S v( )
S p( )
Sv Sh
N S Sh i
i =
∑
− ⋅ '∈
δ
∗ and v( )
S v( )
S paB( )
SN S aB i
i =
∑
− ⋅ '∈
δ
∗ .4.1 Efficiency
The topic of efficiency (also appearing under a variety of other names, such as ‘workability’) entered prominently into the discussions on the voting system of the Council of Ministers of the EU in the years prior to the drafting of the Constitutional Treaty. Leaving aside the appropriateness of the name, efficiency turns out to be Coleman’s (1971) index on the power of a collectivity to act. This index indicates the ability of the voting body to pass a bill. In a voting body of n members there are always 2n different coalition possibilities (voter combinations) favouring the passage (including the empty coalition as well as the grand coalition) and the complementary coalitions consisting of the remaining voters. Using the characteristic function we can measure the efficiency as
I H S — Iain Paterson / Voting Power Derives from the Poll Distribution — 15
n N
S
S v ( ) 2
∑
∈[Coleman power of a collectivity to act]
in other words the fraction of coalitions that are winning coalitions.
This definition of efficiency is enticingly ‘obvious’ – until it is realised that in probabilistic terms it is a ‘Banzhaf’-type function, i.e. the same assumption – namely, that each coalition has exactly the same probability – underlies it, just as is made in calculating the (absolute) Banzhaf power indices.
Definition 1 (Efficiency):
The generalisation of the concept of efficiency is simply the probability of coalitions being winning coalitions
( ) S p S v Eff
N S
)
'( ⋅
= ∑
∈
so that
( )
( 1 ) !
! ) !
( +
⋅
⋅ −
= ∑
∈
n
l l S n
v Eff
N S Sh
It is notationally convenient to split the formulas of Theorem 1 into two parts, a negative swing balance, nsb, and positive swing balance,
psb
such that( ) [ ( ) ( {} ) ]
p( )
ll i n
S v S v i
nsb n
l S Sl
⎥ ⋅
⎥
⎦
⎤
⎢⎢
⎣
⎡
⎟⎟⎠
⎜⎜ ⎞
⎝
− ⎛
−
=
∑ ∑
=0 ∈
, and
( ) [ ( {} ) ( ) ]
p( )
ll S n v i S v i
psb n
l S Sl
⎥ ⋅
⎥
⎦
⎤
⎢⎢
⎣
⎡
⎟⎟⎠
⎜⎜ ⎞
⎝
− ⎛ +
=
∑ ∑
=0 ∈
Thus
( ) i psb ( ) i
i
= nsb + δ
which holds in particular for both the Shapley-Shubik and Banzhaf cases.
16 — Iain Paterson / Voting Power Derives from the Poll Distribution — I H S
[Note:
∑ ( ) ∑ ( )
=
=
=
ni aB
i n
i
nsb
aBi psb i
1 1
but
∑ ( ) ∑ ( )
=
=
≠
ni Sh
i n
i
nsb
Shi psb i
1 1
in general.]
We get the following interesting result for Shapley-Shubik efficiency
Theorem 2 (Efficiency):
i.
∑ ( )
=
= n
i
Sh
Sh psb i
Eff
1
ii.
∑ ( )
=
−
= n
i
Sh
Sh nsb i
Eff
1
1
Proof:
i. By induction; [to be inserted].
ii. Follows from 1
01
∑
n =i iSh
δ
andδ
i= nsb ( ) i + psb ( ) i
.Corollary:
The properties of Theorem 2 do not hold for
Eff
aB.Proof:
Consider the case of unanimity being required in a game where every voting weight is non- zero. All votes are needed for the unique winning coalition which has ‘length’ n. So
aB n
Eff 2
= 1
Likewise, there are exactly n combinations each with a length of n−1 that are the corresponding
psb
's. ThusI H S — Iain Paterson / Voting Power Derives from the Poll Distribution — 17
( )
n aBn
i
aB i n Eff
psb = ⋅ ≠
∑
= 2 11
4.2 Blocking Leverage
It has become increasingly clear to the author that in assessing voting systems in the EU, member states are not only (maybe not even primarily) paying attention to their power as assessed by the classical power indices, but are concerned about their ability to block (‘veto’) unfavoured decisions. A real analysis of this factor would take into account the perceived structure of voting among fellow member states (e.g. to identify ‘allies’); in this paper we are concerned with a priori constitutional aspects of voting, and hence we restrict our attention to the (partial) blocking strength, or leverage, of each player on its own.
The concept of blocking power was introduced by Coleman (1971). The Coleman preventive power index measures individual voters' possibilities to block a vote. The index is defined as the number of winning coalitions where voter is a decisive (negative swing) voter
i
divided by the number of all winning coalitions. In other words, voter 's negative swings are divided by the number of winning coalitions. Formally voteri
's power to block action is calculated as( ) ( {} )
[ ]
∑ ( )
∑
∈
∈
−
−
N S N S
S v
i S v S v
[Coleman preventive power]
Following the above idea, we ask what the probability of a negative swing is, given that coalitions are otherwise winning, in the following generalised definition.
Definition 2 (Blocking Leverage):
The Blocking Leverage of player
i
is( ) ( )
Eff i i nsb
BL =
,so that
( ) ( ) ( )
∑ ( )
=
=
= n
i
Sh Sh Sh
Sh Sh
i psb
i nsb Eff
i i nsb
BL
1
.
18 — Iain Paterson / Voting Power Derives from the Poll Distribution — I H S
Theorem 3 (Blocking Leverage):
( ) i =
BL
aB Coleman’s preventive power index.Proof:
( ) [ ( ) ( {} ) ] [ ( ) ( {} ) ]
∑
∑
∑
∑ ∑
∈
∈
∈
= ∈ − −
=
−
−
=
N S N S n
N S n
l S S
n
aB aB
S v
i S v S v S
v
i S v S v Eff
i
nsb l
) ( 2
) (
2
0
The index vector
{ BL
Sh( ) i : i = 1 ,..., n }
offers more original information than( )
{ BL
aBi : i = 1 ,..., n }
in the sense that it does not reduce on normalising toδ
iSh= φ
i, unlike the latter, for which holds( ) ( ) ( ) ( ) ( ) ( )
⎭⎬
⎫
⎩⎨
⎧ =
∑
= =∑
==
=
n i
i i
i i
BL i
BL i BL
n i
aB aB
nB n
i aB aB
nB : 1,...,
1 1
β β
β
where the subscript ‘
nB
’ stands for ‘normalised Banzhaf’.4.3 Example: Calculating Efficiency for QMV of the Council of the EU
Since the beginning of the Inter-Governmental Conference that followed on from the EU’s Constitutional Convention there were continuing reports about member states being in favour or opposed to the Double Majority proposal set out in the Draft Constitution. Particular prominence was given by acolytes of the Double Majority to the issue of the future efficiency of decision making in the Council, in terms of the ease or difficulty of reaching qualified majorities.
As an example, Tabellini (2003) citing Baldwin et al. (2003) claims that “[the Double Majority]
results in a huge increase in the probability of approving new legislation [i.e. ‘efficiency’] … under the rules proposed by the Convention Treaty and with 25 countries, as much as 22 % of all possible Council coalitions overcome the majority thresholds. This takes the Union to a situation comparable to that of the 1960s, when it consisted of only the six founding member states.”
I H S — Iain Paterson / Voting Power Derives from the Poll Distribution — 19
However, the (Banzhaf) methodology used in those calculations is not appropriate for analysing the Council (of Ministers) of the EU, a decision making body mostly seeking consensus through negotiation. As we have seen, there are several strong theoretical and empirical reasons for preferring the classical approach of Shapley and Shubik. The conclusions reached using the two methodologies are usually similar but on crucial occasions, as in the case of the Convention’s Double Majority proposal, they are dramatically different. In common with many other authors, we consistently calculate indices of power based on the Shapley-Shubik approach, The possibility of being able to make the calculations of efficiency, such as we present here for the Council, has also recently been anticipated in the work of Laruelle and Valenciano (2003).
The results show that the claims made about the inefficiency of weighted voting in an enlarged EU are vastly exaggerated. Whereas the Double Majority proposal of the Convention do fare somewhat better in terms of Shapley-Shubik efficiency (39 % in EU25), the efficiency of the other (weighted vote) systems hypothetically applied to the EU of 25 member states remains at or around 30 % (Status Quo+ 30.5 %, ‘Nice’ 29.2 %). In fact this level of efficiency – the probability of approving new legislation – is higher than calculated for the Double Majority using the Banzhaf-Coleman approach (22.5 %). In the other weighted voting cases, the Banzhaf-Coleman calculations produce extraneous results, e.g. Nice (3.6 %), Status Quo (3.5 %), which should in our opinion be discarded.
An intuitive explanation for these differences is as follows: The Banzhaf-Coleman model assumes that all members of a voting body act entirely independently of one another, and randomly. This at first seemingly innocuous assumption in fact means that as the number of voters increases the probability continually increases that just around half of the members are in favour of any decision, and half against, so it becomes increasingly difficult to cross a threshold usually around a quota of 70 % of total votes. Analogously, in a yes/no referendum choice with an electorate of millions, the coalitional probabilities in a Banzhaf-Coleman model of such a voting scenario imply that there would always be an almost exact 50/50 split for and against – clearly, in behavioural terms, a reductio ad absurdum.
The better ‘principle of insufficient reason’ assumption is asserted by Shapley-Shubik modelling: namely, that there is an equal chance of j member states (j varying from 0 to n
= 25 in EU25) being in favour of any particular issue, and that every coalitional combination made up of j countries is also equally likely within that. Efficiency is then the sum of the probabilities, thus determined, of winning coalitions. Not only is the Shapley-Shubik model preferable for calculating power, the coalitional probabilities used in the calculation of efficiency are not in conflict with behavioural reality. Our results clearly prove that worries
20 — Iain Paterson / Voting Power Derives from the Poll Distribution — I H S
about efficiency in the enlarged EU are unfounded – it is simply not a decisive factor for the choice of voting system, and it cannot hold as the main reason for preferring the Convention Double Majority proposal, or indeed the system of “Double Majority+” adopted in the Conventional Treaty of the European Union, to a weighted voting arrangement such as the Nice system.
5. Constitutional Power in the European Union
Calculations of Shapley-Shubik power indices using the method of expected decisiveness have been implemented and validated with proprietary software, which also produces the new Shapley-Shubik based measures of efficiency and blocking leverage. In this paper, we do not focus on evaluating the various proposals that were made by the European Commission, European Convention, individual member states, or independent actors in the run-up to the debate on the European Constitution, albeit a fascinating topic in itself. Instead we present only results for the Status Quo (an interpolation of weighted votes for new member states in force until November 1, 2004), the ‘Nice system’ in force thereafter, and the Constitutional settlement which will come into force in 2009, after successful ratification of the treaty by all member states. (Details of these systems and further analysis may be found in the Short Policy Papers at http://www.ihs.ac.at/index.php3?id=1053)
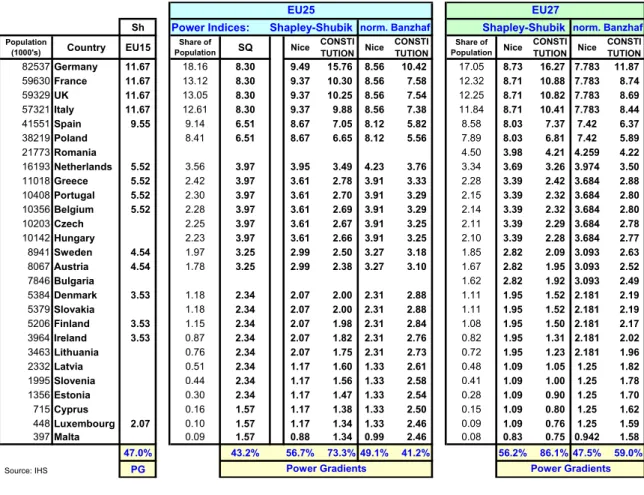
In Table 1 it may be observed that the redistribution of power towards large member states (an ‘upward reform’ in terms of the power gradient) is moderate in the transition from the Status Quo to Nice, but is dramatically increased in the transition from Nice to the system of the Constitution. We refer here to the Shapley-Shubik results, although the Banzhaf results are shown for comparison. Note that power indices are given here as percentages instead of on the 0-1 scale. For example, in an EU of 27 members, Germany, the largest EU member state, would have a power index of 16.27, only somewhat short of its share of the EU population at 17.05 %, Indeed the power gradient shows a very large increase in the Constitution (e.g. 86 % in EU”7) over the Nice system of weighted votes (56 % in EU27).
In contrast, Banzhaf calculations would indicate only a further moderate increase in power gradient due to the constitutional settlement. Such a result runs contrary to the effects of the Constitutional system of Qualified Majority Voting as perceived by various insiders and political commentators to the Inter-Governmental negotiations.8 While this observation may
8 In private discussions.