Revision of the stratospheric bomb 1 CO2 inventory
V a g o Hesshaimer and Ingeborg Levin
Institut fur Umweltphysik, University of Heidelberg, Heidelberg, Germany
Abstract. About 4900 values of
14C0
2activity have been measured on stratospheric air samples collected between 1953 and 1975 when the major nuclear weapon tests injected large amounts of
14C into the atmosphere. However, the validity of these data published in Health and Safety Laboratory reports was repeatedly criticized and their relevance is thus usually denied in model studies tracing the global carbon cycle with bomb
14C0
2. To oppose this criticism, we perform here a comprehensive analysis of the measurements and calculate stratospheric bomb
14C0
2inventories for the period in question. We find out that the
recognized weaknesses of the survey do not justify a general discrimination against the
14C0
2observations. Our
14C0
2inventories determined using numerical methods to interpolate the observations widely confirm the more "hand-made" results from a former study by
Telegadas[1971] except in the northern poleward stratosphere. We are also able to clear away the reasons commonly advanced to call into question the stratospheric bomb
14C0
2inventories by up to 20%. These findings rehabilitate the most extensive data set of stratospheric
14C0
2observations and establish them, together with our corresponding bomb
14C0
2inventories, as a valuable observational constraint which should be seriously accounted for in global carbon cycle models and in other studies relying on an accurate simulation of air mass transport in the atmosphere.
1. Introduction
Fortunately, the radiocarbon method developed early enough [Libby et al, 1949] to detect that nuclear weapon tests in the atmosphere perturb natural 14C levels b y producing m u c h o f so-called b o m b 14C. Measurements o f the 1 4C 02
activity o f stratospheric air (most 14C resides in the atmos
phere as 1 4C 02) were included in the global survey S T A R D U S T supported b y the United States between 1953 and 1969. T h e bulk o f1 4C 02 activity values measured during that survey was summarized to determine the time variation o f the b o m b1 4C 02 burden in the stratosphere [Telegadas, 1971].
In that paper, Telegadas [1971, p. 3] proposed to further use the presented distribution o f1 4C 02 " . . . a s a tracer for atmos
pheric motions and for estimating the exchange rate o f C 02
between the atmosphere and the ocean and biosphere."
Indeed, his results were investigated in several studies about air mass motion using t w o - and three-dimensional models [Johnston, 1989; Shia et al, 1993; Kinnison et al, 1994;
Rasch et al, 1994]. Strangely enough, the only study budget
ing 1 4C 02 in the global carbon cycle which consistently accounted for the stratospheric inventory compiled b y Telegadas was b y Hesshaimer et al [1994]. A l l other m o d e l studies trying to globally match b o m b 1 4C 02 levels observed in the carbon cycle reservoirs [e.g., Enting et al, 1993;
Broecker and Peng, 1994; Lassey et al, 1996; Jain et al,
1997] solved inconsistencies in their budgets b y mistrusting the stratospheric inventories. Justification o f this discrimina
tion was already given b y Telegadas [1971] himself: due to unidentified reasons, the 1 4C 02 activity o f samples collected in the lower troposphere aboard aircraft seems to be system- Copyright 2000 by the American Geophysical Union.
Paper number 1999JD901134.
0148-0227/00/1999JD901134$09.00
atically higher b y A1 4C ~ 50-200%o (for A-notation see section 2.1) than observed at comparable ground level stations. A second shortcoming o f the data interpretation resides in the fact that Telegadas used hand-made drawings to determine, in an undocumented manner, his stratospheric inventories f r o m the original1 4C 02 observations. A third often mentioned criti
c i s m is that the survey was not intense enough to allow a reliable quantification o f the stratospheric b o m b 1 4C 02 burden during such a period o f intense nuclear tests [Tans, 1981;
Broecker et al, 1995]. In the present paper w e confront our
selves to all these shortcomings and reprocess the data in a w a y suitable for further investigations. In the f o l l o w i n g sec
ond section w e present the entire set o f data with enough detail to compute, in the third section, a stratospheric b o m b
1 4C 02 burden to be compared with the inventories o f Telegadas. In the fourth section, conclusions are drawn f r o m the comparison between the1 4C 02 activity values published in the Health and Safety Laboratory ( H A S L ) reports and obser
vations f r o m other sources.
2. Stratospheric Observations Published in the HASL Reports
T h e Health and Safety Laboratory reports with numbers 159, 166, 174, 214, and 2 4 2 [Hagemann et al, 1965, 1966, 1967, 1969, 1971] present tables containing values o f 1 4C 02
activity, along with auxiliary 51 3C, 51 80 values, and C 02
m i x i n g ratios, f r o m w h o l e air samples collected in the project S T A R D U S T between m i d - 1 9 5 3 and m i d - 1 9 6 9 which are numbered 1 to 6492. Recently, these data also became avail
able on the W o r l d W i d e W e b at the Carbon D i o x i d e Information A n a l y s i s Center ( C D I A C ) [Leifer and Chan, 1998]. A b o u t 140 further stratospheric1 4C 02 activity data f r o m the period m i d - 1 9 6 8 to m i d - 1 9 7 4 are reported in the H A S L reports 2 4 6 [Telegadas et al, 1972], 284 [Sowl et al,
11,641
1974], and 294 [Sowl et al, 1975]. In the f o l l o w i n g w e refer to the s u m o f all these reports as the H A S L reports, to the s u m o f the corresponding observations as the H A S L observations, and so forth. A b o u t 7 5 % o f the activity values in the H A S L reports were measured on 12 m3 S T P air samples compressed aboard aircraft into nickel-plated spherical steel bottles [Hagemann et al, 1965]. O f the remaining 2 5 % , all 1 4C 02
activities except those in H A S L reports 246, 284, and 294 were measured f r o m about 5 0 m3 S T P air samples transferred after balloon flights f r o m an armored vessel into high-pressure cylinders [Hagemann and Gray, 1959]. T h e activities pre-
sented in H A S L reports 246, 284, and 294 were measured on samples collected with a molecular sieve technique
[Ashenfelteretal, 1972].
M o s t o f the observations f r o m project S T A R D U S T made available as C D I A C database were not initially available on computer systems and had to be retrieved f r o m publications [Leifer and Chan, 1998]. A s w e had already transferred, inde- pendently, the same tables f r o m the H A S L reports to our computer system, w e could identify some 5 0 misreading errors in the C D I A C database b y cross comparison with the results o f our computerization. These errors will be reported to the C D I A C .
2.1. Activity Unit Conversions
T h e 1 4C 02 activities presented in the H A S L reports are listed in units of disintegration per minute per gram o f carbon ( d p m / g C ) before and in units o f 105 atoms o f 14C per gram o f air (105 atoms/g air) after a correction explained b y
Hagemann et al [1965] for isotopic fractionation and
contamination during sample treatment. In all H A S L reports except 294 the conversion f r o m corrected activities expressed in d p m / g C to corrected activities expressed in 105 atoms/g air is obtained by multiplication with 5.64. T h e excess 1 4C 02
activities attributable to nuclear weapon tests are obtained b y subtracting a prenuclear background activity o f 7 4 x 1 05
atoms/g air f r o m the corrected activities. Note that w e refer to this definition when using s y n o n y m o u s l y " b o m b inventory"
or "excess inventory" although assuming a constant prenu- clear background neglects the natural variability of 1 4C 02
activities in the atmosphere. A l s o bear in m i n d that about 5 x l 05 atoms 14C/g air o f the stratospheric activity excess over tropospheric values result not f r o m b o m b input but f r o m the altitude distribution o f 14C production b y cosmic ray neutrons [Lingenfelter, 1963; O'Brien et al, 1991]. T h e f o l l o w i n g
equation allows to convert f r o m corrected excess activities
^IES atoms/g air expressed in units o f 105 14C atoms per gram of air to corrected activities Ad p m / gc expressed in units o f d p m / g C :
Ai, lpm/g C :
AE5atoms/g air ^4
5M (1)
T h e values o f 5.64 and o f 7 4 are based on an atmospheric C 02
m i x i n g ratio o f 313 p p m (assumed to be constant), on the relative molecular mass o f carbon (12.01) and o f air (28.96), on the half-life of 14C (5730 years) and on a specific activity o f 13.1 dpm/g C for the "atmospheric prenuclear background in the early 1950s." Note that Telegadas [1971] and
Telegadas et al [1972] refer to 13.17 ± 0.04 dpm/g C as being 0.95 o f the National Bureau o f Standards ( N B S ) oxalic acid standard activity measured at the A r g o n n e National Labora- tory ( A N L ) . For the present investigation w e assume that their
measurement o f 13.17 dpm/g C was correct and lower than the modern value o f 13.56 ± 0.07 d p m / g C measured for 0.95 o f the N B S oxalic acid standard corrected for decay and frac- tionation [Karlen et al, 1968; Olsson, 1970; Stuiver and
Polach, 1977] due to the absence o f correction for 51 3C frac- tionation and for 14C decay in their laboratory. If, however, it comes out that our assumption is w r o n g and that the absolute activity measurements at A N L was too low b y J3 =
13.17/13.56, then all H A S L activities and all corresponding activities in the present paper must be multiplied with 1/J3 = 1.03. W e use the f o l l o w i n g equation to convert f r o m H A S L activities Adpm/g c expressed in dpm/g C to A1 4C expressed in per m i l (%o):
A1 4C {%c) = Aipm/gC
13.56 1 - 2 2 5 - 7 . 1
1000 1 0 0 0 - 1 0 0 0 , (2) assuming the same constant value o f - 7 . 1 % c for atmospheric 51 3C 02 [Hagemann et al, 1965] as in the H A S L reports. For the sake o f simplicity w e use the same constant factor o f 5.64 to convert f r o m activities in d p m / g C to activities in 105
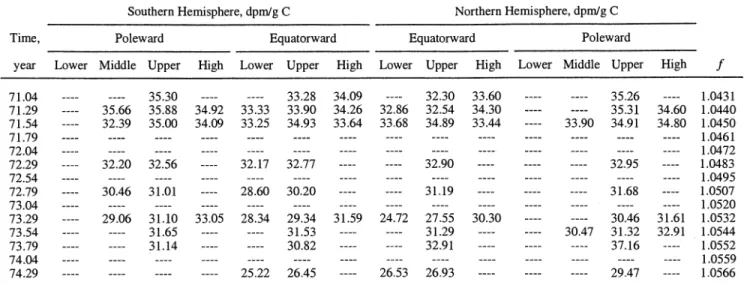
atoms/g air in all our figures except Figure 7. However, w e provide in Tables 1 and 2 the parameters D and / allowing to correct this conversion factor taking into consideration long- term variations o f the C 02 m i x i n g ratio. Finally, note that in H A S L report 294, Sowl et al [1975] used a multiplication factor o f 5.95, corresponding to an atmospheric C 02 m i x i n g
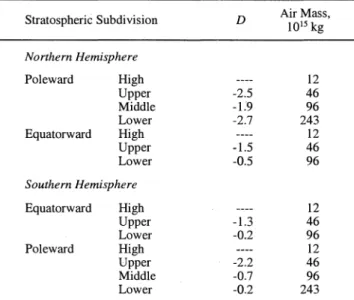
Table 1. Properties o f O u r Stratospheric Subdivisions for W h i c h M e a n 1 4C 02 Activities A r e Listed in Table 2
Stratospheric Subdivision D Air Mass, 1015 kg Northern Hemisphere
Poleward High 12
Upper -2.5 46
Middle -1.9 96
Lower -2.7 243
Equatorward High 12
Upper -1.5 46
Lower -0.5 96
Southern Hemisphere
Equatorward High 12
Upper -1.3 46
Lower -0.2 96
Poleward High 12
Upper -2.2 46
Middle -0.7 96
Lower -0.2 243
The parameter D completes the parameter / in Table 2 and approximates the difference expressed in ppm between the yearly mean C 02 mixing ratio in a particular stratospheric subdivision and the yearly mean CO2 mixing ratio observed at Mauna Loa station [Keeling and Whorf, 1990]. The values for D are best estimates for 1965 as calculated from stratospheric C 02 mixing ratios predicted by a carbon cycle model [Hesshaimer, 1997] optimally matching the mean 14C02 activities of Telegadas [1971] up to 30 km height. Bear in mind that D does not account for the seasonal variation of C 02
mixing ratio in the stratosphere which can have a mean peak-to-peak amplitude of up to 4 ppm in the northern lower poleward subdivision according to our carbon cycle model. Air masses for the different stratospheric subdivisions were calculated according to the U.S.
Standard Atmosphere (1976). The air masses of all stratospheric subdivisions sum up to a total of 1.102xl018kg which corresponds to 21.5% of the total dry air mass of the Earth atmosphere [Trenberth and Guillemot, 1994].
ratio o f 330 ppm, but w e rescaled these results b y
multiplication with 5.64/5.95 to remain consistent with the other H A S L reports.
T o avoid confusion, note that w e will always refer to activities expressed in the "absolute" scale, not in the " A " or in the "excess 1 4C" scale, w h e n comparing activities without particular specification o f the unit. For example, if w e write that a sample activity is lower b y 10% than another activity and if the other activity is 28.1 d p m / g C = 8 4 . 5 x l 05 excess 14C atoms per gram o f air or A1 4C ~ 1000%o, it means that the value o f the sample activity is 28.1x0.9 = 25.3 dpm/g C which corresponds to a depletion b y about 2 0 % o f the sample activ- ity value expressed either in excess 14C units (68.6x10s excess
14C atoms per gram o f air) or in A1 4C units (800%o).
2.2. Extent of the Survey
Nearly all northern hemispheric air samples f r o m the H A S L reports were collected over the American continent and over the Atlantic and Pacific Oceans. S o m e sampling took place in the region o f Singapore aboard United K i n g d o m air- craft. In the Southern Hemisphere the samples were collected over the A m e r i c a n and Australian continents and their adja- cent waters. T h e H A S L tables report the mean latitude, altitude and date o f each sample collection but not its mean longitude. Several distinguishing features prevent this lacuna f r o m being a major weakness o f the H A S L survey. In the Northern Hemisphere most o f the samples were collected over North A m e r i c a and the Pacific Ocean. These locations are longitudinally on the opposite side of the world with respect to the locations o f nuclear w e a p o n tests b y the former Soviet
U n i o n which injected about half o f the total b o m b 14C into the atmosphere. Therefore at least in the case o f Soviet detona- tions the corresponding 1 4C 02 activity excess observed over the United States and the Pacific Ocean should reflect zonal mean conditions over all longitudes at corresponding heights and latitudes. Furthermore, a comparison between a set o f H A S L samples collected over the United States between 4 0 ° N and 8 0 ° N and observations at about 6 0 ° N and 7 ° W to the northwest o f the British Isles (Figure 1) reveals a great similitude o f activity excursions after strong nuclear detonations w h i c h took place at about 6 0 ° E over the former Soviet U n i o n . B o t h the time delay between nuclear detona- tions and 1 4C 02 activity increases as well as the similar amplitude o f corresponding peak activities shown in Figure 1 indicate that the b o m b 1 4C 02 input signals were longitudinally homogenized within about 1 month. For the above reasons w e consider that quarterly means o f the H A S L activities represent valid zonal means, and w e do not analyze the longitudinal repartitioning o f 1 4C 02 activity in our study.
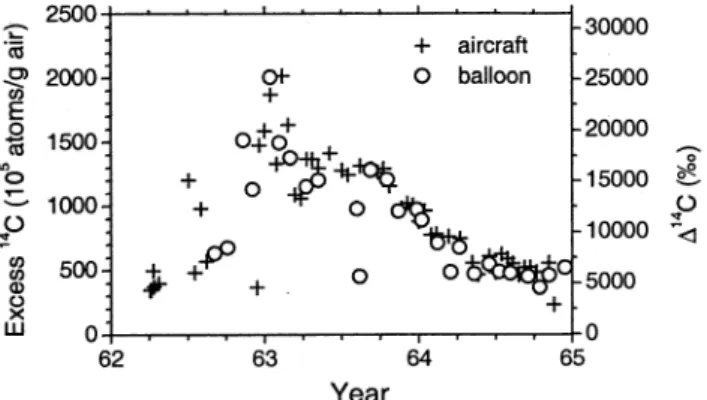
T h e height versus time representation o f sampling locations in Figure 2a shows that above 2 0 k m most H A S L samples were collected during balloon flights, whereas below 20 k m and after 1960, aircraft sampling was preponderant. In a small region, balloon and aircraft sampling locations overlap well enough between 1962 and 1965 to allow comparison o f both sets. T h e 1 4C 02 activities o f single samples collected in this region show a good agreement between balloon and aircraft observations (Figure 3). T h e height versus latitude represen- tation o f sampling locations in Figure 2c reveals that the H A S L survey was m u c h denser in the Northern than in the
A A A A A A A
I JIA ' S ' O ' NID I J ' F ' M ' A ' M ' J ' J ' A ' S ' O ' N ' D 1957 1958
Year
Figure 1. (a) Observations o f 1 4C 02 activity in stratospheric air between 10 and 15 k m above sea level (asl) f r o m the H A S L reports along with (b) reported strengths o f nuclear w e a p o n detonations expressed in equiva- lent megatons ( M t ) o f T N T [Rath, 1988]. Crosses, activity o f samples collected until 1959 aboard United K i n g d o m aircraft to the northwest o f the British Isles (approximately 60°N, 7 ° W ) . Solid squares, activity o f samples collected above the United States. T h e dashed line in Figure l a indicates the background 1 4C 02
activity in the northern hemispheric troposphere [Tans, 1981]. T h e activity is expressed in units of 105 excess
14C atoms per gram o f air on the left-hand side o f the figure and in the A scale on the right-hand side. Open triangles in Figure l b indicate w h i c h nation was responsible for a given nuclear detonation. In the former Soviet U n i o n (FSU), nuclear b o m b s were mostly detonated between 5 0 ° N and 8 0 ° N f r o m 4 5 ° E to 80°E. T h e m a j o r British ( U K ) and A m e r i c a n ( U S A ) nuclear tests took place over the Pacific Ocean between 0 ° N and 2 0 ° N f r o m 170°E to 1 5 0 ° W at that time. T h e solid line in Figure l b traces the total strength o f all b o m b s detonated w o r l d w i d e since 1945 (right axis scale).
40- 35- 30- (J) 25- E 20-
•4—•
f—
O) 15- 'CD X 10-
N 90-0-
60- 30- 0-
"(0
—1 -30- -60- s -90-
40- 35- 30- 03 CO E 20-
15-
"<D X 10-
5-
54 56 58 60 62 64 66 68 70 72 74 Year
HASL-observations: o balloon + aircraft A ground
Figure 2. (a) Height versus time, (b) latitude versus time, and (c) height versus latitude representations o f
1 4C 02 sampling locations f o u n d in the H A S L reports and in other publications. In the H A S L locations a dis- tinction is made between ground level samples (solid triangles), balloon samples (small open circles), and aircraft samples (pluses). T h e sampling locations of observations f o u n d in other publications are reported using open squares [Fergusson, 1963], open diamonds [Godwin and Willis, 1964], large open circles [Berger et al, 1965], open d o w n triangles [Nydal and Lovseth, 1983] and open up triangles [Walton et al, 1970]. T h e samples o f Fergusson and o f Berger et al. were collected over the continental United States and the Carib- bean, those o f N y d a l and Lovseth were collected over N o r w a y , and those o f G o d w i n and W i l l i s and o f W a l t o n et al. were collected in the vicinity o f the British Isles.
Southern Hemisphere with a particularly high sampling den- sity between 5 ° N and 75 ° N at altitudes ranging f r o m 15 to 22 k m . In the Southern Hemisphere the sampling density is high o n l y near 40°S. A l s o note that balloon sampling in the strato- sphere u p to 30 k m or higher was concentrated near six singular latitudes. H o w e v e r , Figure 2b shows that only the balloon profiles sampled near 3 0 ° N cover almost continuously the time range between 1955 and 1972. Furthermore, Figure 2b reveals that the period with particularly dense atmospheric sampling in the Northern Hemisphere ranges o n l y f r o m m i d - 1963 to early 1967 and that the latitudinal sampling was relatively sparse in 1960 and 1961.
3. Determination of the Stratospheric Bomb
14C Inventories
Telegadas [1971] summarized the 1 4C 02 data between 1955 and 1969 published in the H A S L reports b y judiciously subdividing the stratosphere up to 30 k m o f each hemisphere into four compartments (Figure 4) for w h i c h he determined the time variation o f the b o m b 1 4C 02 burden. T o determine his inventories, Telegadas subdivided the year into four quarterly intervals (December-February, M a r c h - M a y , J u n e - A u g u s t , and S e p t e m b e r - N o v e m b e r ) , inserted all H A S L observations sampled during a quarterly interval into a height versus lati-
30000 25000 20000
o -15000 §S
O -10000 ~<j -5000
0 Y e a r
Figure 3. T h e 1 4C 02 observations f r o m balloon samples (open circles) are compared with activities o f samples col- lected aboard aircraft (pluses). T h e comparison is restricted to a small region ranging f r o m 3 0 ° N to 3 5 ° N and f r o m 19.5 to 20.5 k m asl where balloon and aircraft H A S L data overlap.
T h e activity is expressed in units o f 105 excess 14C atoms per gram o f air on the left-hand side o f the figure and in the A scale o n the right-hand side.
tude representation o f the atmosphere, drew hand-made contour lines to interpolate the observed 1 4C 02 activities, and finally integrated the interpolated activities over each o f his stratospheric subdivisions. Corresponding mean 1 4C 02 activi- ties can b e obtained after division o f these inventories b y the air mass o f each compartment as specified b y Telegadas [1971].
3.1. N e w Calculation and Comparison W i t h Telegadas Here w e apply the procedure o f Telegadas [1971] to the entire H A S L data set using exclusively numerical methods.
A f t e r collection o f the data into quarterly diagrams subdivided like those o f Telegadas w e use a Delaunay triangle-based lin- ear interpolation [Fortune, 1987] to determine the activities inside the c o n v e x hull o f all quarterly sampling locations (see Figure 5a). W e refer to section 3.2.2 for details on our D e l a u n a y triangulation. T o obtain partial 1 4C 02 inventories, the interpolated specific activity is integrated versus air mass over the intersection between each stratospheric subdivision and the c o n v e x hull o f sampling locations. T h e integration is based o n an adaptive recursive S i m p s o n ' s rule and uses the barometric formula as prescribed in the U.S. Standard A t m o s - phere (1976) for the conversion f r o m height to pressure. W e finally obtain mean 1 4C 02 activities for each stratospheric subdivision (Figure 6) w h e n dividing its partial inventory b y the air mass o f its intersection with the convex hull o f sam- pling locations. T h e corresponding activity values expressed in d p m / g C are listed in Table 2. For each stratospheric subdi- vision the data coverage is interpreted as a confidence value attributable to the corresponding mean activity (shaded bars in Figure 6) w h i c h is obtained f r o m the ratio o f the subdivision air mass included in the c o n v e x hull o f sampling locations divided b y the subdivision's total air mass listed in Table 1.
For example, a stratospheric subdivision with 100% o f data coverage is entirely included in the corresponding quarterly c o n v e x hull o f sampling locations.
Our results compare well with those f r o m Telegadas [1971] except in the m i d d l e poleward subdivision o f the Northern Hemisphere where our activities are lower b y 2 0 % until m i d - 1 9 6 2 then b y 3 0 - 5 0 % until early 1963 and b y 10%
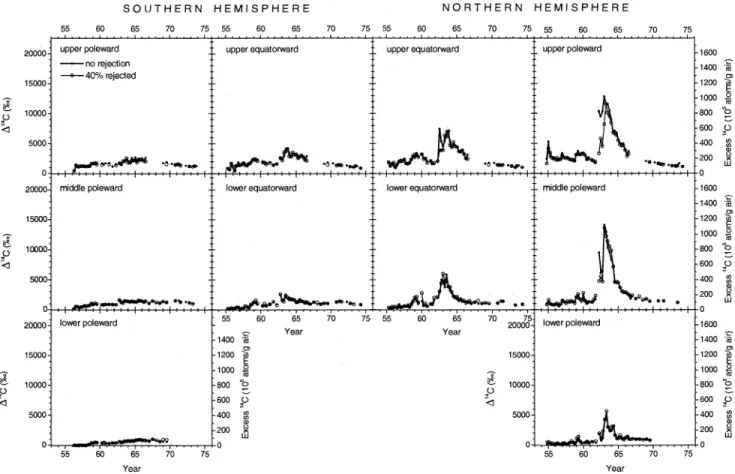
after (Figure 6). L o o k i n g more into the details o f the compari- son reveals some further noticeable differences. In the northern lower equatorward stratosphere during 1963 our compilation peaks at activities lower b y 3 0 % . In the northern upper stratosphere our activities in 1962 rise steeply about half a year earlier m a i n l y due to a sharp peak in the upper equatorward subdivision. In the southern upper stratosphere between m i d - 1 9 6 3 and m i d - 1 9 6 6 w e find values higher b y 2 0 % than those o f Telegadas. Note that in both hemispheres the smallest observational coverage until 1970 is f o u n d in the upper poleward subdivisions. In the Southern Hemisphere the observational coverage is often less than 5 0 % , but this is not critical due to a large dilution there o f the m a i n l y northern hemispheric nuclear b o m b input signals. In terms o f the total stratospheric b o m b 14C inventory, Figure 7a shows that the results o f what w e w i l l call our standard calculation do not differ m u c h f r o m the results o f Telegadas [1971].
A s one example illustrating the accuracy o f our standard calculation, let us examine the 1 4C 02 input through a Chinese b o m b equivalent to 3 M t o f trinitrotoluene ( T N T ) detonated at 4 0 ° N in J u n e 1967 w h i c h is far the strongest nuclear test reported for the years 1965 to 1967 [Rath, 1988; Yang et al., 1999] and should produce about 3X10² 6 atoms 14C corre- sponding to a standard yield o f 1026 atoms 14C per megaton o f
km a s 4 0
30-
21
15
9 -
0
high equatorward high poleward
upper equatorward upper poleward
lower equatorward middle poleward
lower poleward
0 ° E q u a t o r
r
± 3 0 ° Latitude
Q_
</)
O
Cf)
£
CD _C Q_CO O Q . O
± 9 0 ° P o l e s Figure 4. Schematic subdivision of the stratosphere as used b y Telegadas [1971] in each hemisphere to determine his b o m b 1 4C 02 inventories. T h e dotted line in the upper and high stratosphere and the gray background in the high stratosphere indicate that Telegadas did neither subdivide the upper strato- sphere nor account for the high stratosphere as w e did. T h e thick line represents the tropopause. Notice that Telegadas placed his vertical subdivisions at 0, 30, 50, 70, and 100 k i l o - feet and w e approximated these values b y 0, 9, 15, 21, and 30 k m to determine our inventories. T h e air mass contained in each o f our subdivisions is listed in Table 1.
South Latitude North South Latitude North
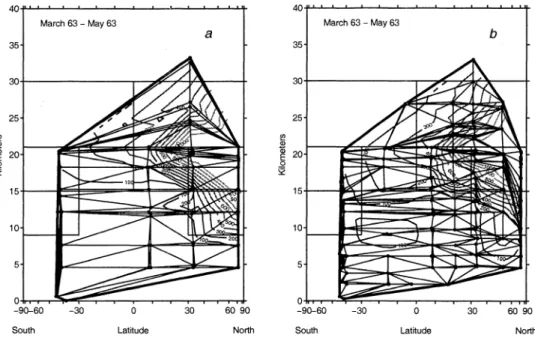
Figure 5. (a) Specimen o f a quarterly collection o f H A S L sampling locations (thick solid circles) obtained for M a r c h - M a y 1963. T h e thick line represents the convex hull o f the quarterly sampling locations. T h i n lines connecting the sampling locations represent segments o f the D e l a u n a y triangulation on the base o f w h i c h the
1 4C 02 activities were linearly interpolated to determine 1 4C 02 inventories. Contour lines o f the obtained inter- polated 1 4C 02 activities up to 1000x10s atoms/g air are also put under the figure. For better understanding w e did not draw the slight distortion o f triangle and hull segments due to the fact that our interpolation procedure took place in a Cartesian latitude-height geometry, whereas a sinusoidal representation o f the latitude is used in the figure. A l s o note that w e used the mean activity for locations repeatedly sampled in the quarterly dia- grams, (b) Same as Figure 5a except that the contours and triangulation refer to a new set o f sampling points based on the original quarterly sampling set shown in Figure 5a. See section 3.2.2 for more explanations.
T N T [Hesshaimer et al, 1994]. Telegadas [1971, p. 11]
e x a m i n e d the same detonation and concluded that his strato- spheric inventories do not reflect this explosion " . . . p r o b a b l y because the debris had little chance to spread latitudinally into the limited sampling network." In contrast, scrutinizing the results o f our standard calculation in Figure 6 reveals an increased 1 4C 02 activity in the lower stratosphere o f the Northern Hemisphere w h i c h w e can estimate in terms o f 14C atoms using the results listed in Table 2. For the northern lower equatorward stratosphere the mean activity increase between early 1967 and m i d - 1 9 6 7 is 3.25 d p m / g C which cor- responds to 1 . 8 x l 02 6 atoms 14C in the entire subdivision. In the northern lower poleward stratosphere the seasonal mini- m u m in m i d - 1 9 6 7 has been filled up b y 14C resulting f r o m the detonation. W e compare the activity difference between m i d - 1966 and early 1967 with the activity difference between m i d - 1967 and early 1968 and estimate that this filling up
corresponds to about 0.5 dpm/g C = 0 . 7 x l 02 6 atoms 14C. T h e s u m o f 1.8+0.7 = 2 . 5 x l 02 6 atoms 14C already represents a rea- sonable lower limit for the expected total input o f 3 x l 02 6
atoms 14C, although it does not include a corresponding bal- ance for the northern m i d d l e poleward stratosphere which cannot be determined in a simple w a y f r o m the observations.
H o w e v e r , for a b o m b detonated at 4 0 ° N w e expect that the
14C inputs to the middle poleward and to the lower equator- ward subdivisions are o f comparable magnitude and this indicates that the yield o f 1026 atoms 14C per megaton o f T N T is too l o w if the detonation strength o f 3 M t o f T N T is correct.
3.2. Estimation of Errors in the Inventories due to Data Selection and Interpolation
In Figure 6 w e report as "percent o f data coverage" the portion o f air mass contained in the c o n v e x hull o f sampling locations, although this validity estimator o f the mean 1 4C 02
activities can be substantially biased. In the worst case during a given quarterly interval a subdivision could be 1 0 0 % inside the c o n v e x hull o f sampling locations without any observa- tional sample in it. T h i s is w h y w e further examine h o w far two categories o f errors reduce the validity o f our mean activities based on the H A S L survey. In the first category w e estimate errors related with data selection in time, space, and activity level, and in the second category w e scrutinize inter- polation choices o f more numerical type like the coordinate system units, the p o l y n o m i a l order or the triangle mesh struc- ture and estimate their impact on the obtained activities.
3.2.1. Errors due to selection. W e split up the H A S L observations into quarterly intervals to determine mean 1 4C 02
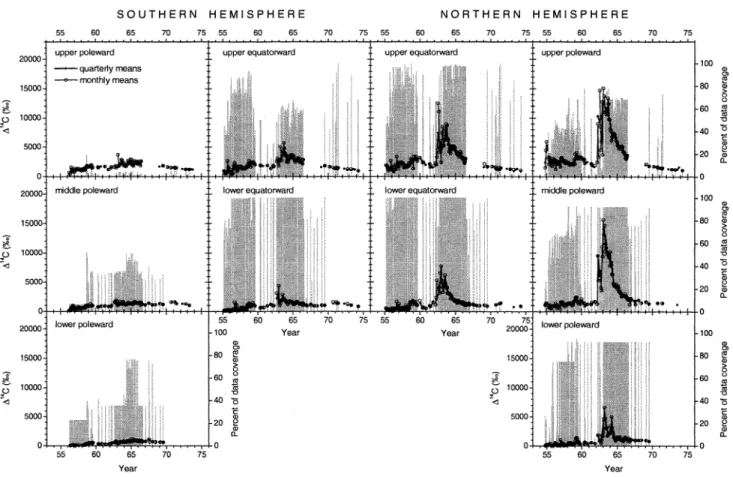
activities in the stratospheric subdivisions. This corresponds to a data selection on the time axis and has the drawback o f possibly smoothing d o w n the main activity peaks. In Figure 8 this impact is estimated through comparison between activity curves resulting f r o m quarterly and f r o m monthly data selec- tion. Altogether the compared curves match well and thus indicate that the signal to noise level o f the monthly mean stratospheric activities is still good enough to reflect real mean air mass m i x i n g processes occurring on this timescale.
Figure 6. Comparison between our standard calculation o f mean stratospheric 1 4C 02 activities based on the H A S L observations (thin lines with open circles) and the results published b y Telegadas [1971] (thick lines with small solid circles). See Figure 4 for a description o f the stratospheric subdivisions. T h e shaded bars rep- resent estimates o f the quarterly observational data coverage within each stratospheric subdivision (see section 3.1). Telegadas determined only the mean activity for the entire upper stratosphere o f each h e m i - sphere so that his results there have to be compared with the mean o f our results for the upper poleward and the upper equatorward subdivisions in each hemisphere (dashed lines with crosses).
T h e expected smoothing d o w n o f predominant northern activity peaks reveals to be 2 0 - 3 0 % in the lower stratosphere and o n l y 10% in the m i d d l e poleward subdivision. In the upper northern stratosphere noise seems to prevail during 1962 and 1963, but this comes together with data coverage less than 5 0 % (right axes in Figure 8) indicating that m a j o r parts o f these subdivisions remained unobserved. Note the w e a k observational substantiation (less than 3 5 % o f monthly data coverage) o f the highest monthly activity values in the northern upper equatorward subdivision toward mid-1962.
T h i s w e a k substantiation indicates that the peak in the corre- sponding quarterly mean w h i c h was already mentioned in section 3.1 m a y well be an artifact.
D u r i n g the H A S L survey latitudinal sampling in the North- ern Hemisphere was concentrated near 10°N, 30°N, and 7 0 ° N apart f r o m a period o f intensive sampling between 1963 and 1967 (Figure 2b). T o estimate the impact o f latitudinal sam- pling density, w e reject all observations located between 11°N and 2 9 ° N and between 3 5 ° N and 6 9 ° N f r o m 1963 until 1967 and re-calculate mean stratospheric 1 4C 02 activities. Figure 9 s h o w s the results in the only three subdivisions where the rejection has s o m e effect. A noticeable deviation is observed in the lower poleward subdivision and indicates that most o f the information about the strong activity peak observed in
1964 was confined between 3 5 ° N and 7 0 ° N . Elsewhere the high-density latitudinal sampling adds remarkably little information with respect to mean 1 4C 02 activities even during
1963 to 1964 when very high activity gradients passed through the stratosphere. This fact confirms the H A S L obser- vations as qualified to determine 1 4C 02 inventories in the stratospheric subdivisions during periods o f less intensive latitudinal sampling.
W e also added Figure 10 to m a k e clear that quarterly mean
1 4C 02 activities determined for the high-altitude layer between 3 0 and 4 0 k m are lower than mean activities found in the underlying upper stratospheric layers during a couple o f years after the main b o m b 14C injections. This observational evi- dence contributes to refute the occasionally discussed hypothesis [Johnston, 1989; Hesshaimer et al, 1994] that
extremely high activities w h i c h correspond to major hot spots o f b o m b 1 4C 02 residing in the very high stratosphere escaped the H A S L network because it extended o n l y up to 4 0 k m .
Further sources o f uncertainty in our 1 4C 02 inventories m a y reside in a distinct sensitivity to isolated samples with par- ticularly high or l o w 14C activity. W e test this impact b y rejecting about 4 0 % o f the quarterly H A S L observations before determining the 1 4C 02 inventories with our standard procedure. T h e selection o f the quarterly data in each subdivi-
T a b l e 2. R e s u l t s F r o m O u r Standard C a l c u l a t i o n o f M e a n 1 4C 02 A c t i v i t i e s (See F i g u r e 6) f o r the Stratospheric S u b d i v i s i o n s o f T e l e g a d a s (See F i g u r e 4).
Southern Hemisphere, dpm/g C Northern Hemisphere, dpm/g C
Time, Poleward Equatorward Equatorward Poleward
y e a r L o w e r j v n a a i e U p p e r H i g h L o w e r U p p e r SA 7 0
J 4 . ly SS (\A J J . U 4 ss 9 Q
j j . Z y \AAA
1 4. 4 4 OS CO Z J . J3 ss SA
J J . J4 1 A OC
1 4 .
9 0 91 Z 3. Z 1 C C 7 0
J J . fy
1 C 9 9 1 J . 22
o o n/c 3 / .UO C/C C\A
J 0 . U 4
1 /c /in i o . 4 y
OO O/l Z / . / 4 C/C OO
j O . Z y 1 A 1 O 1 4 . 1 j
1 /C AO 1 0 .4 Z
1 n C/i i y . j 4
1 C /C/1 I J . 0 4
o 1 n/£
Z 1. U 0 c/c c/i
j 0 . j 4 1 o o o
1 3 . o / O 1 /I /C Z 1. 4 0 OO O/C Jz.oO
1 n o n
— l y . z u
o 1 n c 3 i . y j C £ 7 Q
J O . ly 1 1 C £ 1 3 . 0 0 9 9 7 0 Z Z . / J 9 0 7 H z y . / u
9 1 SO Z I . J Z
/ i n 1 Q 4 U. l o c o n/i
j / . U 4 1 A C\A
1 4 . U 4 1 O OO l o . / 3 o o m 1 C /CC l j. O J OO /CO 3 3. 0 3 r n o n
J / . Z y 1 A 1 O 1 4 . 1 Z
1 n o o 1 9 .O J O 1 O/l
j l . 3 4
1 C /CO
— I J . O O
o o n o 3 3 . 9 / CO C/I
j / . J4 1 /i n o
1 4 .U / o o m Z Z. U 1 OO HA 52. / 4
1 o n o l o. U J 4 U . 1 4 A n 1 /i 5 7 . 7 9 1 3 . 4 2 OO 1 /C
3 0 . 9 3 2 0 . 8 3 3 4 . 8 2
c o n/i J 5. U 4 1 'J /IO
1 3 . 4 Z o 1 i n Z l . / 9 O 1 1 o
3 1 . l o
o o o n
— z z . 3 y
o o n/c 33.1)0 c o o n 1 C /1/C
1 0. 4 0 OO O 1 25.21 O 1 1 ^
3 1. 1 0 1 o o n O/C CO
3 0 .J O CO C/1
J 5 . J 4 1 C O/l
1 0. o 4 2 5 . 9 0 3 2 . 4 5 — 2 7 . 2 8 4 0 . 7 4 c o o n
J O . fy 1 O CO
1 O . J O 2 8 . 6 1 3 8 . 3 4 — 2 5 . 9 7 4 6 . 3 4 5 9 . 0 4 1 7 . 6 3 O C C 1
Z O . o l 3 7 . 8 2 — 3 0 . 3 6 4 6 . 8 7 c n o n o n o 1
Z U . Z 1 n o/c
Z / . j o AC\ /IO 4 U. 4 Z
o n /co 3 U . 0 5 A O OO
4 o . / Z f f t C/1
J9 .J4 o n 1 c Z U .l o OC CO"
Z O . O / o n o i
3 9 ./ I o c n o
Z J. 9 3 A /C /cn 4 o . o 9 c n o n
j y . / y /Cn <"M 0 U. U 4
6 0 . 2 9 1 8. 1 1 2 4 . 1 8 3 7 . 3 8 — 2 2. 0 9 4 2 . 5 0
6 0. 5 4 1 8 . 3 1 2 4 . 8 4 3 5 . 4 7 — 2 3 . 7 4 4 1 . 0 9 /Cn On
o u . / y
1 o o o l a . 5 5 O/C o o Z 0 . / Z
O O /CO
3 8. 0 3 — 2 3 . 4 9 3 9 . 4 7 /C 1 n/i
0 1 . U 4 „ _ _ -__ ____
/c 1 o n 6 1 . 2 9 1 O /C/C
1 / . o o 2 6 . 8 2 3 8 . 5 8 — 2 7 . 2 7 4 0 . 8 2 /C 1 C/1
0 1. J 4 /C 1 T O
0 1 . ly 1 Q on O C C1
Z 0 . 0 1 o n o o
3 U . /o o n m
— 3 u . y i
OO /CC 3 3. 0 J /CO H/1
O Z . U 4 /co on
O Z . Z y 1 n o n 1 9 . / 9 O/C A 1 Z 0 . 4 1
o c o n 3J . O9 O/C C/l Z0 .J4
o/c o n 3 o . o y /CO C/1
0Z . J4 /co ? n O Z . / y OO CO
Z J . J J o/c n 1 J O. y l o o n c
3 / . 9J — 4 7 . 9 7 c n o i
J U. 3 1
£ 1 C\A
0 3 . U 4 0 1 *c< Z 1 . 0 0 O 1 OC 3 1 . Z 0
O/C CI 3 0 .D l
OO CC - — 3 3 .J J
/io /in 4 5 . 4 U
^ 1 OQ
0 3. z y onZ U . 3 1 o1 on3 U . 0 U /cn / i n C\A OO f\A 3 o. U 4
C/i n o
£ 0 SA
0 3 . 0 4 9 0 n n Z J . U U oc3 0 . 1 U 1 n A A 4 4 . o y
/1Q OA 4 y . Z 4
0 1 A Q 11.4o fx'X 7 Q
O J . ly 9 9 £S\ OO 7 ^ J J . / o
A& 7 0 4 0 . / y
/ i n oc
4 U . Z D 7 0 OO / z . y j 6.A f\A
0 4 . U 4 OA &S Z 4 . 0 0 0 1 0 7 3 3 . 3 / 4 04 3 . 4 U AC\ 0 ^ C/1 3 0 .o 4 0 1. 0 0
&A 7 0
0 4. z y OA 1 1 Z 4 . 1 J o n n n
3 u . y u AC\ SO O^i £*£x 3 0. 0 0 <.i fn J J . O /
£/1 C/1
0 4 . 3 4 OS £ 1 Z 0 . 0 3 0 0 0 7 3 3. 5 / J U . J I OO o o 3 o . Z Z /^n n 0 U. 3 1 64. 7 0
0 4 . / y 94. 1 8
Z 4 . J O 1 1 7 1 J J . / 1 AS (Y) 1 6 0 1
— J O . V l
S9. 0 7 j o . y /
&S C\A
0 J . U 4 9 7 ^ n z / . o u 0 1 QC. ^ 1 0 7 J l. J / i r \ < i 3 U . J 3
/^n OU.Oo
&S 7 0 o j . z y
9 6 9 0 z o . z y
H 9 ^ J J . Z J A 1 0 9
4 i . y z
11 0 0
— j i . y y
<1 n/i J 1 . U 4 6 S SA
O J . J 4
9 6 0 1 1 6 1 ^ J O . 1J A9. I D 'to. J U 1 6 9 0 J O .z u ^ 4 11 Jt. 1J 6*5 7 0
O J . ly 9 7 1 7 Z / . 1 / 14. 0 0 A9. 1 9 M-0.1Z i i n i J J . U J ^ 7 9 1 J / . Z J fif* 04.
OO.U4 9 6 9 4 Z O . Z 4 J J . J U 4 0 6 £
^•y.oo
11 8 4 J 1. 0 4 ^ 1 1 A J J . J 4 6 6 9 0 9*» 7 9 Z J . /Z 1 9 4.H 44. 6zL 9 0
— z y . j j 4 7 9 4 •4- / . Z 4 6 6 SA 9 4 . 8 7
Z 4 . 0 / 0 9 J J .! 7 Z
S O 6 S
J U . O J 1 1 1 4 J J. l t S 4 0 8 J H . U O 6 6 7 0
o o . / y 9 7 <.9 Z / . J Z
6 7 0 4
O / . U 4 OA SA Z 4 . 3 4 9 0 n o 9 7 1Z / . 1 4 A 6 7 9 0
6 7 . 5 4 2 8 . 5 4 3 3. 2 4 3 1 . 0 1
6 7 . 7 9
6 8 . 0 4 2 4. 3 3 2 9 . 7 2 2 7. 0 0
6 8 . 2 9
6 8 . 5 4 2 3 . 1 2 2 9 . 8 9 2 6 . 7 1
6 8 . 7 9
6 9 . 0 4 2 2. 7 0 3 2 . 9 7 3 8 . 5 1 2 8 . 3 5 3 6 . 9 0 6 9 . 2 9
6 9 . 5 4 2 2. 4 1 3 0 . 4 8 4 0 . 3 7 2 7 . 9 4 3 9 . 6 8 6 9 . 7 9
7 0 . 0 4
7 0 . 2 9 3 6 . 8 5 3 7. 4 4
7 0 . 5 4
7 0 . 7 9 3 5 . 5 0 3 5. 1 1 3 2 . 4 0 3 4 . 2 5
U p p e r l i i g n L o w e r M i a a i e U p p e r H i g h J 1 6 n 7
1 0 . U / 9 8 8 8
Z 5 . 5 5 A 7 Ifs 4 / . IO 1 n m ^ 1 . U U l J 1 8 8 1 1 5 . 5 J i i n 4
J J . U 4 8 8 ^9
5 5 . J Z 1 n m Q i . u u i y 4 n i / i
4 U . J 4
1 7 9 8
1 / . Z 5 9 8 9 n Z 5 . Z U SO 1 8 J Z. J 5 1 (\(\OA 1 . U U Z 4 i n 1 8
J U . l o
1 6 ^ ^
1 0 .J J 9 ^ 1 9 Z J . I Z *\9 9 ^ J Z . Z J 1 O O 9 0 i . u u z y 1 ^ 7 C
3J . /O
1 ^ 1 / 1 1 J . 3 4 9C. QO
Z j . y y sr\ 9 0
D U . Z 5 1 n n i i
1 . U U 3 3 11 &C\
3 1 .OU 1 £ £ 7 1 0 . 0 / 9 8 1 1 Z o . 3 3 < n i £ J U. 3 0 1 n m s 1 . U U J 5 O/C 1 n
Z 0 . 1 U 1 Q /CC
i y . o j O^C OO z o . y s
/i/i n^c
4 4 . UO 1 n n / i i
1 . U U 4 3 O C C/C
3J . J0
1 c n c 1 J . U J
OO CO
Z3 .J3 A
C 1 O 4J. 1 /
1 nn/i o l . U U 4 o /IO QO
4 3 . o Z
1 C 1 A 1 j . 1 4
o c o c Z J . Z J /IO 0/1
4 / . o 4
1 n n < 9 I . U U J Z A C /I C
4J. 4J
1 O A C 1 1 AD
O/C o o 3 0 . 3 o
/cn o 1 1 n n c o
I . U U J / 4 4 . 9 1 1 n o n 1 9 . 3 9 O 1 o o
3 1 . 3 3 CI o o
5 1. 5 5 . . . . 1 n n / c o 1 . U U o Z /1 /C /I c
4O. 4J 1 a n o o n c n
3 U. J 9 c 1 o n
M . 3 U 1 nn/c/c
l . U U o o 3 7 . 8 4 A A OO
4 4 . / / 1 6 . 7 7 3 1 . 2 9 4 9 . 2 2 A £L CO 4 6 . 5 7 1 . 0 0 7 1
3 7 . 6 4 2 0 . 1 9 3 2 . 7 9 4 8 . 1 8 1 . 0 0 7 6
3 8 . 7 1 2 0 . 2 0 3 3 . 7 9 4 5 . 0 6 1 . 0 0 8 0
4 6 . 1 0 2 1 . 1 8 3 2 . 0 8 4 4 . 7 5 1 . 0 0 8 5
5 3 . 7 3 4 5 . 2 3 1 7 . 5 5 3 2 . 0 4 4 3 . 5 4 4 5 . 7 7 1 . 0 0 9 1
5 0 . 8 1 2 2 . 7 0 4 3 . 8 5 5 7 . 4 1 1 . 0 0 9 6
6 1 . 4 4 4 4 . 8 3 2 6 . 4 7 4 4 . 1 9 6 6 . 0 7 4 8 . 3 4 1 . 0 1 0 1 5 4 . 3 9 4 6 . 8 9 2 1 . 7 1 3 7 . 0 3 5 7 . 4 5 5 0 . 1 9 1 . 0 1 0 7
1 7 . 9 9 3 6 . 0 0 6 1 . 1 1 1 . 0 1 1 4
5 8 . 4 3 4 1 . 2 3 6 1 . 0 1 1 . 0 1 2 0
5 0 . 2 4 4 8 . 7 6 1 9 . 1 5 3 4 . 5 6 5 7 . 5 9 5 3 . 4 2 1 . 0 1 2 7 4 8 . 7 5 4 9 . 9 4 2 2 . 5 7 2 7 . 8 4 4 7 . 1 1 5 2 . 6 0 1 . 0 1 3 4
4 1 . 9 1 1 9 . 1 1 3 2 . 0 8 4 9 . 0 7 1 . 0 1 4 1
1 m A o 1 . U 1 4 5
4 3 . 9 8 2 1 . 9 1 3 1 . 3 2 4 5 . 4 2 _ _ _ _ 1 m C/i
l . U l J4
o c o n O A OO
3 4 .2 5 o n o o 3 y . 15
1 m /c 1 1 . U 1 0 1
o/c n n 1 n n o
l y . y z OO A O 3 o . 4 /
o o o o
51 .y 2 1 m *co 1 . U 1 0 / 1 m o o l . U l 15 /I 1 o o
4 1 .1 2 o n o n 3 y . z u
AC\ o c 4 U . 3 D
1 /IO o o 1 4 / . / /
1 CO CO i j y . j /
/cc m
O J . U I i m o o l . U l / 5 1 1 O /C/I
1 1 5 . 0 4 CO o c j / . 3J O/l QO
Z 4 . o o 1 n n o 1 1 U U . Z 1 1 AH OO
1 4 / . Z o /C 1 o o 0 1 . 3 / 1 m1 . U 1 5 4 QA o n o 1
o y . 3 1 /1/C A 1 4 0 . 4 1
o n /co
3 U . 0 Z 1 n c o o l U J . Z o 1 CO 6.1 1 J o . O l
^ n o o O U . Z o 1 m o o
i . u i s y o o n o
/ / . y / A 1 OO 4 1 . / /
O/l CO / 4 . j y
O 1 o o c Z 1 Z . 3 D 1 O/l o o
i y 4 . y z
0 0 . 3 3 o o 1 m OA i . u i y 4 o n n o
o y . y o c n o c j y . Z j O 1 o o o l . 25 1 n/c c n l y o . j y
1 O O 1 0 i / y . i o
OO 1 C / y . i J
1 m o o i . u i y y 1 1 O O A
1 1Z.O4 OO CO O Z . J3
C/C O 1 J O . 3 1
1 CO O 1 1 J 5 . / 1
1 OO 1 c 1 /1 AD
O C O/C ID.yo
1 C\OC\A 1 . U Z U 4 1 1 o o c 1 1 Z . 3 J OO T J
o o . ID
/I C O 1 4J. / 1
1 A O CO 1 4 / .J Z
1 /C1 A 1 1 0 1 . 4 1
HA OO / 4 . 3 3
1 n o n o i . u z u y n n o o
y u . o z OO CO
/ 3 . J / /1/C o c 4 0 . / o
1 o n o o
1 3 U . 12 1 / i n c o 1 4 U . J / 8 7 0 9 o 1.22
1 n 9 1 A 1 . U Z 1 4 o o o c / 1 .2D /cc o n 0J . 10 CO o o
j y . z y
1 1 /C 0 1 1 1 0 . 5 1
1 1 11 1 1 . U 4 C\A IS Ad 1 J. 4 U 1 n 9 1 o i . u z i y o o /in
o 3 . 4 U 7 C <^7 / J. O / 0 7 /1C 3 / . 4 5 7 0 m / y . u i
11 A 1 n 1 1 4 . 1 U
7^. A 7 / J. O / 1 C\00A 1 . U Z Z 4 7 Q <1
/ y . j i /^i i n 0 3 . 3 U
9 Q 1 A z y . i 4
IS Q 7 / j . y /
1 n o fx(\
l u y . o u 7 n ^ i / U . J J
1 0 9 9 0 i . u z z y o o o o / / . Z 3 0 J . 1J o/i c n
3 4 . 5 U 7 ^ 7 7
ID. 1 1 Q O fxC\
y j . o u
7 n !£>. IV. IO 1 n 9 i ^ 1 . U Z J J 0 0 . 4 D /l^ &s 1 n
0 0 . 1 U i i n o 3 3 . u y (*A 1 £ 0 4 . 1 0 QS 7 1 5 J . /1 7 1 7 1 / 1. / J 1 n 9 A O 1 . U Z 4 U 6 4 0 8
0 4 . y o 6 0 6 4
o y . 0 4 9 8 81 Z o . o i Sf\ 9 0
j o . z y 8 1 6 8 0 J . O O 7 4 9 S / 4 . Z J 1 0 9 4 . 6
£ 8 9 0 0 o . z y
£ 8 0 5 . 0 0
9 8 ^8
Z S . J 5 SA 1 <\ J 4 . 1 j 8 4 1 9 5 4 . 1 Z 7 1 0 4 / j . y 4
1 0 9 ^ 9 1 . U Z J Z SQ 1 1
j y . i i 6 4 01
0 4 . y i 11 *\9 J 1 . J Z <.1 7 9 J J . / Z 7 n 1 1
/ U . J 1 6 7 8 8 O / . 5 5 1 0 9 ^ 8 1 . U Z J O AO C\A 6 1 9 6 O l . Z O 1 1 ^ 7 J J . J / S(\ (\S J / . J U ^ 7 ^O 6 1 8 9 O J . 5 Z 1 0 9 6 4
^ 7 4 1
J / . 4 1 6 1 SA 0 1 . J 4 9 8 4 8 Z o . 4 0 4 8 1 6
4 0 . I O f\S SS O J . J J 6 ^ 6 0 i 0 9 7 0 1 .UZ / \J Ofx AO
Z D . 4 Z 1 0 4 4
j y . 4 4 1 0 9 7 7 I . u z / /
9 0 n 7 AS 11 4 J . J 1 1 0 9 8 4 .
1 . U Z 0 4 1 0 9 0 1
2 7 . 3 3 3 8 . 7 8 1 . 0 2 9 8
1 . 0 3 0 6
2 7 . 2 8 4 1 . 5 1 1 . 0 3 1 5
1 . 0 3 2 3
2 7 . 9 6 3 4 . 8 5 1 . 0 3 3 1
1 . 0 3 4 2
3 6 . 7 0 2 7 . 1 2 3 7 . 8 5 4 2 . 6 9 1 . 0 3 5 2
1 . 0 3 6 3 3 8 . 3 0 4 0 . 0 5 2 4 . 9 0 3 2 . 6 5 3 9 . 7 1 4 0 . 0 4 1 . 0 3 7 3 1 . 0 3 8 3 1 . 0 3 9 3
3 8 . 5 1 3 7 . 4 1 3 9 . 0 6 3 7 . 4 9 1 . 0 4 0 4
1 . 0 4 1 4
3 3 . 5 6 3 3 . 8 1 3 4 . 0 1 3 7 . 0 2 3 5 . 4 3 1 . 0 4 2 3
4 1 . 1 1 1 6 . 9 2 1 8 . 2 5 1 5 . 3 7 1 8 . 3 3 1 9 . 0 8 1 8 . 4 4 2 6 . 5 6 1 9 . 1 1 1 8 . 1 6 2 2 . 3 1 2 0 . 7 2 2 5 . 6 0 1 9 . 6 0 2 9 . 1 8 3 5 . 8 0 4 0 . 5 0 3 4 . 9 6 2 7 . 5 4
3 4 . 4 2 2 3 . 0 3 2 3 . 3 2 2 1 . 2 8
2 7 . 2 2 2 5 . 0 3 3 6 . 2 3
4 1 . 3 3 5 4 . 9 7 8 3 . 7 6 8 2 . 5 3 6 6 . 3 7 9 6 . 0 1 6 7 . 2 5 5 7 . 9 7 5 2 . 2 3 4 5 . 3 0 4 0 . 0 5 3 8 . 1 8 3 4 . 9 8 3 7 . 9 1 3 3 . 7 5 3 3 . 5 8 3 1 . 2 3 3 1 . 8 1 3 0 . 2 8 2 7 . 7 5
3 1 . 0 0
2 7 . 7 4
2 7 . 3 9
2 8 . 4 9
2 7 . 0 1
3 3 . 7 2 2 9 . 4 7


![Figure 6. Comparison between our standard calculation o f mean stratospheric 1 4 C 0 2 activities based on the H A S L observations (thin lines with open circles) and the results published b y Telegadas [1971] (thick lines with small solid circles)](https://thumb-eu.123doks.com/thumbv2/1library_info/5534008.1687754/7.918.91.826.80.568/comparison-standard-calculation-stratospheric-activities-observations-published-telegadas.webp)