Identification of natural degassing variations and combination of volcano monitoring techniques
DISSERTATION
ZUR ERLANGUNG DES DOKTORGRADES
AN DER MATHEMATISCH-NATURWISSENSCHAFTLICHEN FAKULTÄT DER CHRISTIAN-ALBRECHTS-UNIVERSITÄT ZU KIEL
VORGELEGT VON STEFAN BREDEMEYER KIEL,2016
Erste/r Gutachter/in: PD Dr. T.H Hansteen Zweite/r Gutachter/in: Prof. Dr. C. Devey Tag der mündlichen Prüfung: 20. Februar 2017 Zum Druck genehmigt: 20. Februar 2017
Hiermit erkläre ich, dass ich die vorliegende Doktorarbeit selbständig und ohne Zuhilfenahme unerlaubter Hilfsmittel erstellt habe. Weder diese noch eine ähnliche Arbeit wurde an einer anderen Hochschule im Rahmen eines Prüfungsverfahrens vorgelegt, veröffentlicht oder zur Veröffentlichung vorgelegt. Ferner versichere ich, dass die Arbeit unter Einhaltung der Regeln guter wissenschaftlicher Praxis der Deutschen Forschungsgemeinschaft entstanden ist.
Kiel, Dezember 2016
Stefan Bredemeyer
. . . consider the notion of periodicity. The general recurrences of things are very obvious in our ordinary experience. Days recur, lunar phases recur, the seasons of the year recur, rotating bodies recur to their old positions, beats of the heart recur, breathing recurs. On every side, we are met by recurrence. Apart from recurrence, knowledge would be impossible; for nothing could be referred to our past experience. Also, apart from some regularity of recurrence, measurement would be impossible. In our experience, as we gain the idea of exactness, recurrence is fundamental.
In the sixteenth and seventeenth centuries, the theory of periodicity took a fundamental place in science.
Kepler devined a law connecting the major axes of the planetary orbits with the periods in which.the planets respectively described their orbits: Galileo observed the periodic vibrations of pendulums: Newton explained sound as being due to the disturbance of air by the passage through it of periodic waves of condensation and rarefaction: . . . The birth of modern physics depended upon the application of the abstract idea of periodicity to a variety of concrete instances.
Alfred North Whitehead (1925)
P REFACE
This cumulative thesis is based on five manuscripts, which are complemented by an introduction to the overarching topic volcano monitoring, including a short overview of volcano surveillance methods used in the presented interdisciplinary studies (Chapter I). Four of the manuscripts have been published in peer- reviewed scientific journals (Chapters II-V), while the last one still is in preparation for submission (Chapter VI). Each of these Chapters thus contains its own abstract, introduction, description of the geological setting of the working area, presentation of results, discussion of the results, and conclusions.
The contributions of the authors, which were involved in the preparation of the manuscripts, are indicated below along with short summaries of the methods applied in Chapters II-VI. Details on the acquisition, evaluation and processing of the gas monitoring data recorded in the framework of this thesis are appended to this thesis (Appendix).
Chapter II Synchronous degassing patterns of the neighbouring volcanoes Llaima and Villarrica in south central Chile: the influence of tidal forces. ( published 2014 in the International Journal of Earth Sciences (Geologische Rundschau) )
Bredemeyer, S., T. H. Hansteen
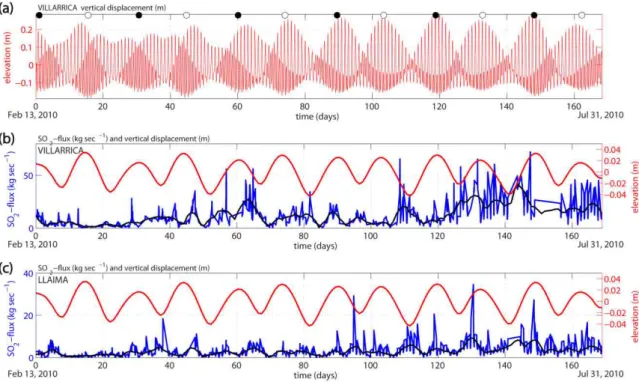
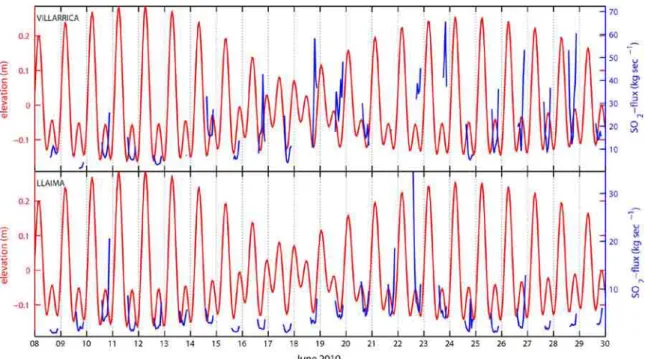
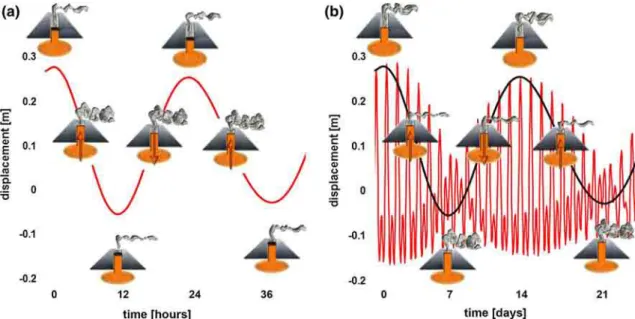
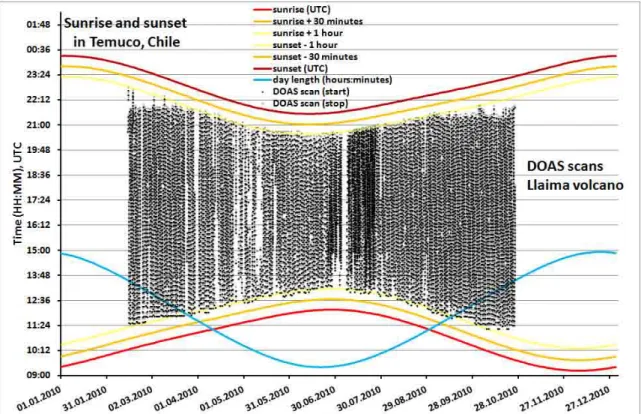
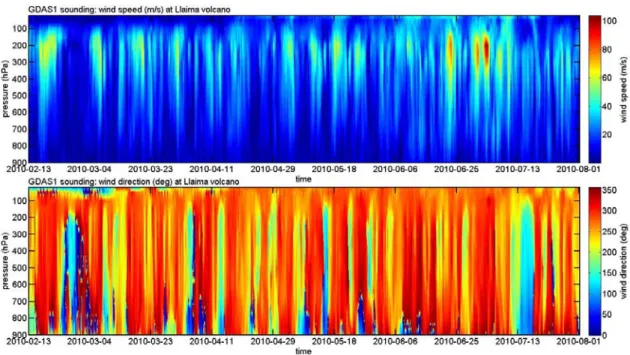
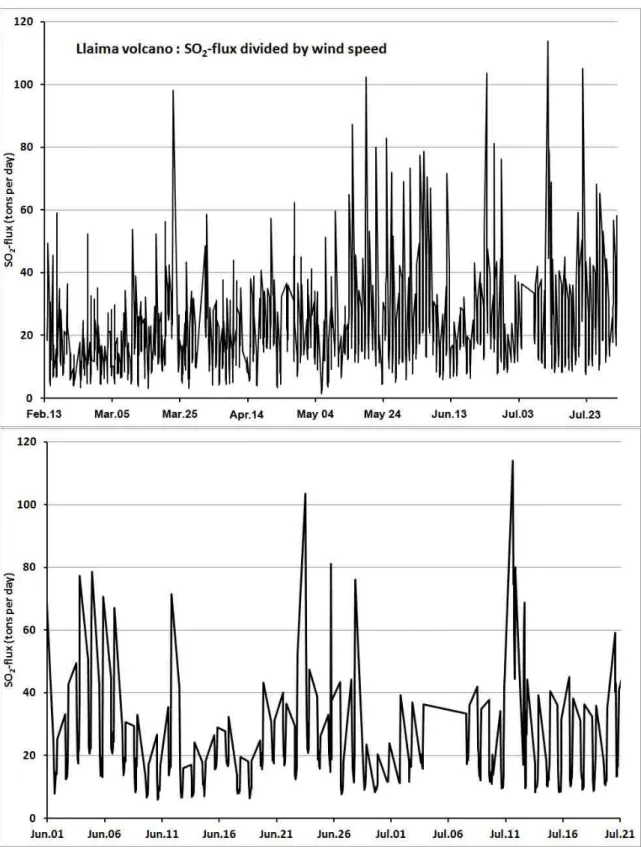
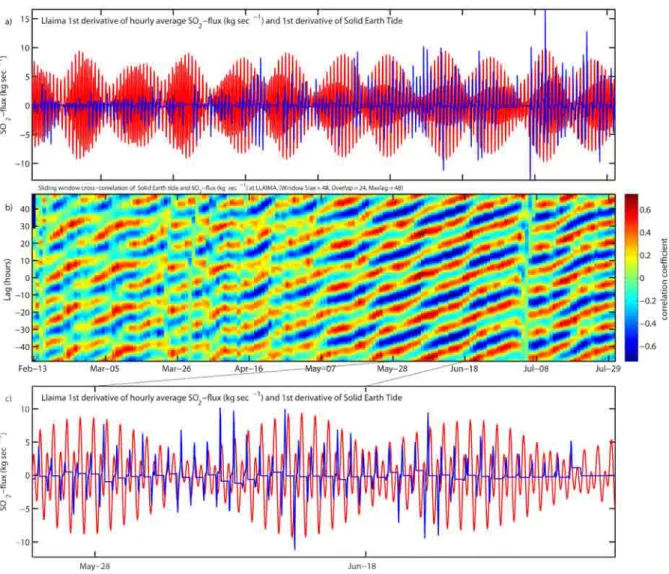
Chapter II examines periodically recurrent variations in the sulphur dioxide (SO2) degassing rates of Villarrica and Llaima volcanoes in south central Chile and aims at assigning the observed cyclical variations to their likely causes. Continuous long-term measurements of SO2 emission rates were conducted at Villarrica and Llaima by means of permanent stationary scan-DOAS (Differential Optical Absorption Spectroscopy) instruments and weather hindcasts of the Global Forecast System (GFS). The resulting time series were statistically examined in tandem with Earth tide related vertical ground surface displacements and compared to the local variations in barometric pressure. The analysis of the time series revealed diurnal, weekly, and fortnightly periodicities in degassing activity, which were attributed to changes in barometric pressure and tidal oscillations of Earth’s crust. These results were used to develop a conceptual magma degassing model, in order to explain the observed degassing variations.
Contributions: Stefan Bredemeyer and Thor H. Hansteen prepared the paper, which considerably benefited from discussions of the subject with Armin Freundt. Evaluation of SO2 emission rates and statistical analysis of the gas emission data in conjunction with corresponding weather and Earth tides data was conducted by Stefan Bredemeyer. Development of the conceptual magma degassing model was completed by Stefan Bredemeyer.
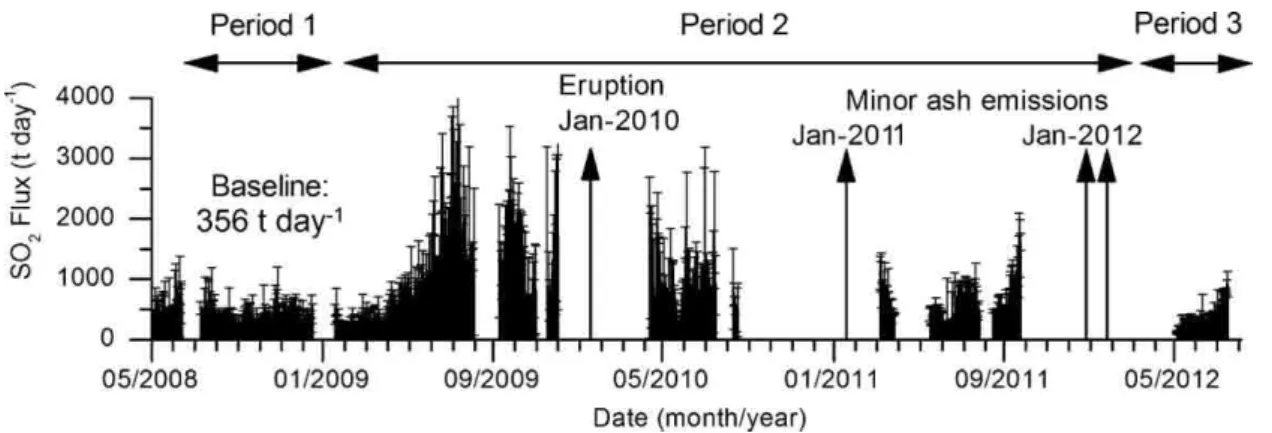
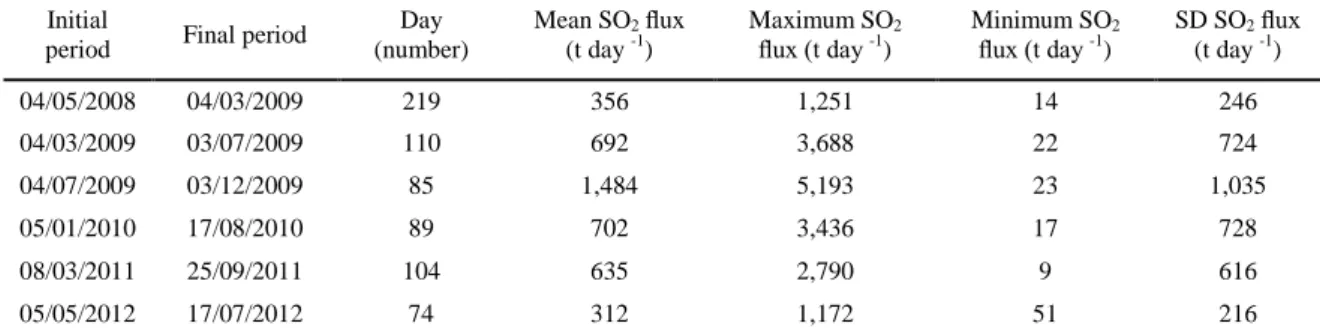
Chapter III SO2 degassing from Turrialba Volcano linked to seismic signatures during the period 2008–2012. ( published 2013 in the International Journal of Earth Sciences (Geologische Rundschau) ) Conde, V., S. Bredemeyer, E. Duarte, Javier F. Pacheco, Sebastian Miranda, Bo Galle, Thor H. Hansteen Chapter III is a rather classical volcano monitoring paper, in which the insights from monitoring data of different proxies for volcanic activity were combined with information from the eruption history and petrological data of Turrialba volcano in Costa Rica. SO2 emission rates from Turrialba were compared to seismicity time series in order to describe and interpret the temporal evolution of the activity during the first five years of a new period of volcanic unrest. The seismicity time series used in this study comprise Real- time Seismic Amplitude Measurements (RSAM), and simple event statistics of different volcanic earthquake types including the number of occurrences of long period (LP), very long period (VLP) and volcano tectonic (VT) earthquakes, as well as the duration of periods with volcanic tremor. Results from the combined statistical analysis of these time series and hypocenter distribution of hybrid earthquakes were used to infer the development of the volcanic activity and locate related processes in the magmatic system.
A magma supply rate was deduced from SO2-fluxes and sulphur contents in matrix glass and melt inclusions in phenocrysts of Turrialba tephras, measured by electron microprobe analysis.
Contributions: Vladimir Conde and Stefan Bredemeyer authored the paper and were supervised by Bo Galle and Thor H. Hansteen in the process of writing. Evaluation of the SO2-fluxes and statistical analysis of the gas emission data in conjunction with complementary seismic data was performed by Vladimir Conde. Eliecer Duarte, Javier F. Pacheco, and Sebastian Miranda provided the complementary seismic data and first-hand observations of the volcanic activity. Electron microprobe analysis was conducted by Heidi Wehrmann. Volcanological interpretation of the data was largely completed by Stefan Bredemeyer.
Chapter IV Linking SO2 emission rates and seismicity by continuous wavelet transform: implications for volcanic surveillance at San Cristóbal volcano, Nicaragua. ( published 2014 in the International Journal of Earth Sciences (Geologische Rundschau) )
Conde, V., S. Bredemeyer, J. A. Saballos, Bo Galle, T. H. Hansteen
Chapter IV explores the merits and limitations of Continuous and Cross Wavelet Transforms (CWT &
XWT) as tools for eruption prediction by means of combined analysis of different volcanic activity proxies, using the example of SO2 emission rates and Real-time Seismic Amplitude Measurements (RSAM) from San Cristóbal volcano in Nicaragua. Results from the individual CWT analyses and the combined XWT analysis of the time series were then used to infer the development of the volcanic activity and related magmatic processes at depth.
Contributions: Vladimir Conde wrote much of the manuscript and was assisted by Stefan Bredemeyer,·J.
Armando Saballos,·Bo Galle,·and Thor H. Hansteen. Vladimir Conde evaluated the SO2 emission rates and Armando Saballos provided the RSAM data. Vladimir Conde carried out the statistical analysis and was supported by Stefan Bredemeyer regarding the volcanological interpretation of the data.
Chapter V Gas emissions from five volcanoes in northern Chile and implications for the volatiles budget of the Central Volcanic Zone. ( published 2014 in Geophysical Research Letters )
Tamburello, G., T. H. Hansteen, S. Bredemeyer, A. Aiuppa, F. Tassi
Chapter V is a classical gas monitoring paper prospecting the gas compositions and SO2 emission rates from five volcanoes in Northern Chile (Láscar, Lastarria, Putana, Ollagüe, and San Pedro), which were used to calculate the total volatiles output of these volcanoes. These results were in turn used to estimate the along arc volatiles budget of the Central Volcanic Zone and compared to the gas chemistry and volatiles output of the Southern Volcanic Zone in Southern Chile.
Contributions: Giancarlo Tamburello authored the paper and was supported in the process of writing by the co-authors Thor H. Hansteen, Stefan Bredemeyer, Alessandro Aiuppa, and Franco Tassi. Giancarlo Tamburello performed gas composition measurements using Multi-GAS and filter packs at Láscar and Lastarria volcano, and conducted SO2-flux and wind speed measurements at Putana and Láscar volcanoes by means of a UV camera. Stefan Bredemeyer and Thor H. Hansteen conducted scan-DOAS surveys at Láscar, Lastarria, Putana, San Pedro, and Ollagüe volcanoes in order to measure SO2-fluxes. Evaluation of SO2-fluxes from all five volcanoes was completed by Stefan Bredemeyer. Franco Tassi provided gas composition data from a direct sampling survey at Ollagüe volcano. The volatiles budget of the Central Volcanic Zone was assessed by Giancarlo Tamburello.
Chapter VI Radar path delay effects in volcanic gas plumes: The case of Láscar volcano, Northern Chile. ( manuscript in preparation )
Bredemeyer, S., F.-G. Ulmer, T. H. Hansteen, E. De Zeeuw van Dalfsen, N. Richter, T. Walter
Chapter VI is a methodological manuscript, in which ground-based measurements of gas compositions and SO2 slant column densities in crosswind profiles of the volcanic gas plume of Láscar volcano were combined with satellite-based synthetic aperture radar (SAR) data in order to quantify the radar path delays
caused by volcanic water vapour emissions in interferometric displacement measurements. For this purpose a method was developed, which enables to map the areas of a volcano, in which the radar path was repeatedly delayed by enhanced water vapour contents in the volcanic gas plume during subsequent satellite radar observations. Water vapour contents in the volcanic gas plume and the background atmosphere were determined from a combination of scan-DOAS and multi-GAS measurements, and modeled weather hindcasts of the Global Forecast System (GFS), respectively. The gas plume related water vapour estimates were then used as an a priori information, which was integrated into the Cinderella algorithm, along with surface temperatures, barometric pressure, relative humidity, spatial and temporal baselines, in order to estimate the different SAR delay contributions in the examined time series of differential interferometric synthetic aperture radar (DInSAR) measurements.
Contributions: Stefan Bredemeyer wrote 90% of the manuscript together with Franz-Georg Ulmer, and was supported by valuable comments of the co-authors Thor H. Hansteen, Elske De Zeeuw van Dalfsen, Nicole Richter, and Thomas Walter. Thor.H Hansteen significantly improved the structure and organization of the manuscript. Stefan Bredemeyer & Franz-Georg Ulmer developed the analytical method. Evaluation and statistical analysis of the gas emission and weather data, as well as estimation of precipitable water vapour contents in the volcanic gas plume and the background atmosphere was performed by Stefan Bredemeyer. DInSAR analysis, WRF simulations, development of the Cinderella algorithm, and SAR delay estimation by means of the Cinderella algorithm was done by Franz-Georg Ulmer. Wind field analysis based on hindcasts of atmospheric soundings from the GFS and onsite observations was done by Stefan Bredemeyer, and complemented by a 3-dimensional wind field analysis obtained from the Weather Research and Forecasting Model (WRF), which was conducted by Franz-Georg Ulmer.
M ONITORING GAS EMISSIONS OF ACTIVE VOLCANOES
Identification of natural degassing variations and combination of volcano monitoring techniques
STEFAN BREDEMEYER
A BSTRACT
Degassing of magmatic volatiles is an important driving force of magma ascent inside Earth’s crust and thus plays a crucial role in the evolution of volcanic systems. Emission rates of magmatic gases are commonly used as a proxy for the magma supply rate of a volcano enabling to assess the amount of magma moving through the subsurface of a volcano during both, periods of quiescent and eruptive volcanic activity. Strong increases or decreases in gas emission rates and pronounced changes in the composition of gas emissions are often among the first precursory signs of an eruption and comparison of the gas emission rates with the volumes and volatile contents of erupted magma allows inferring the amount of endogenously degassing magma stored within the magma reservoir of a volcano. Endogenous magma degassing moreover is responsible for the generation of several deep-sourced precursory signals of possibly impending eruptions, which may manifest as enhanced seismic activity at depth, or surface deformation of the volcanic edifice. Determination of the time lag between the occurrence of such deep-seated precursory signals and observations of changes in fluxes of magmatic gas escaping at the surface of the volcano enables to deduce the depth and ascent velocity of the degassing magma. Continuous surveillance of gas emissions from active volcanoes thus provides valuable information about the state of volcanic activity, and can help to improve our understanding of the underlying magmatic processes and associated eruption dynamics.
This thesis is a contribution to the interdisciplinary field of applied volcanology and focuses on the study of volcanic gas emissions by means of ground-based spectroscopic remote sensing techniques. Furthermore it aims at fostering the routine use and integration of such measurements into existing multi-parameter volcano surveillance networks of the involved local volcano observatories. For this purpose continuous long-term monitoring of sulphur dioxide (SO2) emission rates was performed using permanent networks of fully-automated scanning ultraviolet (UV) spectrometers at some of the most active and persistently degassing stratovolcanoes in the volcanic arcs of Chile, Costa Rica and Nicaragua. These measurements yielded detailed time series of SO2 emission rates, which were calculated using differential optical absorption spectroscopy (DOAS) in conjunction with wind transport directions and velocities derived from weather hindcasts of the Global Forecast System (GFS), and delivered insights into the degassing behaviour of the monitored volcanoes.
Chapter II of this work investigates the periodic degassing behaviour of Villarrica and Llaima volcanoes in South-Central Chile and the influence of external forces on volcanic degassing. Statistical analysis of the hourly averaged degassing time series from Villarrica and Llaima volcanoes revealed systematic cyclic variations of SO2 emission rates at diurnal, weekly, fortnightly, monthly and annual time scales, which synchronously occur on both volcanoes, and which persisted regardless of the state of activity, i.e. they were retained during periods of quiescent and eruptive degassing. The synchronicity of the degassing variations observed at both volcanoes strongly suggests that external factors play a role in modulating the degassing efficiency of the volcanoes. Combined analysis of the SO2-fluxes from both volcanoes and corresponding time series from weather and Earth tide models enabled to attribute these degassing cycles to changes in barometric pressure and Earth tide induced pressure fluctuations.
Chapters III and IV address the difficulties related to the interpretation of gas emission data used as an indicator of upcoming volcanic unrest and explore the merits and limitations of different statistical methods for the individual and combined analysis of time series records of proxies for volcanic activity. Eruption
forecasting can significantly be improved by means of a combined analysis of SO2 emission rates with complementary volcano monitoring data, such as time series from event statistics of the occurrence of volcanic earthquakes, or Real-time Seismic Amplitude Measurements (RSAM). Our results show that SO2 emission data are often difficult to interpret without further knowledge of the activity state of the volcano, due to the ambiguity of decreasing emission rates, which may either indicate that the probability of an eruption is diminishing because the magma retreats and/or further magma supply is stalling, or the decrease indicates that the gas is being trapped and accumulating at depth, which potentially increases the threat of an imminent eruption. In order to obtain a more complete and clearer image of the processes occurring at depth, the SO2 emission data from Turrialba volcano in Costa Rica (Chapter III) and San Cristóbal volcano in Nicaragua (Chapter IV) were thus complemented with seismic data. Statistical analysis of the combined datasets enabled us to reconstruct the medium-term evolution of the volcanic activities encountered at both volcanoes, and revealed recurrent features in the measured signals, which may be used to identify eruptive activity. Cross Wavelet Transform (XWT) analysis was applied to daily averaged SO2 flux and Real-time Seismic Amplitude Measurement (RSAM) time series of San Cristóbal and proved to be a valuable tool to detect explosive events, since the wavelet coefficients of both parameters show a pronounced correlation during the periods with explosive activity, which were generally preceded by periods of several days to weeks in which the correlation considerably increased. In addition, a Fast Fourier Transform (FFT) analysis of the daily averaged SO2-flux, RSAM, and volcanic tremor duration time series from Turrialba yielded weekly and fortnightly cyclic variations as in the case of Villarrica and Llaima volcanoes, thus supporting the hypothesis of an external influence on degassing activity as proposed in Chapter II.
Chapter V focuses on gas composition and SO2-flux measurements from five volcanoes in Northern Chile (Lastarria, Láscar, Putana, San Pedro, Ollagüe), which were combined to calculate the degassing rates of different major components (H2O, CO2, H2, HCl, HF, and HBr) of the volcanic gases emitted from these volcanoes. These gas fluxes were used to assess the volatiles budget of the Chilean part of the Central Volcanic Zone (CVZ). Gas compositions from Láscar and Lastarria volcanoes are similar to those of the volcanoes from the Southern Volcanic Zone (SVZ) suggesting the presence of a uniform magmatic gas fingerprint throughout the Chilean arc.
Chapter VI presents a method, which enables the quantification of the water vapour related radar path delays in the volcanic gas plume of Láscar volcano in Northern Chile by means of integrating gas emission measurements and information from the Global Forecast System weather model into the analysis of radar interferometric measurements obtained from the synthetic aperture radar (InSAR) on the TerraSAR-X satellite. The method requires at least 3 radar acquisitions and approximately contemporary gas emission measurements, in order to map and quantify recurrent gas plume related radar path delays that influence interferometric displacement measurements, which in turn can be used for the improvement of ground deformation measurements at strongly degassing volcanoes.
K URZFASSUNG
Die Entgasung magmatischer Volatile ist die treibende Kraft für den Magmenaufstieg in der Erdkruste und spielt somit eine entscheidene Rolle in der Entwicklung vulkanischer Systeme. Emissionsraten magmatischer Gase werden für gewöhnlich als Anzeiger für die Magmenfördermenge eines Vulkans verwendet und ermöglichen somit sowohl in Zeiträumen ruhiger als auch eruptiver Vulkanaktivität die Abschätzung der Magmenmengen, die sich im Untergrund eines Vulkans bewegen. Eine starke Zu- oder Abnahme der Gasemissionsraten, sowie deutliche Veränderungen der chemischen Zusammensetzung der Gase gehören häufig zu den ersten Anzeichen eines bevorstehenden Vulkanausbruchs. Der Vergleich von Gasemissionsraten mit dem Volumen und Volatilengehalt von eruptiertem Magma erlaubt es Rückschlüsse auf die Menge der im Magmenreservoir eines Vulkans gespeicherten endogen entgasenden Magmen zu ziehen. Die endogene Entgasung von Magma ist darüber hinaus für die Erzeugung von verschiedenen Vorläufersignalen von möglicherweise bevorstehenden Vulkanausbrüchen verantwortlich, die ihren Ursprung in größerer Tiefe des Vulkans haben, und welche sich zum Beispiel in Form von erhöhter seismischer Aktivität oder der Deformation des Vulkangebäudes äußern. Die Ermittlung der Zeitabstände zwischen solchen tiefsitzenden Signalen und den Beobachtungen von Veränderungen der Flüsse von den an der Oberfläche des Vulkans entweichenden magmatischen Gasen ermöglicht die Herleitung der Tiefe und Aufstiegsgeschwindigkeit der entgasenden Magmen. Eine kontinuierliche Überwachung von vulkanischen Gasemissionen liefert daher wertvolle Informationen über den Aktivitätszustand eines Vulkans und kann somit dabei helfen unser Verständnis von den damit verbundenen magmatischen Prozessen und der Dynamik von Vulkanausbrüchen zu verbessern.
Diese Dissertation ist ein Beitrag zum weitläufigen interdisziplinären Feld der angewandten Vulkanologie und der Studie von vulkanischen Gasemissionen unter der Verwendung von bodengebundenen spektroskopischen Fernerkundungstechniken. Desweiteren zielt sie darauf ab, die routinierte Benutzung und die Integrierung solcher Messungen in die bereits existierenden Multi-Parameter Vulkanüberwachungsnetzwerke der involvierten Vulkanobservatorien zu fördern. Für diese Zwecke wurde an einigen der aktivsten und dauerhaft entgasenden Stratovulkane in Chile, Costa Rica und Nicaragua eine kontinuierliche Langzeitüberwachung von Schwefeldioxid (SO2) -Emissionsraten mittels permanent installierter Netzwerke aus voll-automatischen ultraviolett (UV) –Spektrometer Stationen mit eingebauter Abtastvorrichtung durchgeführt. Diese Messungen lieferten detaillierte Zeitreihen von SO2 – Emissionsraten, die mittels differentieller optischer Absorptionsspektroskopie (DOAS) in Verbindung mit Windrichtungen und Windgeschwindigkeiten aus Rückberechnungen des Global Forecast Systems (GFS) berechnet wurden, und gaben somit Einblicke in das Entgasungsverhalten der überwachten Vulkane und ermöglichten darüber hinaus die gemeinsame Analyse mit komplementären seismischen Überwachungsdaten.
Kapitel II dieser Arbeit untersucht das periodische Entgasungsverhalten der Vulkane Villarrica und Llaima im Mittleren Süden Chiles und den Einfluß externer Kräfte auf die Vulkanentgasung. Statistische Analysen der stündlich gemittelten Entgasungszeitreihen ergaben, dass die SO2-Emissionsraten der beiden untersuchten Vulkane zeitgleich auftretenden periodisch wiederkehrenden Schwankungen unterliegen, die sich auf unterschiedlichen Zeitskalen von Tagen, Wochen, Monaten und Jahren abspielen. Diese zyklischen Variationen bestehen unabhängig vom Zustand der vulkanischen Aktivität, sowohl in Zeiträumen ruhiger als auch eruptiver Entgasung und werden nur dann unterbrochen, wenn die Entgasung durch eine Blockierung der oberflächlichen Entgasungswege verhindert wird. Das an beiden Vulkanen zeitgleiche Auftreten dieser Entgasungsvariationen legt nahe, daß externe Faktoren die Vulkanentgasung beeinflußen.
Die kombinierte statistische Analyse von SO2 -Emissionsraten und zugehörigen Informationen aus Wetter- und Erdgezeitenmodellen ermöglichte es, diese Entgasungszyklen auf Veränderungen des Luftdrucks und auf durch Erdgezeiten induzierte Druckschwankungen zurückzuführen.
Die Kapitel III und IV befassen sich mit der Problematik der Interpretation von Gasemissionsdaten als Indikator für das Einsetzen und die Entwicklung vulkanischer Unruhephasen und untersuchen den Nutzen verschiedener statistischer Methoden für die Analyse von Proxy-Signalen bzw. indirekten Anzeigern für Vulkanaktivität. Die Vorhersage von Eruptionen anhand von Gasemissionsdaten kann deutlich verbessert werden, wenn sie in Kombination mit anderen geeigneten Vulkanüberwachungsdaten analysiert werden.
Unsere Ergebnisse zeigen, daß SO2-Emissionsdaten aufgrund der Mehrdeutigkeit, die eine Abnahme der Entgasungssraten mit sich bringt, häufig schwierig zu interpretieren sind, ohne weitere Kenntnis über den Aktivitätszustand des Vulkans zu haben. Eine Abnahme der Emissionsraten kann entweder darauf hindeuten, dass die Wahrscheinlichkeit eines Vulkanausbruchs abnimmt, weil das Magma sich zurückzieht und/oder die weitere Versorgung mit neuem Magma ins Stocken geraten ist, oder sie kann bedeuten, dass das Gas in der Tiefe zurückgehalten wird und sich dort ansammelt, was möglicherweise die Gefahr eines bevorstehenden Ausbruchs erhöht. Um ein vollständigeres und klareres Bild der in der Tiefe auftretenden Vorgänge zu erhalten, wurden die SO2-Emissionsdaten der Vulkane Turrialba in Costa Rica (Kapitel III) und San Cristóbal in Nicaragua (Kapitel IV) zusammen mit komplementären seismischen Daten ausgewertet. Die kombinierte statistische Analyse der Datensätze ermöglichte die Rekonstruktion der zeitlichen Entwicklung der Aktivität beider Vulkane, und offenbarte wiederkehrende Muster in den Messsignalen, welche dazu verwendet werden können das Einsetzen eruptiver Aktivität zu erkennen. Eine Cross-Wavelet-Transformations (XWT) Analyse wurde auf die täglich gemittelten SO2-Flüsse und die Echtzeit-Messung seismischer Amplituden (RSAM) von San Cristóbal angewandt und erwies sich als ein wertvolles Werkzeug, um das Einsetzen explosiver Vulkanaktivität zu detektieren, da die Waveletkoeffizienten der beiden Parameter an Tagen mit explosiver Aktivität eine ausgeprägte Korrelation gezeigt haben, denen im allgemeinen kurze Perioden von mehreren Tagen bis Wochen mit einer deutlichen Zunahme der Korrelation vorausgegangen sind. Darüber hinaus ergaben die Fourier-Analysen an den Zeitreihen von tagesdurchschnittlichen SO2 Flüssen, sowie von Echtzeitmessungen der seismischen Amplituden (RSAM) und von der Dauer des vulkanischen Tremors von Turrialba wöchentliche und zweiwöchige zyklische Schwankungen, wie im Fall von Villarrica und Llaima. Dieses Ergebnis unterstützt somit die in Kapitel II aufgestellte Hypothese, daß die Entgasungsaktivität von Vulkanen durch externe Kräfte beeinflusst wird.
Kapitel V legt das Hauptaugenmerk auf die Messung von Gaszusammensetzungen und SO2-Flüssen von fünf Vulkanen in Nord-Chile (Lastarria, Láscar, Putana, San Pedro, Ollagüe), die miteinander kombiniert wurden, um die Entgasungsraten der verschiedenen Hauptbestandteile (H2O, CO2, H2, HCl, HF, and HBr) der austretenden vulkanischen Gase zu bestimmen. Anhand dieser Gas-Flüsse wurde ein Volatilenbudget für den chilenischen Teil der Zentralen Vulkanzone Südamerikas erstellt. Die chemische Zusammensetzung der Gasemissionen von Láscar und Lastarria ist vergleichbar mit der Zusammensetzung von den Gasen der Vulkane in der Südlichen Vulkanzone, was auf die Anwesenheit eines durchgängig einheitlichen magmatischen Gas Fingerabdrucks im gesamten Chilenischen Vulkanbogen schliessen läßt.
Kapitel VI beschreibt eine Methode, in welcher Gasemissionsmessungen und Informationen aus dem Global Forecast System (GFS Wettermodell) mit den radar-interferometrischen Messungen von TerraSAR- X, einem satellitengestützten Radar mit synthetischer Apertur (InSAR) kombiniert werden, um die durch vulkanischen Wasserdampf hervorgerufenen Laufzeitverzögerungen von Radarechos in der vulkanischen Gasfahne vom Vulkan Láscar in Nord-Chile zu quantifizieren. Das Verfahren erfordert mindestens 3 Radar- Akquisitionen und annähernd zeitgleiche Gasemissionsmessungen, um die Laufzeitverzögerungen zu quantifizieren, die wiederum zur Verbesserung von Bodenverformungsmessungen an stark entgasenden Vulkanen verwendet werden können.
C ONTENTS
P
REFACE... V A
BSTRACT... VIII K
URZFASSUNG... X C
ONTENTS... XIII
C
HAPTERI ... 17
Introduction ... 19
1. The role of volatiles and magma degassing in volcanism... 19
2. The purpose of volcano surveillance ... 20
3. Volcano surveillance methods ... 20
3.1 Monitoring volcanic gas emissions ... 21
3.1.1 Direct gas sampling and in-situ measurements ... 21
3.1.2 Remote sensing of gas emissions ... 22
3.2 Monitoring volcano seismicity ... 24
3.3 Monitoring volcano deformation ... 26
References ... 26
C
HAPTERII ... 31
Synchronous degassing patterns of the neighbouring volcanoes Llaima and Villarrica in south-central Chile: the influence of tidal forces ... 33
Abstract ... 33
1. Introduction ... 33
2. Geological setting ... 34
3. Methods ... 35
4. Results ... 36
5. Discussion ... 38
5.1 Correlation between Earth tides and degassing ... 38
5.2 Long-term variations (weekly to monthly) ... 40
5.3 Short-term variations (intra-day) ... 41
5.4 Earth tides, atmospheric tides and volcanic degassing ... 42
5.5 The tidal pump ... 43
5.5.1 Degassing mechanisms ... 43
5.5.2 The diurnal and semidiurnal cycle ... 43
5.5.3 The fortnightly cycle ... 44
5.6 Seasonal variations in activity ... 45
5.7 Consequences for volcano monitoring ... 45
6. Conclusions ... 45
References ... 46
Supplementary Material ... 49
S1. Scan-DOAS acquisition strategy ... 49
S2. Statistical analysis of the wind field ... 49
References ... 52
C
HAPTERIII ... 53
SO
2degassing from Turrialba Volcano linked to seismic signatures during the period 2008–2012 ... 55
Abstract ... 55
1. Introduction ... 56
1.1 The general volcanic hazards of Turrialba ... 56
1.2 Turrialba’s period of unrest ... 56
2. SO2 flux measurements ... 57
2.1 Spectrum retrieval ... 57
2.2 Plume speed ... 58
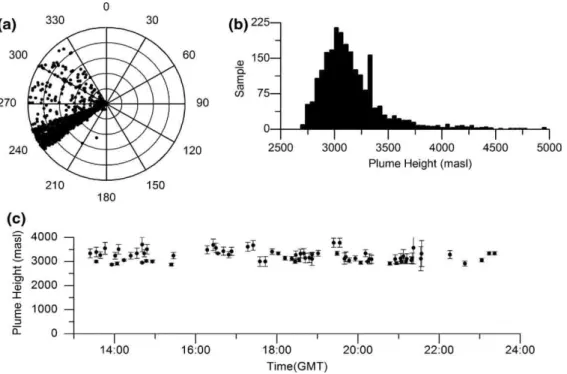
2.3 Plume direction and height ... 59
2.4 Error analysis ... 59
3. Seismic data ... 61
4. Results ... 61
4.1 Gradual increase in SO2 fluxes and persistent high-level degassing ... 62
4.2 High and variable degassing rates following the 2010 eruption ... 63
4.3 Gradual decrease in SO2 emissions to baseline values ... 63
4.4 Transient data analysis of SO2 fluxes and seismicity ... 65
5. Discussion ... 69
5.1 Constraints on the Turrialba magma plumbing system ... 69
5.2 Cyclic variations in degassing rates, periodic replenishment and seismic origin ... 70
5.3 Chronology of degassing and seismic events ... 70
5.4 Magma supply rate ... 71
6. Conclusions ... 72
References ... 72
Supplementary Material ... 75
C
HAPTERIV ... 77
Linking SO
2emission rates and seismicity by continuous wavelet transform: implications for volcanic surveillance at San Cristóbal volcano, Nicaragua ... 79
Abstract ... 79
1. Introduction ... 79
2. Background ... 80
3. Methodology ... 80
3.1 SO2 flux measurements ... 80
3.2 SO2 flux pre‑processing ... 82
3.3 Seismic data ... 83
3.4 Wavelet analysis ... 84
4. Results ... 85
4.1 Chronology of SO2 degassing and seismicity ... 85
4.2 XWT joint analysis ... 88
5. Discussion ... 88
5.1 Implications for volcanic surveillance ... 89
6. Conclusions ... 90
References ... 92
C
HAPTERV ... 95
Gas emissions from five volcanoes in northern Chile and implications for the volatiles budget of the Central Volcanic Zone ... 97
Abstract ... 97
1. Introduction ... 97
2. Volcanic Activity ... 99
3. Results ... 99
3.1 Láscar... 99
3.2 Lastarria ... 99
3.3 Putana, San Pedro, and Ollagüe ... 100
4. Discussion ... 100
4.1. Magmatic Gas End-Member Composition of Chilean Volcanism ... 100
4.2. Volatiles Output from the CVZ ... 102
5. Conclusions ... 103
References ... 104
Supplementary Material ... 107
S1. Sulphur dioxide emission rates ... 107
S1.1 Mini-DOAS data ... 107
S2. Chemical composition of volcanic gas emissions ... 108
S2.1 Multi-GAS data ... 108
S2.2 Filter pack data ... 108
S2.3 Direct gas sampling data ... 109
References ... 109
C
HAPTERVI ... 111
Radar path delay effects in volcanic gas plumes: The case of Láscar volcano, Northern Chile ... 113
Abstract ... 113
1. Introduction ... 114
2. Geological and atmospheric setting ... 115
3. Data and Methods ... 116
3.1 SO2 column density retrieval and estimation of PWV contents ... 116
3.2 SAR data and InSAR methods ... 117
3.3 Cinderella algorithm ... 119
3.4 Wind field during SAR acquisitions ... 120
4. Concept of data preparation ... 124
4.1 Identifying the effect of water vapour in a volcanic plume on SAR acquisitions ... 124
4.2 a1) Estimation of water vapour contents in the Láscar plume ... 125
4.2.1 Daily average PWV contents above the crater rim ... 125
4.2.2 Upscaling of crater rim PWV contents by potential evaporation rates ... 125
4.2.3 Daily average PWV contents downwind of the crater ... 126
4.3 a2) Estimation of background atmospheric PWV contents ... 128
4.4 b) DInSAR data preparation ... 129
4.5 c) Cinderella analysis ... 129
4.5.1 Determination of gas plume related phase delays ... 129
4.5.2 Compilation of the priors used for Cinderella analysis ... 131
5. Results and Discussion ... 132
5.1 SAR delay estimates ... 132
5.1.1 Gas plume related phase delays ... 133
5.1.2 The decomposed APS: Temperature, pressure and relative humidity related phase delays .. 134
5.1.3 DEM error related phase delays ... 135
5.1.4 Calibration curve for the correction of gas plume related delays and validation of the gas plume related estimate ... 135
5.1.5 Atmospheric phase delays ... 137
5.1.6 Relative effect of the gas plume related delays ... 137
5.2 d) Mitigation of non-deformation related delays from DInSARs ... 138
6. Conclusions ... 143
Appendix ... 144
A1. Estimation of PWV contents in the volcanic cloud ... 144
A2. Compensation of downwind evaporation ... 144
A3. Estimation of PWV contents in the atmosphere ... 146
References ... 146
A
PPENDIX... 151
Acquisition, evaluation and processing of scanning Mini-DOAS data ... 153
A1. Scan-DOAS equipment and software ... 153
A2. Installation of permanent scan-DOAS instruments for the purpose of long-term monitoring 154 A3. Determination of plume location, geometry and transport speed ... 154
A4. Archived weather data ... 156
A5. Pre-processing of GDAS1 sounding data ... 156
A6. SO2-flux calculation from scan-DOAS data ... 157
A7. SO2-flux time series processing ... 158
References ... 158
A
CKNOWLEDGEMENTS... 160
C
URRICULUMV
ITAE... 162
C HAPTER I
Introduction
Introduction
1. The role of volatiles and magma degassing in volcanism
The mantle is Earth’s largest volatile reservoir, which steadily supplies its crust, secondary atmosphere and Oceans with material by means of of volcanism and intrusion processes, which thus play a major role in the differentiation of our planet (Rubey, 1956). The major volatile components dissolved in the magma, which ascends through the crust prior to an eruption are in the order of their abundance: water (H2O), carbon dioxide (CO2), sulfur compounds (mainly SO2 and H2S), and halogen compounds (e.g. hydrogenated halogens such as HCl and HBr). These volatile components, though constituting only a minor fraction of a magma, provide the driving force of volcanism from the initiation of magma formation deep below Earth’s crust to the dynamics of their release in the form of multi-component gas mixtures at the Earth’s surface.
Most volcanic activity on Earth occurs at the divergent and convergent margins of tectonic plates and is intimately linked to the movement of these plates, but a considerable number of volcanoes also occurs within the plates, of which some are located above so-called hot-spots, which are zones of upwelling hot mantle material. Magma generation at Mid-Ocean Ridges, Continental Rifts and hot-spot volcanoes is caused by decompression melting of volatile-bearing hot mantle material, which ascends below a thin lithosphere in response to plate divergence and crustal extension, respectively due to buoyancy differences of mantle plumes to their surroundings (Langmuir & Foresyth, 2007; Thybo & Nielsen 2009; Smith, 2003;
Lee & Grand, 2012). Melt formation beneath volcanic arcs in contrast is related to the dehydration of the subducted oceanic plate during its descent into the hot asthenosphere (Harry & Green 1999). The influx of additional water and other volatiles dramatically lowers the melting temperature of the peridotitic mantle above the downgoing plate by 100s of degrees, and thus induces the generation of partial melts with basaltic composition (Peacock, 1996). Basaltic melts are typically less dense than the surrounding solid peridotitic mantle due to thermal and petrological differences, causing them to buoyantly ascend to the base of the overlying crust, which they intrude along crustal-scale faults.
As magma propagates through the crust towards the surface, the dissolved volatiles exert a strong influence on the ascent velocity, evolution, and eruption of magma (Wilson & Head III, 1981). Most of the basaltic magma intruding into the crust however never reaches Earth’s surface and solidifies in large plutonic bodies, or dyke intrusions which stagnate deep within the crust (Rubin, 1993; Huppert & Sparks;
1988; McNutt et al., 1975), or is being stored in magma chambers at shallower crustal levels beneath the volcanic edifice (Francis et al., 1993; Pinel & Jaupart, 2004). A large fraction of the gas emitted to the atmosphere is supplied by endogenous degassing of such non-erupted basaltic magma in the sub-volcanic storage system (Allard 1997).
The process of magma degassing is largely controlled by the different solubility of the major volatile constituents H2O, CO2, sulfur and halogen species, which strongly depend on the confining pressure and the chemical composition of the magma (Holloway & Jakobsson, 1986). Solubility of these volatiles generally decreases with decreasing magma pressure, and thus the magma gradually gets saturated in volatiles as it decompresses during its ascent, resulting in exsolution of a given volatile constituent and the formation of bubbles, when the melt becomes oversaturated in the respective volatile. CO2 is much less soluble in magma than most other volatiles and may already start to degas at crustal depths of several tens of kilometers, whereas sulfur species, H2O and halogens remain dissolved until the magma nears the surface in the upper part of the volcano’s conduit (e.g. Wallace, 2005). Nucleation of bubbles significantly decreases the bulk density of the degassing magma resulting in an increase of its buoyancy, which in turn increases the ascent velocity of the magma (Sparks, 1978). Magma degassing thus promotes magma convection, providing a self-sustaining mechanism that is required to keep a volcano in an active state and maintain its mass- and energy balance (Kazahaya et al., 2002). Bubbles grow in size during the ascent of the magma due to further decompression and diffusion of volatiles into the bubbles (Proussevitch & Sahagian, 1996). When the magma nears the surface, and as soon as the bubble density in the magma is large enough, bubbles accumulate and grow by coalescence with adjacent bubbles forming gas slugs, which in particular in low viscositiy magmas and at low magma ascent rates separate from the magma and rise faster than the
surrounding melt (Wilson, 1980). Magma ascent velocity significantly influences the bubble growth rate, which in turn controls whether the magma erupts effusively or explosively. Bubbles grow quickly at high decompression rates, i.e. when the magma rises rapidly leading to fragmentation of the magma and explosive eruption. At low magma ascent rates in contrast the bubbles grow much slower which results in effusive eruption of the magma.
2. The purpose of volcano surveillance
Eruption forecasting is one of the most important goals of volcanology, and is targeting to answer the critical questions when, where and how a volcano will erupt. Eruption predictions are generally based on insights obtained from statistical assessment of volcano monitoring data and from detailed studies of the eruption history of the volcano. Global historical eruption records and documentations of the accompanying changes in volcanic activity show that volcanic eruptions are almost always preceded by periods of anomalous volcanic unrest, which may last hours to months and which may follow a recognizable pattern, and thus enable to forecast eruptions, if the premonitory signs are perceived in time and interpreted correctly.
Volcano surveillance in general has the purpose to identify these precursory signs of possibly impending eruptions by means of observing changes in proxy indicators for volcanic activity, i.e. parameters, which enable to describe the activity state of a volcano and which can be used to derive mathematical models of volcano structure and eruption mechanisms. Increasing seismicity and gas emission rates, along with changes in gas and magma composition, surface temperatures and deformation of the volcanic edifice, are often the earliest detectable precursors of an imminent eruption. Continuous monitoring of these proxy indicators can help to detect the intrusion and ascent of magma in a volcano, and at best to find out whether and how much magma will reach Earth’s surface during a period of unrest, and thus provides powerful tools for eruption forecasting and hazard assessment.
3. Volcano surveillance methods
Various methods and technologies are used to monitor volcanic activity. Direct sampling methods and on- site observations are in principle very valuable for the purpose of identifying changes in volcanic activity, however they are generally often impracticable, since they require accessing the potentially hazardous crater areas of a volcano on a regular basis. Deployment of automated in-situ sensors and the application of remote sensing methods offer convenient alternatives to collect data of such dangerous and/or inaccessible areas from a safe distance, which is in particular crucial for the surveillance of remote volcanoes, where frequent on-site observations are in general not possible. Measurements obtained from remote sensing techniques are due to their remoteness however often influenced by dynamic changes in the medium between sensor and monitored object that the measurement signal has to propagate through, making it difficult to assign the observed changes in the remotely sensed signal to exclusively one cause that is exclusively related to the target. Most remote sensing applications thus demand elaborate corrections of path effects, in some cases involving the acquisition of additional independent parameters, which allow correction of the biased remotely sensed signal, in order to obtain the fraction of the signal that is related to changes in the monitored object, which in turn enables coherent interpretation of the data.
In Chapters III to VI of this thesis, the time series of remotely sensed SO2 emission rates from persistently degassing volcanoes were statistically examined and used in combination with the information obtained from several volcano monitoring techniques, comprising geochemical methods such as direct sampling of volcanic gases and in-situ measurements of gas compositions (Chapters V and VI), as well as seismic measurements (Chapters III and IV) and geodetic remote sensing methods (Chapter VI). The following section intends to give a “short overview” of the different volcano monitoring methods used in this thesis, which is in particular addressed to those who are not familiar with the topic volcano monitoring.
3.1 Monitoring volcanic gas emissions
Variations in composition and concentration of volatile mixtures discharged from magma have long been recognized as important indicators of magmatic processes occurring at depth (e.g. Daly, 1911). Gas emissions of nearly all volcanoes are dominated by magmatic water vapour (H2O), which in particular at arc volcanoes often accounts for more than 90% of the discharged gas (Fischer et al., 2008). Minor gas components comprise carbon dioxide (CO2) and sulphur compounds (mainly SO2 and H2S), which typically account for only a few % each, followed by even smaller amounts of hydrogen (H2), hydrogen halides (HCl, HF, HBr, HI), noble gases like helium and argon (Symonds et al., 1994; Oppenheimer et al., 2014), and a large variety of more complex organic compounds, such as hydrocarbons and halogenated hydrocarbons (Tassi et al., 2011; Frische et al., 2006).
Emission rates of magmatic gases are commonly used as a proxy for the magma supply rate of a volcano during periods of both, quiescent and eruptive volcanic activity and thus allow inferring the amount of endogenously degassing magma stored at depth within the magmatic plumbing system of a volcano by means of comparison with the volumes and volatile contents of erupted magma. Eruptions of persistently degassing volcanoes are very often preceded by anomalous changes in the amount and composition of gas emissions (Hirabayashi et al., 1982; Aiuppa, 2007). Endogenous magma degassing moreover is responsible for the generation of several precursory signals of an impending eruption, which may manifest as triggered seismic activity at depth (Chiodini et al., 2003; Pino et al., 2011), or surface deformation of the volcanic edifice due to the accumulation and release of gas from hydrothermal systems (Samsonov et al., 2014; Ruch et al., 2009). Determination of the time lag between such deep-seated precursory signals and observations of changes in fluxes and compositions of magmatic gas escaping at the surface of the volcano provides information about the depth and ascent velocity of the degassing magma (e.g. Burton et al., 2007).
Continuous monitoring of the abundance and fluxes of volatile components from volcanoes thus plays a key role in forecasting changes in volcanic activity and provide an insight into the dynamics and movement of degassing magma.
3.1.1 Direct gas sampling and in-situ measurements
The collection of volcanic gas samples at their various points of escape to the atmosphere, and subsequent analysis of these samples in the laboratory by elaborate dry and wet chemistry and gas chromatography methods, has long been the only means to measure chemical and isotopic compositions of volcanic gas emissions (e.g. Giggenbach, 1975; Sutton & Elias 2014). Analysis of the volcanic gas samples enables to determine both, major and trace gas components with high accuracy, and can yield a very detailed picture of the magmatic gas composition, provided that the collected gas was not contaminated prior to, or during the process of sampling (e.g. Gerlach & Casedevall, 1986; Symonds et al., 1992).
Gas samples obtained from fumaroles and bubbling hydrothermal springs however tend to be strongly altered by secondary processes, which occur as the magmatic gas rises through the fracture system in the subsurface of the volcano edifice (Nordlie, 1971). Such secondary processes involve the removal of magmatic gas by wall rock interactions, or the addition of gas from non-magmatic sources, such as mixing with atmospheric gases and mixing with H2O vapour boiled off from deep hydrothermal systems and shallow meteoric water, which leads to dilution, respectively contamination of the magmatic gas composition already before the gas mixture escapes to the atmosphere. Similarly the acidic magmatic gas components and in particular SO2 and hydrogen halides may be scrubbed from the upward percolating gas, when the gas has to permeate ground or surface water, in which they dissolve and thus get diluted, which may mask the intrusion of new magma especially during early stages of volcanic unrest (Symonds et al., 2001).
The degree of contamination of the magmatic gas by secondary processes prior to sampling strongly varies in time and depending on the location of the sampling site, respectively the distance from the degassing magma. Gas emissions from fumaroles thus merely represent very localized instantaneous snapshots of the gas compositions, which generally do not reflect the bulk gas composition emitted from the
volcano. Volcanic gas emissions obtained from domes and the immediate proximity of open magma surfaces are generally less affected by these secondary processes, and thus more likely yield gas samples representative of the primary composition of the magmatic gas, which is why volcanologists typically try to obtain their gas samples as close as possible to the degassing magma, and from fumaroles with the highest outlet temperatures (Tazieff, 1970; Le Guern et al., 1979). Direct sampling of volcanic gases thus often is extremely dangerous, especially during periods of enhanced volcanic activity, and not practicable due to the common inaccessibility of the crater areas of many volcanoes, which hinders maintaining a high frequency of sampling.
In order to yield more representative gas composition measurements than those obtained from fumaroles, several methods were developed during the past three decades, which enable to measure the concentration of selected gas components in the bulk volcanic gas plume. The filter-pack methodology was designed to collect ash, aerosols and acidic gases such as SO2, HCl, and HF from volcanic gas plumes by means of pumping ambient air through a series of base-impregnated filters, which are preceded by a particle filter in order to prevent particles such as ash and aerosols to contaminate the impregnated filters (Finnegan et al., 1989). In the laboratory, the absorbed volatiles and dust samples are leached out of the filters and analysed by instrumental neutron activation analysis (INAA) and/or ion chromatography (IC), yielding concentrations of the respective gas species. The recurrent sampling of gas and ash by means of filter-packs in the downwind portion of the volcanic plume thus enables to deduce magma degassing depths from gas composition variations based on the different solubility of the volatile species in magma (Aiuppa et al., 2004a). This method may be less dangerous in comparison to the on-site collection of fumarolic gases, provided that the morphology of the volcano edifice is truncated enough, that it allows staying at a safe distance and at the same time still capturing the gas plume.
Filter-packs are often used in combination with so-called multi-GAS instruments (multi-component Gas Analyzer Systems; e.g. Aiuppa et al., 2005; Shinohara, 2005), which allow conducting continuous measurements of the four most abundant gas constituents (H2O, CO2, SO2, H2S) in volcanic gas plumes at a high frequency. Multi-GAS instruments typically consist of a suite of electrochemical sensors specific to SO2 and H2S, and a non-dispersive infrared closed-path spectrometer for the detection of H2O and CO2 , which are supplied with ambient air by means of a pump. Such sensors are the only means to conduct geochemical in-situ measurements in real-time, and have widely been used as mobile units for the purpose of ground-based geochemical mapping of fumarolic fields (Aiuppa et al., 2005), or mapping of volcanic gas plumes by means of airborne traverses (Gerlach et al. 1998), or as fully automated telemetric gas monitoring stations, which were deployed immediately downwind of the emission source, in order to capture variations of the gas composition and temperature of the volcanic gas plume in the long term (Aiuppa et al., 2007).
3.1.2 Remote sensing of gas emissions
Gas emission rates from volcanoes typically are retrieved using optical spectroscopic methods, as these are the only means to capture the gas concentration in the whole extent of the volcanic gas plume, which is necessary to obtain the mass flux of the emitted gas. Spectroscopic remote sensing methods are generally based on multi-spectral measurements of light, which has transited through, and partially been absorbed by the volcanic gases contained in the volcanic gas plume. Due to their unique molecular structures, each of the gases in the plume absorbs light at characteristic wavelengths in the UV or IR regions of the electromagnetic spectrum, resulting in distinct broad and narrow band optical absorption structures, which are superimposed on each other in the measured light spectra, and thus reflect the composition of the light absorbing gas mixture. Analysis of the positions and amplitudes in particular of the narrow band absorption structures provides information on the presence and concentration of the gases contained in the optical path of the spectrometer.
Apart from being much safer than monitoring by direct sampling methods, gas emission monitoring by means of spectroscopic remote sensing techniques has the major advantage that these methods generally allow for automated acquisition of gas measurements and real-time data analysis, however they typically
only allow for the quantification of selected major gas components. Despite the abundance of H2O and CO2 in magmatic gas emissions, their quantification by means of remote sensing methods is exceedingly difficult, since they are also present in the ambient atmosphere in significant amounts (e.g. Francis &
Rothery, 2000). Remote measurements of magmatic volatiles have thus strongly focussed on SO2 , which in contrast to H2O and CO2 is readily detectable by ultraviolet and infrared spectroscopic methods, due to its strong absorption in distinctive narrow band wavelength ranges of the electromagnetic spectrum, and since its abundance in the volcanic gas plume is high compared to the negligible atmospheric concentrations (Fischer 2008). SO2 emission rates are generally obtained from spectroscopic measurements of crosswind gas concentration profiles through volcanic gas plumes in combination with transport velocities derived from weather data provided by wind models or weather stations. Combining such SO2 emission rate measurements with simultaneous in-situ plume gas composition measurements allows for the estimation of fluxes of other gas constituents, by means of multiplying the SO2 fluxes with molar mixing ratios determined from concentration measurements of other gas constituents in the volcanic gas plume (Edmonds et al., 2010).
The Ultraviolet Correlation Spectrometer (COSPEC), which has been introduced to volcanological community in the early 1970s (Stoiber & Jepsen, 1973), has long been the primary tool for remote measurements of SO2 emissions from volcanoes and was used for the first assessments of global volcanogenic volatile fluxes to the atmosphere (Andres & Kasgnoc, 1998; Halmer et al., 2002). COSPEC to date is still being used for SO2-flux monitoring on a number of volcanoes around the world, such as Soufrière Hills (Montserrat), Kilauea (Hawaii), Mijakejima volcano and Mount Asama in Japan (Young et al., 1998; Sutton et al., 2001; Kazahaya et al., 2004; Owahda et al., 2013), though nearly all of the measurements by means of COSPEC were performed rather sporadically and mainly covered periods of volcanic crisis, as they strongly relied on labour-intense field campaigns, since this bulky instrument is not suited for automated acquisition of data.
COSPEC has thus in many places been gradually been displaced by easily operated instruments based on robust lightweight miniature UV spectrometers, such as mini-DOAS (miniature DOAS; Galle et al., 2003), FLYSPEC (Horton et al., 2006), MAX-DOAS (Multi-Axis DOAS; Bobrowski et al., 2003), and scan- DOAS (Galle et al., 2010), which allow fully automated acquisition of data at a relatively high temporal rate of several minutes per measurement and are thus used on an increasing number of volcanoes to permanently monitor SO2 emission rates, enabling to effortlessly study long-term degassing variations including periods of quiescence (e.g. Nicholson et al., 2013). The UV spectrometers utilize linear CCD sensors combined with a diffraction grating, and thus provide one-dimensional hyperspectral measurements, which can in principle be used to simultaneously also quantify other light absorbing trace gases than SO2 , such as bromine monoxide (BrO; Bobrowski et al., 2003; Lübcke et al., 2013), or chlorine monoxide (ClO; Lee et al., 2005).
Spectroscopic imaging systems, such as IDOAS (Imaging DOAS; Bobrowski et al, 2006) and UV cameras (Mori & Burton, 2006) are the most recent advancements in the field of ground-based SO2
emission monitoring, which enabled two-dimensional visualization of gas dispersion and observation of short term variations in degassing behaviour at a high temporal resolution of down to 1 Hz (Oppenheimer et al., 2009; Boichu et al., 2010; Tamburello et al., 2013; Nadeau et al., 2015). Tracking of the gas plume in such highly resolved image sequences furthermore allows determination of accurate plume speeds, which in this work have been used to calculate SO2-fluxes from scan-DOAS measurements at Láscar volcano (Chapter V: Tamburello et al., 2014). Efforts have been made during the past decade to automate processing of the vast amounts of data which such cameras record within a short period of time, in order to provide the possibility to conduct continuous long term monitoring in real-time (Burton et al., 2015; Kern et al., 2015).
Satellite-based nadir looking UV and IR sensors allow to globally measure SO2 emissions from volcanoes on a regular basis (Flower et al., 2016), however at a rather low frequency depending on the revisit times of the satellites, and were used to map and track volcanic gas plumes, since the first detection of SO2 in the volcanic eruption cloud of El Chichón volcano by means of the Total Ozone Mapping Spectrometer on the Nimbus-7 satellite in 1982 (Krueger et al., 1983). While early space-based optical sensors were still restricted to monitoring eruption clouds and high altitude gas emissions from very strong
sources, technological advances in multispectral sensors onboard of satellites have recently lead to an improved spatial and spectral resolution, which significantly reduced the detection limits of SO2 , and thus offer the opportunity to monitor non-eruptive SO2 emissions from quiescently degassing volcanoes. The development of more sophisticated retrieval algorithms now enable to monitor the trajectories of SO2 and ash emissions from volcanoes, which is valuable in particular for aviation safety (Corradini et al., 2010).
Open-path Fourier transform infrared (OP-FTIR) spectroscopy has on several volcanoes successfully been applied to the study of the chemical composition of gas emissions (Notsu et al., 1993; Mori & Notsu, 1997; Oppenheimer et al., 1998) and gas emission rates of selected gas species (Duffell et al., 2001). OP- FTIR measurements can be performed at a high frequency and permit to simultaneously sense multiple gas species including H2O, CO2, CO, OCS, SO2, HCl, HF and SiF4 . Reliable retrievals of H2O and CO2 concentrations are however not straight forward to obtain and require very short path lengths, i.e. the instrument has to be deployed relatively close to the emission source in order to avoid interference with the background atmosphere (e.g. Burton et al., 2000; La Spina et al., 2013).
3.2 Monitoring volcano seismicity
The investigation of volcano related seismic signals is arguably the most common and reliable volcano monitoring method used by volcano observatories worldwide, which probably can be attributed to the long history of volcano seismology and the benefits related to the experiences gained through over a century of scientific observations. Pioneering work was conducted by Fusakichi Omori, who examined the seismic signals related to the 1910 eruptions of Usu-san and Asama-yama volcanoes in Japan, and found that volcanic eruptions typically are preceded and accompanied by earthquakes and ground vibrations, which he related to magma movement and fracturing of the surrounding bedrocks (Omori, 1911; Omori, 1912).
Volcanic activity produces a variety of seismic signals, which have specific waveform characteristics that can be used to infer the associated processes occurring at depth and the surface of the volcanic edifice.
The occurrence of volcano related seismicity heralding an eruption often tends to be very localized and to cluster in the regions of magma emplacement, resulting in so-called earthquake swarms. Sufficiently dense networks of seismometer sensors deployed on volcanoes allow for the determination of hypocenters of single events, which in turn enables to locate and track magma movement and associated deep-seated changes in activity.
Classification of seismic signals from volcanoes is commonly based on the dominant frequency content and shape of the waveform in particular in the region of the onset of individual signals (e.g. Lahr et al., 1994). Four main types of volcano related seismic signals are generally distinguished: Volcano-tectonic (VT) earthquakes, long-period (LP) earthquakes, volcanic tremor, and explosion earthquakes.
The occurrence of volcano-tectonic earthquake swarms is often one of the first signs of magma intrusion at depth. Volcano-tectonic earthquakes are high-frequency events, which typically contain prevalent frequencies in the range of 2-50 Hz, and are thought to originate from shear fracture of solidified magma and/or surrounding bedrocks associated to dike propagation and the emplacement of fresh magma (Roman
& Cashman, 2006). The waveforms of volcano-tectonic events are characterized by clearly distinguishable impulsive onsets of pressure- and shear-wave arrivals, and thus contain information on the orientation of the local stresses exerted during rupture. Such volcano-tectonic events are thus very similar to and cannot be distinguished from general shallow tectonic earthquakes.
Low-frequency seismicity occurring at volcanoes is commonly interpreted as a sign for magma movement and degassing processes, and comprises long-period events, continuous volcanic tremor, and very long-period events. Long-period events typically resemble small tectonic earthquakes in duration, but their waveforms show no shear-wave arrivals and are characterized by a very emergent onset of a low frequency waveform, which is commonly restricted to the frequency range between 1 and 5 Hz. The source regions of long-period events are generally located in the upper part of the volcanic conduit, and their occurrence is commonly interpreted as a resonant response of fluid-filled cracks or conduit walls to short- term pressure perturbations caused by fluid or gas flow, or magma movement (Chouet, 1996).
Volcanic tremor is a continuous seismic low frequency signal, which typically occurs at persistently degassing volcanoes during phases of vigorous degassing, and accompanies virtually all volcanic eruptions (McNutt & Nishimura, 2008). The spectral characteristics of volcanic tremor are very similar to those of long-period events, though they are generally denoted by much narrower frequency ranges and may significantly differ in duration of the waveform, which can last for minutes to days with sustained amplitude following the emergent onset of the pressure-wave. Duration and amplitude of such signals are good indicators for the activity state of a volcano, their occurrence, however, superimposes on and thus hinders the detection and identification of the above described signals.
Volcanic explosions often produce very long period (VLP) signals, which are characterized by waveforms with periods ranging from 3 to 100s of seconds. The very long period signals are followed within few seconds by short-period signals characterized by frequency contents above 1 Hz, which accompany the eruption of pyroclastics (Nishimura, 1995; Chouet et al., 1997). Very long period events generally originate from small shallow seated source regions in the upper part of the volcanic conduit, and were ascribed to gas bubble bursting during strombolian explosions (Chouet et al., 2003) and degassing bursts from obstructed volcanic vents (Chouet et al., 2005).
Yet another earthquake type frequently occurring on volcanoes is the hybrid earthquake. Hybrid events share the characteristics of volcano-tectonic and long-period events, and have high frequency onsets followed by low-frequency oscillations, suggesting the contemporary occurrence of volcano-tectonic and long-period seismicity related processes. Hybrid events are accordingly commonly ascribed to brittle failure of solidified magma and the wall rocks of the magma plumbing system, in combination with resonance of the fluid-filled conduit, due to magma movement (e.g. Tuffen et al., 2003), but may also be related to low rupture velocities combined with strong path effects as a result from a shallow source location (e.g.
Harrington & Brodsky, 2007).
This list of the above described volcano related seismic signals is, however, by far not exhaustive, even if it would be supplemented by all the signals resulting from processes occurring on the surface of the volcano edifice. Such superficial seismic signals comprise continuous signals resembling tremor, which are related to landslides, lahars, rockfalls and pyroclastic flows, and short-duration events related to icequakes, which are an important feature on glaciated volcanoes.
The physical meaning of the different seismic signals, in particular of the low-frequency events and their relation to magma movement is, however, not yet well understood, and explanation of source mechanisms, in particular of those signals related to deep-seated processes is still subject of the recent research (McNutt, 2005). The physical processes underlying the generation of seismic signals, which manifest at the surface of the volcanic edifice are in contrast a bit better constrained, as these processes typically can be observed and measured by other monitoring methods, e.g. by means of recordings from infrasonic pressure sensors, which in many places are used to complement seismic networks (e.g. Johnson et al., 2004). The attribution of these superficially occurring signals to their likely causes often merely demands visual observation of the event, respectively observations of the changes related to the event by comparison of the conditions encountered before and after the event.
The requirement to evaluate a large abundance and variety of volcano related seismic signals, in order to identify precursory signs of an impending eruption, calls for automatic detection and classification of seismic events. Automated identification of the different classes of events in continuous seismic records by means of pattern recognition is however very challenging, since signals of each seismic event appear to be different at different stations and event classes may partially overlap in certain waveform characteristics used for classification (Curilem et al., 2009; Curilem et al., 2016). In addition, various individual signals may temporarily overlap especially during periods of enhanced volcanic activity, or in the aftermath of large intraplate earthquakes, when the frequent occurrence of aftershocks obscures the volcanic events (Mora et al., 2012). Moreover, the spectral and wave field features used for the classification of events tend to change during eruptions, due to migration of source locations of the individual events (Cannata et al., 2009), hampering the automated discrimination of the different volcano seismic events.
For early warning purposes, the development of volcanic activity often can already sufficiently well be deduced from time series based on simple seismic event statistics, such as counts of the number of different event type occurrences per hour or day, changes in the duration of tremor signals, or even better by