Investigation on the production of secondary metabolites from anoxygenic phototrophic bacteria.
Dissertation
Zur Erlangung des Doktorgrades
der Mathematisch-Naturwissenschaftlichen Fakultät der Christian-Albrechts-Universität zu Kiel
Vorgelegt von Min Sun
Kiel 2015
Korreferentin: Prof. Dr. Ute Hen t schel-Humeida Tag der mündlichen Prüfung: 19.02.2016
Zum Druck genehmigt: Ja
gez. Prof. Dr. Johannes F. Imhoff
This present work was carried out at the GEOMAR Helmholtz Centre for Ocean Research Kiel Christian-Albrechts-University of Kiel from August 2011 to August 2015 under the
supervision of Prof. Dr. Johannes F. Imhoff.
Scientific contribution
All the strains used in this studied were offered by Prof. Dr. Johannes F. Imhoff. Allochromatium vinosum strain MT86 was isolated and identified by Dr. Marcus Tank. All bioassays of crude extracts, fractions and pure compounds were done by Arlette Wenzel-Storjohann (Marine Natural Products, GEOMAR). NMR measurement was performed at the Otto-Diels Institute of Organic Chemistry (Christian-Albrechts University of Kiel) and NMR data analysis was analysis by the assistance of Dr.
Bin Wu (Zhejiang University, China) and Prof. Dr. Alex Zeeck (BioViotica Naturstoffe GmbH, Götingen). Prof. Dr. Alex Zeeck did the TLC and IR, CD, and polarimetry measurements.
All other experiments were done by Min Sun under supervision of Prof. Dr. Johannes F. Imhoff at GEOMAR Marine Microbiology Department.
Erklärung
Hiermit erkläre ich, dass ich die vorliegende Arbeit unter Einhaltung der Regeln guter wissenschaftlicher Praxis der Deutschen Forschungsgesellschaft verfasst habe, und dass sie nach Form und Inhalt meine eigene Arbeit ist. Außer den angegebenen Quellen und Hilfsmitteln wurden keine weiteren verwendet. Sie wurde keiner anderen Stelle im Rahmen eines Prüfungsverfahrens vorgelegt.
Dies ist mein erstes und bisher einziges Promotionsverfahren.
Min Sun
Kiel, den 15. 12. 2015
Table of contents
1 INTRODUCTION
... 11.1 Natural products ... 1
1.1.1 Definition ... 1
1.1.2 Category ... 1
1.2 Marine natural products ... 5
1.3 Methods of natural products screening ... 11
1.3.1 Polyketides ... 11
1.3.2 Nonribosomal peptides ... 14
1.3.3 Phenanzines ... 16
1.3.4 Terpenes ... 17
1.3.5 Updating tools for exploration of diversities of natural compounds ... 18
1.4 Anoxygenic phototrophic bacteria ... 19
1.4.1 Purple bacteria ... 19
1.4.2 Green bacteria ... 20
1.4.3 Heliobacteriaceae ... 21
1.4.4 Aerobic anoxygenic phototrophic bacteria (AAPBs) ... 21
1.5 Aims of this study... 21
2 MATERIALS AND METHODS
... 242.1 Preparation of the medium ... 24
2.2 Bacterial strains ... 28
2.3 Cultivation experiments ... 30
2.3.1 Optimization of the growth condition for the cultivation of A. vinosum MT86 ... 30
2.3.2 Media for screening of optimal cultivation condition ... 31
2.3.3 Scale up to a 36 L culture volume of A. vinosum strain MT86 ... 31
2.3.4 Salt tolerance of A. vinosum strain MT86 ... 32
2.4 Chemical screening and structure identification ... 33
2.4.1 Extraction procedures ... 33
2.4.2 Analytical HPLC-DAD/MS ... 35
2.4.3 Fractionation of crude supernatant extract by semi-preparative HPLC ... 36
2.4.4 Screening of crude cell extract (TLC)... 38
2.4.5 Antimicrobial activities screening ... 38
2.4.6 NMR analysis ... 40
2.4.7 TOF-MS ... 40
2.5 Other strains of phototrophic bacteria ... 41
2.5.1 First screening of selected strains ... 41
2.5.2 Scale up of cultivation of Rubrivivax gelatinosus strain 151 and fractionation the crude extract by semi-preparative HPLC ... 41
2.6 Genetic screening ... 42
2.6.1 DNA extraction ... 42
2.6.2 PCR and sequencing ... 42
2.6.3 Gel electrophoresis... 45
2.6.4 Purification ... 45
2.6.5 BLASTn analyses ... 45
2.7 Genome evaluation of phototrophic bacteria from databases ... 45
3 RESULTS
... 523.1 First screening of A. vinosum strain MT86 ... 52
3.1.1 Metabolite profiles of A. vinosum MT86 ... 52
3.1.2 Fractionation of supernatant extracts by semi-preparative HPLC ... 54
3.1.3 NMR analysis of the fractions from the 20 L supernatant extract ... 54
3.1.4 Bioactivity of crude supernatant and cell extracts from the 20 L culture ... 55
3.2 Optimization of the growth conditions and culture of 36 L of A. vinosum strain MT86. ... 56
3.2.1 Media for screening of optimal cultivation conditions ... 56
3.2.2 Scale up to a 36 L volume culture of A. vinosum MT86... 61
3.3 Salt tolerance of A. vinosum MT86 ... 64
3.3.1 Comparison of culture broths with 0%, 0.33%, 0.67%, 1%, and 1.67% salts ... 64
3.3.2 Comparison of culture broths with 2.33%, 2.5%, 2.67%, and 3.33 % salts... 68
3.3.3 Bioactivity tests of crude extracts from controls Pf media and from cultures grown at different salt concentrations. ... 72
3.3.4 Scale up of cultures to a 50 L volume at two salt concentrations ... 73
3.3.5 NMR analysis of compound F13 from 0.67% salts concentration ... 80
3.3.6 Bioactivity tests of fractions from cultures grown at 0.67% salts... 85
3.3.7 Screening of crude cell extract for compound F13 by TLC... 87
3.4 Properties of compound F13 from A. vinosum. MT86 ... 87
3.5 Metabolite profiles of other phototrophic bacteria ... 89
3.5.1 First screening of strains 120/1, 182, and 151 ... 89
3.5.2 Screening of culture broth in a 100 ml volume ... 91
3.5.3 Scale up of cultures of Rubrivivax gelatinosus strain 151 to a 20 L volume ... 97
3.6 Genetic screening of selected anoxygenic phototrophic bacteria ... 100
3.6.1 DNA extraction of these bacteria ... 100
3.6.2 PCR amplifications and sequences analyses ... 100
3.7 Genome evaluation of phototrophic bacteria from databases ... 123
4 DISCUSSION
... 1334.1 Metabolite profiles of A. vinosum strain MT86 ... 133
4.2 Metabolite profiles of other anoxygenic phototrophic bacteria ... 134
4.3 Classification and identification of strains ... 135
4.4 PCR amplification of strains and sequences BLASTn analysis ... 135
4.5 Genome evaluation of phototrophic bacteria from database ... 136
5 SUMMARY
... 1386 ZUSAMMENFASSUNG
... 1407 REFERENCES
... 1428 APPENDIX
... 1539 ACKNOWLEDGEMENTS
... 160List of Figures
Figure 1-1. Structure of bacitracin. ... 2
Figure 1-2. Structure of erythromycin. ... 3
Figure 1-3. Structure of penicillin. ... 3
Figure 1-4. Structure of penicillin G. ... 4
Figure 1-5. The history of the golden age of antibiotics. ... 4
Figure 1-6. The structure of streptomycin. ... 5
Figure 1-7. Conventional modular type I PKS paradigm. ... 13
Figure 1-8. Basic steps during polyketide synthesis... 13
Figure 1-9. Basic steps during nonribosomal peptide synthesis. ... 15
Figure 1-10. The structure of phenazine. ... 16
Figure 1-11. The structure of isoprene. ... 17
Figure 1-12. The structure of isopentenyl pyrophosphate. ... 18
Figure 1-13. The structure of dimethyl allyl pyrophosphate. ... 18
Figure 2-1. The apparatus for preparation of Pfenning medium. ... 25
Figure 2-2. The apparatus for preparation of AT medium. ... 25
Figure 2-3. The flowchart of A. vinosum strain MT86. ... 30
Figure 3-1. Cultures and microscopic observation of A. vinosum strain MT86. ... 52
Figure 3-2. HPLC chromatograms of three extractions of A. vinosum MT86. ... 53
Figure 3-3. The color of extracts from culture supernatant and cell extracts of A. vinosum MT86. ... 53
Figure 3-4. The semi-preparative HPLC chromatogram of crude supernatant extract of 2nd & 3rd combined 20 L culture. ... 54
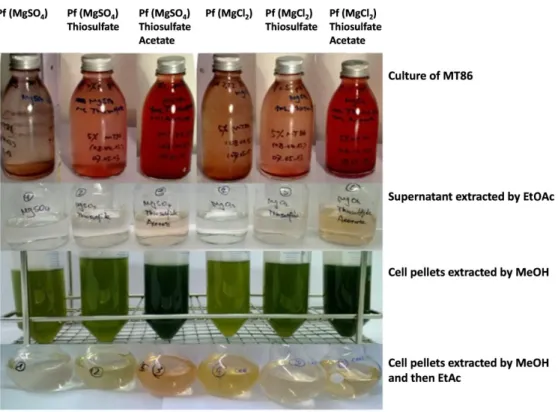
Figure 3-5. Photos of cultures and extracts of A. vinosum MT86 in different media. ... 57
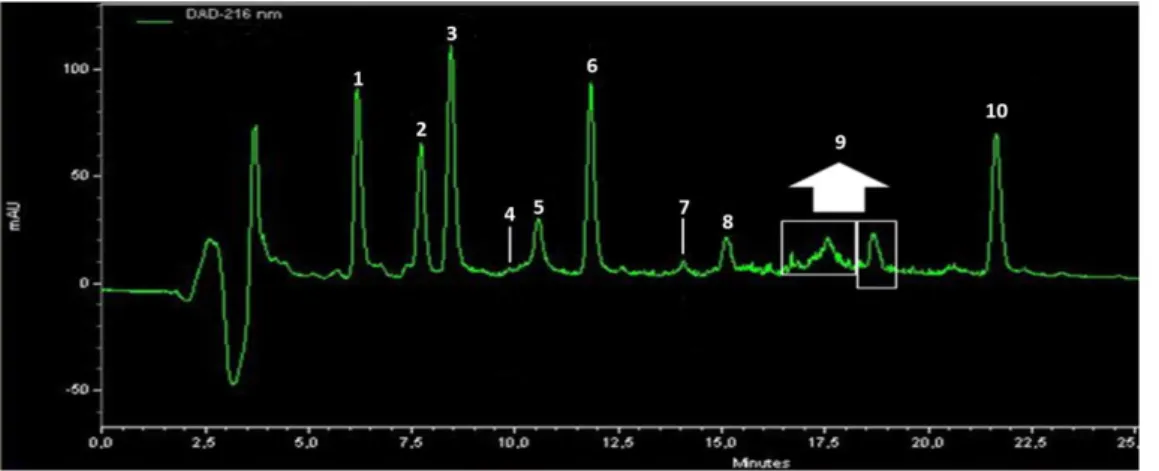
Figure 3-6. HPLC chromatograms of six different supernatant extracts. ... 59
Figure 3-7. HPLC chromatograms of six different cell extracts. ... 59
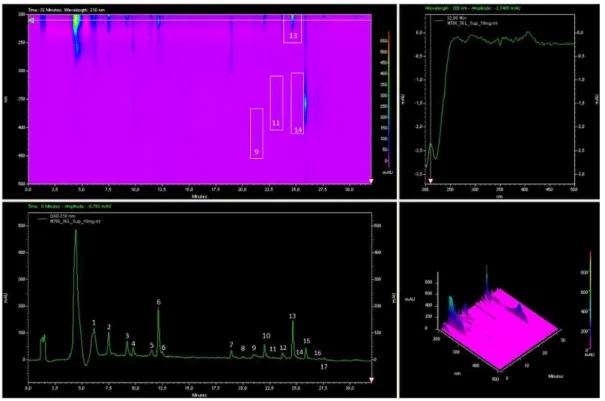
Figure 3-8. Semi-preparative HPLC chromatogram of supernatant extract of 36 L culture broth of A. vinosum strain MT86. ... 62
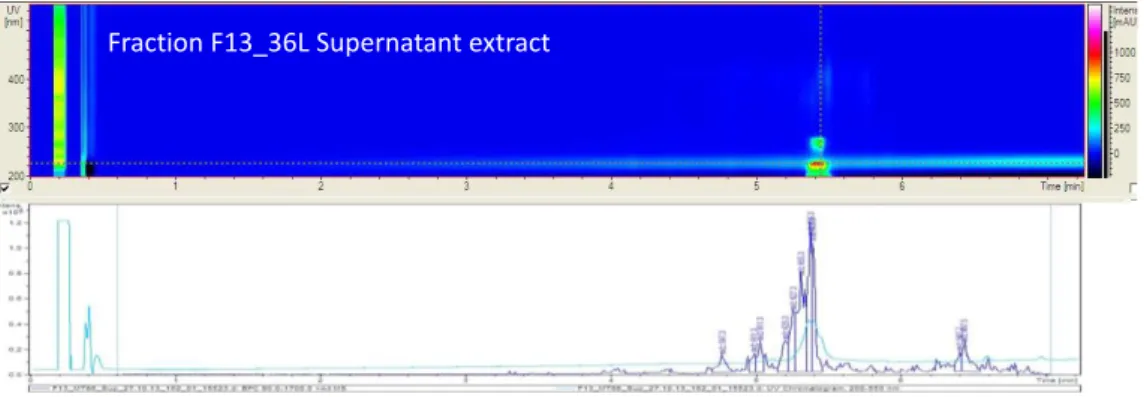
Figure 3-9. HPLC-DAD/MS chromatogram of fraction F13 isolated from A. vinosum MT86. ... 63
Figure 3-10. Cultivation of MT86 in of different salt concentrations after 5 days. ... 64
Figure 3-11. Comparison of chromatograms of extracts from A. vinosum strain MT86 grown at salt concentrations from 0-1.67% salts for 7 days. ... 65
Figure 3-12. Comparison of chromatograms of extracts from A. vinosum strain MT86 grown at salt concentrations from 0-1.67% salts for 10 days. ... 65
Figure 3-13. Comparison of extracts from A. vinosum MT86 grown at 1% salts for 7 and 10 days. ... 67
Figure 3-14. Comparison of extracts from cultures of A. vinosum MT86 grown at 2% and 3% salts. ... 68
Figure 3-15. Comparison of extracts from cultures of A. vinosum MT86 grown at salt concentrations of 2.33%, 2.5%, 2.67%, and 3.33 % for 15 days. ... 69
Figure 3-16. Comparison of extracts from cultures of A. vinosum MT86 grown at salt concentrations of 2.33%, 2.5%, 2.67%, and 3.33 % for 20 days. ... 69
Figure 3-17. Comparison of extracts from cultures of A. vinosum MT86 grown at 2.5% salts for 15 and 20 days. ... 71
Figure 3-18. HPLC chromatogram of supernatant extract from45 L culture of A. vinosum MT86 grown at 0.67% salts for 10 days. ... 73
Figure 3-19. Semi-preparative HPLC chromatogram of supernatant extract from 45 L culture of A. vinosum strain MT86 grown at 0.67% salts. ... 74
Figure 3-20. HPLC chromatogram of compound F13 isolated from 45 L culture grown at 0.67% salts. ... 74
Figure 3-21. Mass spectrum of compound F13 isolated from culture extract grown at 0.67% salts with (a) positive method and (b) negative method. ... 76
Figure 3-22. HPLC chromatogram of extracts from 50 L supernatant culture broth of A. vinosum strain MT86 grown at 2.5% salts for 15 days. ... 77
Figure 3-23. Semi-preparative HPLC (C18 column) chromatogram of supernatant extract from 50 L culture of A. vinosum MT86 at 2.5% salts for 15 days. ... 77
Figure 3-24. Semi-preparative HPLC (polar column) chromatogram of supernatant extract from 50 L culture of A.
vinosum MT86 at 2.5 salts for 15 days……….77
Figure 3-25. Structure of compound F13 repurified from combined fractions of F13, P13 and C13. ... 80
Figure 3-26. 1H NMR chromatogram of compound F13. ... 82
Figure 3-27. 13C NMR and DEPT chromatogram of compound F13. ... 82
Figure 3-28. 1H-1H COSY chromatograms of compound F13. ... 83
Figure 3-29. 1H-13C HMBC chromatogram of compound F13. ... 83
Figure 3-30. 1H-13C HSQC chromatogram of compound F13. ... 84
Figure 3-31. NOESY chromatogram of compound F13. ... 84
Figure 3-32. The TLC chromatograms of compound F13 and cell extracts. ... 87
Figure 3-33. IR spectrum of compound F13 from A. vinosum MT86. ... 88
Figure 3-34. The CD spectrum of compound F13. ... 88
Figure 3-35. HPLC-DAD/MS results of strains 120/1, 182 and 151. ... 90
Figure 3-36. HPLC chromatograms of extracts from 100 ml supernatant culture broth of Rhodopseudo-monas palustris strain 120/1 grwon for 7 and 10 days. ... 91
Figure 3-37. HPLC chromatogram of extracts from 100 ml supernatant culture broth of Rhodobacter capsulatus strain 182 grown for 7 and 10 days ... 93
Figure 3-38. HPLC chromatogram of extracts from supernatant cultures of Rubrivivax gelatinosus strain 151 grown for 7 and 10 days. ... 95
Figure 3-39. HPLC chromatogram of the 20 L supernatant extract of Rubrivivax gelatinosus strain 151 grown for 10 days ... 97
Figure 3-40. Semi-preparative HPLC chromatogram of extract of supernatant (20 L) of strain 151. ... 98
Figure 3-41. HPLC-DAD/MS chromatograms of 21 fractions from strain 151. ... 99
Figure 3-42. DNA extraction of ten representative strains. ... 100
Figure 3-43. 16S rRNA of ten strains. ... 101
Figure 3-44. Gel electrophoresis of pks I amplified fragments. ... 102
Figure 3-45. Gel electrophoresis of pks I amplified from nine strains and identification of purified bands. ... 102
Figure 3-46. Gel electrophoresis of PCR products amplified with primers 945f and 945r supposed to amplify pks II from nine strains and numbers of purified bands ... 105
Figure 3-47. Gel electrophoresis of PCR products from amplification with primers designed for nrps gene fragments and identification by numbers of the bands purified ... 110
Figure 3-48. Gel electrophoresis of PCR products from amplification with primers designed for phzE gene fragments and identification by numbers of the bands purified ... 115
Figure 3-49. The numbers of gene clusters obtained from online antiSMASH tool. ... 127
Figure 3-50. Pie chart of the distrubition of biosynthesis gene clusters of anoxygenic phototrophic bacteria. .... 128
Figure 4-1. A PhzE pathway for Pseudomonas aeruginosa PAO1. ... 136
List of Tables
Table 1-1. Some marine natural products isolated from microorganisms. ... 9Table 2-1. Strains’ information. ... 29
Table 2-2. Changed parameters of Pf media. ... 31
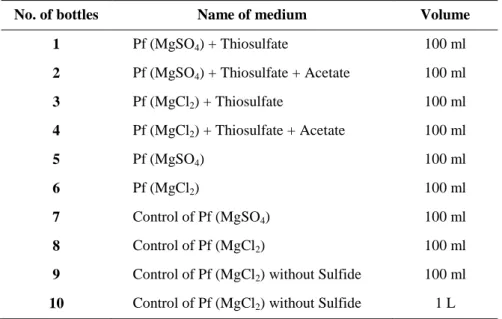
Table 2-3. The protocol of incubation of A. vinosum strain MT86 in different Pf media and control media. ... 31
Table 2-4. Growth parameters for cultivation at different salt concentrations. ... 32
Table 2-5. Growth parameters for 50 L cultivation at different salt concentrations. ... 33
Table 2-6. The solvent gradients for analytical HPLC using a flow of 2 ml/min... 36
Table 2-7. The gradient used for semi-preparative HPLC ... 37
Table 2-8. Modified gradient used for semi-preparative HPLC ... 37
Table 2-9. Microbial strains and enzymes used for the bioactivity assay. ... 39
Table 2-10. Media and solutions used for bioactivity tests. ... 40
Table 2-11. Growth conditions of strains 120/1, 151, and 182. ... 41
Table 2-12. Primers used in this study. ... 43
Table 2-13. PCR system of 16S rRNA and program. ... 44
Table 2-14. PCR system of pks I and program. ... 44
Table 2-15. PCR system of pks II and program. ... 44
Table 2-16. PCR system of nrps and program. ... 44
Table 2-17. PCR system of phzE and program. ... 44
Table 2-18. Overview of 62 genera belonging to anerobic ... 46
Table 2-19. Summarized overview of the strains which genome sequences were available. ... 49
Table 3-1. The amounts of extracts of A. vinosum MT86. ... 53
Table 3-2. NMR experiments of four fractions isolated from 20 L supernatant extract of A. vinosum MT86. ... 55
Table 3-3. The results of bioassay tests of controls, supernatant and cell extracts*. ... 55
Table 3-4. The bioactivity tests of 10 fractions from the 2nd and 3rd supernatant extracts. ... 56
Table 3-5. Extraction of A. vinosum MT86 in 6 different modifications and 4 controls of Pf media. ... 58
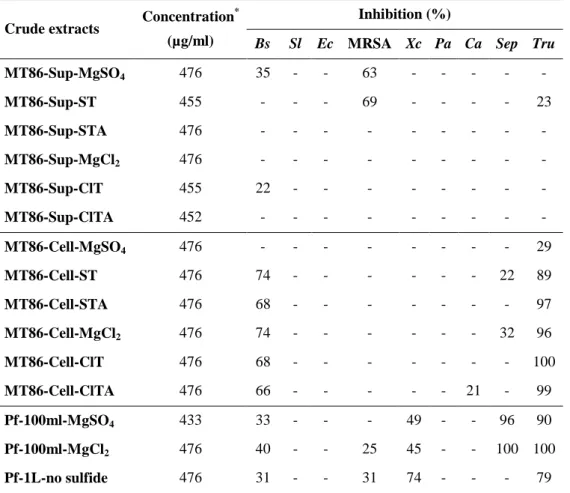
Table 3-6. Bioassay tests with extracts of A. vinosum MT86 grown in 100 ml flasks in 6 different media. ... 60
Table 3-7. Basic Pf medium for A. vinosum strain MT86. ... 61
Table 3-8. The amount of extract from a 36 L culture of A. vinosum strain MT86. ... 61
Table 3-9. NMR analysis of compounds from 36 L supernatant extract. ... 63
Table 3-10. The cultivation parameters for extraction of compound P10/F13. ... 63
Table 3-11. UV and m/z information of each peak of extracts from cultures grown for 7 and 10 days... 66
Table 3-12. UVmax and m/z information of peaks of extracts from cultures of A. vinosum MT86 grown for 15 and 20 days. ... 70
Table 3-13. Inhibition of test strains by different extracts of A. vinosum strain MT86. ... 72
Table 3-14. Incubation parameters for scale up experiments. ... 73
Table 3-15. Detailed information on fractions of extract from 45 L culture broths of A. vinosum MT86 grown at 0.67% salts. ... 75
Table 3-16. Comparison of fractions from different cultures of A. vinosum strain MT86. ... 79
Table 3-17. 1H NMR (600 MHz, MeOD), 1H-1H COSY and 1H-13C HMBC correlation for compound F13. ... 81
Table 3-18. 13C NMR (150 MHz, MeOD) spectroscopic data for F13. ... 81
Table 3-19. Bioactivities of fractions from A. vinosum strain MT86. ... 86
Table 3-20. The results of peak picking from the IR spectrum of compound F13. ... 88
Table 3-21. Summary of structural features of F13... 89
Table 3-22. Bioassay results of extract from Rhodopseudomonas palustris 120/1, Rhodobacter capsulatus 182, and Rubrivivax gelatinosus 151. ... 90
Table 3-23. Comparison of extracts from cultures of strain 120/1 grown for 7 and 10 days. ... 92
Table 3-24. Comparison of extracts from cultures of strain 182 grown for 7 and 10 days. ... 94
Table 3-25. Comparison of extracts from cultures of strain 151 grown for 7 and 10 days. ... 96
Table 3-26. 16S rRNA analysis of selected anoxygenic phototrophic bacteria. ... 101
Table 3-27. PCR amplification, sequencing results, and BLASTn results of pks I. ... 103
Table 3-28. PCR amplification, sequencing results, and BLASTn results of pks II. ... 106
Table 3-29. PCR amplification, sequencing results, and BLASTn results of nrps. ... 111
Table 3-30. PCR amplification, sequencing results, and BLASTn results of phzE. ... 116
Table 3-31. Summary of gene screening of representative phototrophic bacteria. ... 121
Table 3-32. AntiSMASH results of the whole genome sequences of the strains from database related to the 10 strains in this study. ... 125
Table 3-33. Summary of the secondary metabolite clusters and the most similar compounds. ... 129
Table 4-1. Comparison of F13 produced in different cultivation. ... 134
Table 8-1. AntiSMSAH results of whole genome sequences of 62 anoxygenic phototrophic bacteria. ... 153
Abbreviations
% percent
°C degree Celsius
µl micro liter
µm micro meter
[α]D25 specific rotatory power; sodium D-line (589 nm); 25 °C
aa amino acid
A adenylation
AAPB aerobic anoxygenic phototrophic bacteria
Abb. abbreviation
AchE acetylcholinesterase
Acc.-No accession number
ACN acetonitrile
ACP acyl carrier protein
ADC antibody drug conjugate
antiSMASH Antibiotics & Secondary Metabolite Analysis SHell APB anoxygenic phototrophic bacteria
AT acyl transferase
ATP adenosine triphosphate
Bs Bacillus subtillis
Bchl bacteriochlorophyll
BLASTn Nucleotide Basic Local Alignment Search Tool
bp base pairs
Ca Candida albicans
ca. circa
CaCl2 calcium chloride
calcd. calculated
CD circular dichroism
CO2 carbon dioxide
CoA coenzyme A
COSY correlation spectroscopy
CYC cyclase
d common difference
d doublet
DAD diode-array-detector
dd doublet of doublets
ddd doublet of doublet of doublets ddH2O double-distilled Water ddt doublet of doublet of triplets demin. water demineralized water
DEPT distortionless enhancement by polarization transfer
DH dehydratase
DMSO dimethyl sulfoxide
DNA desoxyribonucleic acid
DNPs Dictionary of Natural Products
DSMZ Deutsche Sammlung von Microorganismen und Zellkulturen, German collection of microorganisms and cell cultures
dt doublet of triplets
Ec Escherichia coli
e. g. exampli gratia (Latin), for example EDTA ethylene diamine tetraacetate EDTA-Na2 ethylene diamine tetraacetate-Na2 EGFR epidermal growth factor receptor
ENPP3 ectonucleotide pyrophosphatase/phosphodiesterase family member 3
ER enoyl reductase
ESI electrospray ionisation
ESIMS electrospray ionization mass spectrometry
ETBR endothelin B receptor
EtOAc ethyl acetate
EtOH ethanol
FDA Food and Drug Administration
GCC guanylyl cyclase C
GNSB green nonsulfur bacteria
GPNMB glycoprotein nonmetastatic B
GSB green sulfur bacteria
GSK-3β glykogensynthase-kinase 3
HMBC heteronuclear multiple bond correlation HPLC high performance liquid chromatography HPLC-DAD/MS HPLC-diode array detection-mass spectrometry HRESI-MS high resolution electron spray ionization mass spectra HSQC heteronuclear single quantum cohenrence
Hz Hertz
IC50 half maximal inhibitory concentration
IR infrared spectroscopy
J spin-spin coupling constant
JGI DOE Joint Genome Institute
JNK c-Jun N-terminal protein kinases
KR ketoreductase
KS ketosynthase
LIV-1 zinc transporter SLC39A6
m meter
m multiplet
max maxima
MeOD methanol with D element
MeOH methanol
mg milligram
MHz megahertz
Milli-Q water deionized water was purified by Milli-Q system
mM mill molar
MMAE monomethyl auristatin E
MMAF monomethyl auristatin F
MNPs marine natural products
MRSA methicillin-resistant Staphylococcus aureus
MS mass spectrometry
MW molecular weight
NA not available
NaPi2b sodium-dependent phosphate transport protein 2b NCBI National Center for Biotechnology Information NITE National Institute of Technology and Evaluation
nm nano meter
NMR nuclear magnetic resonance
NOESY nuclear overhouser enhancement spectroscopy
NPs natural products
NRPS nonribosomal peptide synthetase
nt nucleotide
OD600 optical density at 600 nm
PBS phosphate buffered saline
PCR polymerase chain reaction Pf medium Pfennig’s medium
PKS polyketide synthase
PNSB purple nonsulfur bacteria
ppm parts per million
PSB purple sulfur bacteria
PSMA prostate-specific membrane antigen
PTFE polytetrafluoroethylene
RAC1 Ras-related C3 botulinum toxin substrate 1 RDP-II the Ribosomal Database Project II
RP reversed phase
rpm rotation per minute
Rt retention time
sh shoulder
Sl Staphylococcus lentus
SCUBA self-contained underwater breathing apparatus SLITRK6 SLIT and NTRK-like protein 6
sp. species
STEAP1 anti-six transmembrane epithelial antigen of the prostate 1
T temperature
td triplet of doublets
TE thioesterase
TBE Tris-Borat-EDTA
TLC thin layer chromatograph
TSB tryptic soy broth
UV ultraviolet
V volt
Xc Xanthomonas campestris
δ NMR chemical shift [ppm]
Chemicals used in this study
Formula/name IUPA name Company
(CH3COO)2Mg·4H2O Magnesium acetate tetrahydrate; Mg-acetate Merck
C2H3NaO2 Sodium acetate; Na-acetate Roth
C3H3NaO3 Pyruvic acid sodium salt; Na-pyruvate Roth
C63H88O14N14PCo Vitamin B12 Merck
C6H7NaO6 Na-ascorbate L(+)-ascorbic acid sodium salt Fluka
CaCl2·2H2O Calcium chloride dihydrate Merck
CH3CH2OH Ethanol 99 % Walter CMP
CH3CN Acetonitril (HPLC gradient grade) VWR Prolabo
CH3COOCH2CH3 Ethyl acetate Roth
CH3COONH4 Ammonium acetate Roth
CoCl2·6H2O Cobalt(II) chloride hexahydrate Merck
CuCl2·2H2O Copper(II) chloride dihydrate Merck
EDTA/C10H16N2O8 Ethylene diamine tetraacetate Merck
EDTA-Na2 Ethylene diamine tetraacetate-Na2 Roth
FeCl2·4H2O Iron(II) chloride tetrahydrate Sigma
FeSO4·7H2O Iron(II) sulfate heptahydrate, ferrous sulfate Sigma
H3BO3 Trihydroxidoboron, Boric acid Roth
KCl Potassium chloride Merck
KH2PO4 Potassium dihydrogen phosphate Merck
Methanol/ CH3OH HPLC gradient grade Roth
Methanol-d4/ CD3OD 99.8 Atom % D Roth
MgCl2·6H2O Magnesium chloride hexahydrate Roth
MgSO4·7H2O Magnesium sulfate heptahydrate Merck
MnCl2·7H2O Manganese(II) chloride heptahydrate Merck
Na2MoO4·2H2O Sodium molybdate Merck
Na2S·9H2O Sodium sulfide nonahydrate Sigma
Na2S2O3·5H2O Sodium thiosulfate pentahydrate Merck
Na2SO4 Sodium sulfate anhydrous Roth
NaCl Sodium chloride Roth
NaHCO3 Sodium bicarbonate Sigma-Aldrich
NH4C2H3O2 Ammonium acetate, NH4-Acetate Roth
NH4Cl Ammonium chloride Merck
NiCl2·6H2O Nickel(II) chloride Sigma
Tris/C4H11NO3 2-Amino-2-hydroxymethyl-propane-1,3-diol Roth
ZnCl2 Zinc chloride Merck
1 INTRODUCTION
1.1 Natural products 1.1.1 Definition
Natural products are a huge and diverse group of chemical compounds produced by living creatures from nature (Porter, 1913) (http://www.thefreedictionary.com/natural+product). They can be extracted from plants and animals, from cells or tissues, from microorganisms (bacteria, fungi) or their excreted metabolites (Strobel and Daisy, 2003) and may have notable biological activity for using as phamaceuticals.
Natural products include flavonoids, alkaloids (quinine, ephedrine, chelerythrine etc.), polysaccharides, volatiles oils, quinonoids, terpenoids, waxes, coumarins, saponins, cardiac glycosides from plants, but also monosaccharides, oligosaccharides, polysaccharides, phenylpropanoids, amino acids (L-glutamic acid, L-lysine), antibiotics (streptomycin), pigments (cytochrome C), polypeptides, vitamins, organic acids, phenols, lactones, steroids, tannins, and other naturally occurring chemicals from microorganisms and their fermentation broths. About 50% of the drugs introduced into the market in the last 20 years were traced back to natural products or derivatives thereof. Several reviews and reports have discussed this significant role of natural products in drug discovery (Newman et al., 2000;
Newman et al., 2003; Chin et al., 2006; Koehn and Carter, 2005; Paterson and Anderson, 2005).
1.1.2 Category
In the field of organic chemistry, natural products can be defined into primary metabolites and secondary metabolites. Primary metabolites are deemed essential to the survival of organism in maintaining basic metabolic pathways that are required for life. They are associated with significant cellular functions such as nutrient assimilation, energy production, and growth/development and propagation. Primary metabolites include carbohydrates, lipids, amino acids (Kliebenstein, 2004;
Karlovsky, 2008), and nucleic acids which are typically produced during the active growth phase.
Many primary metabolites and fermentation products are used in industrial microbiology for large- scale fermentation production like beer and wine, amino acids including L-glutamate and L-lysine, citric acid that are used in mass marketing production as ingredients in food production and pharmaceutical and cosmetic industries.
Secondary metabolites have an extrinsic function that in particular affects other organisms. Secondary metabolites are organic compounds in many cases formed at the end of stationary phase of growth. In contrast to primary metabolites, secondary metabolites are small molecules that are dispensable and not required for sustaining life. However, they increase the competitiveness of the producer within its environment with the ability of biochemical and signal transduction pathways modulations. Secondary
metabolites have a broad range of functions. These include pheromones (act as social signalling molecules), communication molecules, and competitive biological weapons (repellents, venoms, toxins etc.).
A restrictive definition limiting natural products to secondary metabolites is commonly used within the fields of medicinal chemistry and pharmacognosy. These metabolites can be used in industrial microbiology to obtain amino acids, develop vaccines and antibiotics, and isolate chemicals necessary for organic synthesis. General structural classes of secondary metabolites include alkaloids, phenylpropanoids, polyketides, and terpenoids. Examples of important secondary metabolites are antibiotics such as the antibiotic bacitracin (Figure 1-1), which is synthesized in nature by a nonribosomal peptide synthetase and the antimicrobial erythromycin (Figure 1-2), which derived from Saccharopolyspora erythraea.
Figure 1-1. Structure of bacitracin.
Figure 1-2. Structure of erythromycin.
Until the early 20th century, treatments of infections were based primarily on traditional folklore medicine. Such mixtures with antimicrobial properties that were used in treatments of infections were described over 2000 years ago. In the ancient Egyptian and ancient Greek cultures (Lindblad, 2008), specially selected molds and plant materials and their extracts were used to treat infections (Wainwright, 1989; Shah, 2011; Forrest, 1982).
In 1928, Alexander Fleming, a Scottish microbiologist, identified a compound derived from the fungus Penicillium chrysogenum and demonstrated its antibacterial activity (Newman et al., 2000). He named the compound penicillin. Later in 1942, Howard Florey and Ernst Boris Chain succeeded in purifying the first antibiotic of the penicillin class, penicillin G (Figure 1-3 and Figure 1-4). Penicillin displayed potent antibacterial activity against a wide range of bacteria and had low toxicity in humans. Further, Dorothy Crowfoot Hodgkin determined the chemical structure in 1945. For the successful development of penicillin, as a therapeutic drug in clinic application, Ernst Chain and Howard Florey and Alexander Fleming shared the 1945 Nobel Prize in Medicine.
Figure 1-3. Structure of penicillin.
Figure 1-4. Structure of penicillin G.
Another example of a successful antibiotic drug is streptomycin which is derived from Actinomyces griseus (later changed the name to Streptomyces griseus in 1943) isolated by Selman Waksman’s group from soil and water samples (Schatz et al., 1944). It is an important antibiotic agent to treat a variety of infectious diseases. Selman Waksman was awarded the 1952 Nobel Prize in physiology or medicine for the discovery of streptomycin as the first antibiotic effective against tuberculosis.
From: http://amrls.cvm.msu.edu/pharmacology/historical-perspectives/the-golden-age-of-antibacterials Figure 1-5. The history of the golden age of antibiotics.
The serendipitous discovery and subsequent clinical successes of penicillin and streptomycin prompted a large-scale search for other microorganisms that might produce pharmacologically active natural products with anti-infective properties. The following decade are known as the ‘Golden Age of Antibiotics’ (Figure 1-5), the time period from the 1940s to the 1970s in which most of the modern drugs were discovered.
About 200,000 natural compounds are currently known until 2005 (Tulp and Bohlin, 2005). The chemical diversity of natural compounds represents a basis for their use in drug therapy. Some show antibacterial activities (β-lactams, aminoglycosides), antifungal activities (lipopeptides, non- lipoeptides), antimalarial (nucleoside analogues, HIV protease inhibitors), and some are enzyme inhibitors which can be used to treat cardiovascular (the β-adrenergic amines, cholesterol lowering
agents, angiotensin converting enzyme inhibitors (ACE inhibitors), pain and central nervous system (the opiates, the conotoxins, the epibatidines).
Figure 1-6. The structure of streptomycin.
About 50% of the drugs introduced into the market during the last 20 years are derived directly or indirectly from natural products (Vuorela et al., 2004). Even a high percentage of pharmaceuticals are products of synthetic chemistry, natural products have by no means forfeited their importance as a source of new drugs. During the period from 1981 to 2006, 68% of anti-infectives and 63% of drugs used in cancer treatment were derived from natural products (Newman and Cragg, 2007).
1.2 Marine natural products
Secondary metabolites, in limited consideration, are thought to have specific functions in interrelationships between microorganisms and are produced under specific environmental conditions.
Throughout the long time period of human history, traditional pharmacognosy mainly focused on the investigation and identification of medically important plants and animals in the terrestrial environment. Due to the increasing infectious resistance, available treatments for many diseases became limited. In addition, diseases caused by viral pathogens have demonstrated the need for new medicines. Today, many scientists focus the research for new drugs to the oceans. The oceans cover more than 70% of the earth’s surface and have more biological and chemical diversity and higher probability of yielding natural products with unprecedented carbon skeletons than that in terrestrial environments.
Marine sources may contain over 80% of the world’s animal species (Chakraborty et al., 2009) and account for 90% of biomass of the earth’s total biomass. Since the organisms first appeared in the sea over 3.5 billion years ago, they developed numerous mechanisms to survive various harsh conditions in marine environments such as high salinity, extreme high or low temperatures, high pressure,
different levels of aeration and radiation in layers and harsh conditions in the depth of the ocean (Jimeno et al., 2004; Skropeta, 2008). Therefore, the diversity of marine microorganism is very high and the ocean is considered as a treasure box containing lots of hidden biological, pharmacological active natural products. This consideration has initiated great interest in the marine organisms and in particular in marine natural products recently. Our current understanding on marine life in general and marine microbial life in special is rather limited (less 1% of marine microorganisms are known to date) and marine natural products chemistry is still young, dating back only to the 1950s. In the early days, marine natural products discovery mainly focussed on most conspicuous and easily collected organisms. Chemists turned to the marine microorganisms with the development of open circuit self- contained underwater breathing apparatus (SCUBA) in the 1940s. Today, more than 22,000 marine metabolites have been isolated and structurally characterized (Gerwick and Fenner, 2013).
In the early 1950s arabinose nucleosides (spongouridine and spongothymidine) from a Caribbean sponge were discovered and later due to their potent activities used for the development of anticancer drugs by Bergmann (Buss and Butler, 2010). The drug discovery starts its focus to marine natural products chemistry in the 1970s. By 1974, two marine-derived natural products (cytarabin, Ara-C and vidarabine, Ara-A) were part of the pharmacopeia used to treat human disease (Mayer et al., 2010b).
Almost 30 years later, another novel marine-derived natural product, ziconotide (Prialt®) gained approval and become part of the pharmacopeia for the treatment of severe pain. In 2007, Yondelis®
has received European approval for the treatment of soft tissue sarcoma (STS) and for ovarian carcinoma (in 2009).
At present, most marine natural products are either sterols, terpenes, saponins, unsaturated fatty acids, polysaccharides and glycosides, macrolides, polyether compounds, enzymes or peptides which have shown promise in treating cancer, pain, inflammation, allergies, and viral infections (Newman and Cragg, 2004; Newman and Cragg, 2012).
In the last 60 years, marine natural products have become fascinating targets for searching lead compounds in the purpose of clinical development (Cooper, 2004; Bhadury et al., 2006; Bull and Stach, 2007; Williams, 2009; Jones et al., 2009; Gulder and Moore, 2009; Mayer et al., 2011; Mayer et al., 2010a; Villa and Gerwick, 2010; Waters et al., 2010). There are several databases of natural compounds from marine sources. For example, 42 950 natural products were identified from marine microorganisms which possess highly interesting pharmaceutical properties by September of 2014 from the database of AntiBase 2014 (Laatsch, 2014). 35 000 natural compounds were selected in marine chemistry of the Chapman & Hall/CRC Dictionary of Marine Natural Products database (untill November 2015).
However, only few marine natural products have been advanced to pharmaceuticals and achieved full commercial application. From 2003-2013, 10 599 natural products were isolated and identified from
marine environment and hundreds of new natural compounds are found from marine organisms per year, especially over 1 000 new compounds are discovered every year since 2008 (Hu et al., 2015) (http://marinepharmacology.midwestern.edu/clinPipeline.htm). Nevertheless, only 39 compounds (until August 2015) account for a small percentage of these have been tested for pharmaceutical potential as following (in clinical used or in preclinical phases).
There are now six drugs approved by the Food and Drug Administration (FDA), namely cephalosporin C (brentuximab vedotin, SGN-35, Adcetris®), cytarabine (Ara-C, Cytosar-U®, Depocyt®), eribulin mesylate (E7389, Halaven®), omega-3-acid ethyl esters (Lovaza®), ziconotide (Prialt®), and vidarabine (Vira-A®), one EU registered drug trabectedin (ET-743, Yondelis®), and 32 natural products or derivatives in different phases of the clinical pipeline. In addition, a large number of marine natural products (http://marinepharmacology.midwestern.edu/clinPipeline.htm) are in the preclinical pipeline.
More detailed information of marine natural compounds is shown in Table 1-1. From a global perspective the marine pharmaceutical pipeline remains very active, and now has sufficient momentum to deliver several additional compounds to the marketplace in the near future (Mayer et al., 2010a).
Although the percentage of marine natural products that can be expected to be promoted into a drug is very low (1 out of 331), it is highly likely that an increasing number of marine bioactive compounds will be approved for the treatment of human diseases (Haefner, 2003; Nastrucci et al., 2012; Liu et al., 2012).
Many different marine organisms have been explored for bioactive compounds such as vertebrate animals (e.g. fish, sharks and snakes), invertebrates (e.g. sponges, coelenterates, tunicates, echinoderms, corals, algae, mollusks and bryozoans), as well as microorganisms (bacteria and fungi) (Chakraborty et al., 2009).
In symbiotic relationship with e.g. sponges and tunicates, bacteria could be the actual producers of some of the metabolic products (Piel, 2004). Recently, attention turned to marine microorganisms that had previously escaped cultivation and examination, such as marine cyanobacteria, actinobacteria and fungi. Marine microorganisms will certainly be of particular interest in the future especially due to their ability to produce new valuable bioactive compounds with different pharmacological activities (Salomon et al., 2004).
There are many compounds produced by marine bacteria, mostly come from cyanobacteira, however, salinosporamide A (NPI-0052, marizomib) with cytotoxic activity trials was isolated from the marine actinobacterium Salinispora tropica (Feling et al., 2003; Niewerth et al., 2014).
Reports on marine natural products with anticancer, antibacterial activities, and effects against other infectious diseases are discussed in various reviews (Molinski et al., 2009; Newman et al., 2000;
Newman and Cragg, 2012; Newman and Cragg, 2014; Munro et al., 1999; Haefner, 2003; Gerwick and Moore, 2012; Mayer et al., 2010a; Mayer et al., 2013).
Table 1-1. Some marine natural products isolated from microorganisms.
Compound name Trade-
mark Marine organism Activity Chemical class
Molecular
targets Reference Clinical
status Brentuximab
vedotin (SGN-35) Adcetris® Mollusk/cyanobacterium anticancer ADC(MMAE) CD30 & microtubules Katz et al. (2011) FDA- approved ABT-414
EGFRvIII-MMAF NA Mollusk/cyanobacterium anticancer ADC(MMAF) EGFR & microtubules Phillips et al. (2013) II Glembatumumab
Vedotin (CDX-011) NA Mollusk/cyanobacterium anticancer ADC (MMAE) GPNMB & microtubules Naumovski and Junutula
(2010) II
PSMA-ADC NA Mollusk/cyanobacterium anticancer ADC (MMAE) PSMA & microtubules Petrylak et al. (2014) II DNIB0600A NA Mollusk/cyanobacterium anticancer ADC (MMAE) NaPi2b & microtubules Lin et al. (2014) I/II Pinatuzumab
vedotin (DCDT-2980S)
NA Mollusk/cyanobacterium anticancer ADC (MMAE) CD22 & microtubules Pfeifer et al. (2015) I/II
Polatuzumab vedotin (DCDS-4501A)
NA Mollusk/cyanobacterium anticancer ADC (MMAE) CD79b & microtubules Pfeifer et al. (2015) I/II
AGS-16C3F NA Mollusk/cyanobacterium anticancer ADC (MMAE) ENPP3 & microtubules Thompson et al. (2015) I ASG-67E NA Mollusk/cyanobacterium anticancer ADC (MMAE) CD37 & microtubules Pereira et al. (2015) I ASG-15ME NA Mollusk/cyanobacterium anticancer ADC (MMAE) SLITRK6 & microtubules Jain et al. (2015) I ASG-22ME NA Mollusk/cyanobacterium anticancer ADC (MMAE) Nectin-4 & microtubules Jain et al. (2015) I DEDN6526A NA Mollusk/cyanobacterium anticancer ADC (MMAE) ETBR & microtubules Infante et al. (2014) I DMUC5754A NA Mollusk/cyanobacterium anticancer ADC (MMAE) Mucin 16 & microtubules Liu et al. (2013) I DSTP3086S NA Mollusk/cyanobacterium anticancer ADC (MMAE) STEAP1 & microtubules Danila et al. (2014) I
HuMax®-TF-ADC NA Mollusk/cyanobacterium anticancer ADC (MMAE) Tissue Factor &
microtubules Newman and Cragg (2014) I Marizomib
(NPI-0052;
Salinosporamide A)
NA Bacterium anticancer Beta-lactone-
gamma lactam 20S proteasome Feling et al. (2003) I
MLN-0264 NA Mollusk/cyanobacterium anticancer ADC (MMAE) GCC & microtubules Jain et al. (2015) I SGN-CD19A NA Mollusk/cyanobacterium anticancer ADC (MMAE) CD19 & microtubules Jain et al. (2015) I SGN-LIV1A NA Mollusk/cyanobacterium anticancer ADC (MMAE) LIV-1 & microtubules Jain et al. (2015) I
PM00104 Zalypsis® Mollusk anticancer Alkaloid DNA-binding Guirouilh-Barbat et al.
(2009) II
Soblidotin
(TZT 1027) NA Bacterium anticancer peptide
microtubule & monosodium glutamate-induced tubulin
polymerization
Natsume et al. (2000) III
ADC: Antibody Drug Conjugate; CD: Cluster of Differentiation; EGFR: Epidermal Growth Factor Receptor; ENPP3: Ectonucleotide Pyrophosphatase/Phosphodiesterase Family Member 3;
ETBR: Endothelin B Receptor; FDA: Food and Drug Administration; GCC: Guanylyl Cyclase C; GPNMB: Glycoprotein nonmetastatic B; LIV-1: Zinc transporter SLC39A6; NA: Not Available; NaPi2b: Sodium-Dependent Phosphate Transport Protein 2b; PSMA: Prostate-Specific Membrane Antigen; SLITRK6: SLIT and NTRK-like protein 6; STEAP1: Anti-Six Transmembrane Epithelial Antigen of the Prostate 1
1.3 Methods of natural products screening
Natural products become one of the most important sources for lead compounds in drug discovery.
Most biologically active natural compounds are secondary metabolites with very complex structures.
The compounds usually have to be extracted from the natural source by complex processes including the isolation, identification, structure elucidation and characterization of the chemical substances produced by living organisms.
In traditional drug discovery, if the lead compound or active compound is present in a mixture of other compounds from a natural source, it has to be purified and isolated. The elucidation of the chemical structure is critical to identify the compounds. Potential bioactive compounds were extracted by different solvents and structure elucidated with the help of the technologies that have become widely used in the pharmaceutical industry, such as high-performance liquid chromatography coupled with diode array detection and mass spectrometry (HPLC-DAD/MS) for the analytical screening. Semi- preparative high-performance liquid chromatography (semi-preparative HPLC) is often used to separate the individual chemicals, and nuclear magnetic resonance (NMR) spectra are used to obtain structural information of novel compounds showing interesting bioactivity. These methods allow purification and characterization of secondary metabolites from natural sources.
For detecting the secondary metabolite pathways for natural products synthesis, genetic approaches are promising tools. The genome analysis of marine microorganisms facilitates the use of specific genes for biotechnological applications such as the production of new drugs. Part of known natural products are derived from nonribosomal peptides and polyketides (Donadio et al., 2007) which are biosynthesized by nonribosomal peptide synthetase (NRPSs) and polyketide synthases (PKSs), respectively. PKs and NRPs are the key enzymes in the regulation of secondary metabolite biosynthesis of polyketides and nonribosomal peptides, respectively.
1.3.1 Polyketides
Polyketides (PKs) are produced by bacteria, fungi, plants and animals and represent a large and important class of secondary metabolites with diverse biological activities and pharmacological properties They are an important source of naturally occurring small molecules used for chemotherapy (Koehn and Carter, 2005) and structurally classified into four major groups: aromatics (e.g., doxorubicin and tetracycline), macrolides (e.g., erythromycin and rapamycin), polyethers (e.g., monensin and salinomycin), and polyenes (e.g., amphotericin and candicidin) (Shen, 2000). For example, rapamycin (immunosuppressant), erythromycin (antibiotic), lovastatin (anticholesterol drug), and epothilone B (anticancer drug), avermectin (antihelmintic agent) can be produced industrially (Wawrik et al., 2005).
The common feature of polyketides natural products is that they are biosynthesized by repeated addition of small building blocks to form a linear chain. The polyketide chains, which are catalyzed by large enzyme complexes, polyketide synthases (PKSs), are frequently further modified into bioactive natural products.
PKSs are a family of large multienzyme protein complexes that consists of multiple active domains organized into modules. PKSs are divided into three classes: type I PKSs are multifunctional proteins consisting of processive or iterative multidomains for individual enzyme activities and have been found in bacteria, fungi and plants; type II PKSs are aggregates of mono-functional discrete proteins which are involved in the biosynthesis of aromatic natural products (e. g., actinorhodin, tetracenomycin and doxorubicin) only in bacteria so far; and type III PKSs are always responsible for the synthesis of small aromatic molecules in plants and bacteria without having a phosphopantetheinyl (P-pant) arm.
Many of the polyketide synthase pathways have not yet been characterized (Castoe et al., 2007; Ridley et al., 2008). However, the key chain-building step of polyketide biosynthesis is a decarboxylative condensation of extender units with the growing polyketide chain that is analogous to the well- understood chain elongation process (a Claisen condensation) of fatty acid biosynthesis (catalyzed by fatty acid synthases, FASs) (Khosla et al., 1999; Jenke-Kodama et al., 2005).
The synthesis of a polyketide requires multidomains that can be organized in modules. Each module is responsible for the construction of a carbon-carbon bond. There is a loading module in most PKSs for obtaining the starter unit at the front of module 1. The loading module of type I PKS normally starts with the acyltransferase (AT) domain. The AT-domain is responsible for loading of starter, extender and intermediates bound to the enzymatic machinery.
Acyl carrier protein (ACP) domains are dependent on a post-translational modification to function.
This modification is the attachment of a 4’-phosphopantetheine cofactor to a conserved serine residue.
Therefore the substrates are covalently attached to the growing polyketide via a thioester bond with an SH group on the 4’-phosphopantetheine (4’PP) cofactor. The extension of polyketide is catalyzed by β-keto-acyl-synthase (KS) between the growing poly-β-ketone intermediates and ACP. The growing acyl chain can be further modified with β-keto reductase (KR, responsible for the first reduction to alcohol functionality), enoyl reductase (ER, catalyzes the final reduction to full saturation) or dehydratase (DH, responsible for eliminating water to give an unsaturated thioester) domains before finally being released from the enzyme complex via a thioesterase domain (TE, responsible for unloading the product at the end of the last module). These type I and II polyketides are synthesized via the step-wise condensation. In the case of modular type I PKSs, it includes iterative PKSs, which reuse domains in a cyclic fashion, and modular PKSs, which contain a sequence of discrete modules and do not repeat domains. This type I PKSs include non-reducing PKSs (NR-PKS), the products of
which are true polyketides, the practically reducing PKSs (PR-PKS), and fully reducing PKSs (FR- PKSs) which are fatty acid derivatives.
An individual domains in a full type I polyketide synthase extension module. Homodimeric contacts are made in the N- terminal docking, ketosynghase, dehydratase, enoyl recuctase, and C-terminal docking domains (Tonia J. Buchholz et al., 2009).
Figure 1-7. Conventional modular type I PKS paradigm.
Figure from Siezen and Khayatt (2008)
Figure 1-8. Basic steps during polyketide synthesis.
Type II PKS systems are aggregates of monofunctional proteins. They produce a linear polypeptide by the action of an iteratively used keto-synthase (KS) domain with an SH group on a cysteine side-chain, and make the unmodified aromatic polyketide together with chain length factor (CLF), aromatase (ARO), cyclase (CYC).
Type III polyketide synthases (PKSs) have been found in bacteria, fungi and plant. Type III PKS systems which do not use ACP domains are simple homodimers of KSs which catalyze the condensation of two β-keto fatty acyl CoAs to several molecules of extender substrate onto a starter substrate via iterative decarboxylative Claisen condensation reactions (Katsuyama and Ohnishi, 2012;
Hashimoto et al., 2014). Many compounds produced by microbial type III PKSs have significant biological functions or important pharmaceutical activities.
Several polyketide antibiotics, antifungals, cytostatics, anticholesteremic, antiparasitics, coccidiostats, animal growth promoters and natural insecticides are now in commercial use.
1.3.2 Nonribosomal peptides
Many microorganisms have evolved an unusual way of producing secondary peptide metabolites, using a nonribosomal peptides biosynthesis, which is differ from the ribosomal pathway. Non- ribosomal peptides (NRPs) are produced by a large number of bacteria, fungi, and lower eukaryotes.
The biological functions of most nonribosomal peptides are unknown; however, for some of them an essential function has been identified. For example, the well-studied penicillin produced by Penicillum notatum is a weapon against nutrient competitors, and the siderophore bacillibactin helps its producer Bacillus subtilis to acquire iron and thereby prevent iron starvation (Schoenafinger and Marahiel, 2009).Nonribosomal peptides (NRPs) are a diverse class of cyclic and branched linear peptide secondary metabolites. They are synthesized by mega-enzymes nonribosomal peptide synthetases (NRPSs) which compose a unique class of multidomain enzymes capable of producing peptides with various functions, such as cytostatic, immunosuppressive, antibacterial, or antitumor properties. The mechanisms of NRPSs are a kind of assembly line of template-directed, nucleic-acid-independent modules. Each module takes up one specific amino acid and each one of NRPS can produce only one type of nonribosomal peptide (Weber and Marahiel, 2001).
Modules can be subdivided into initiation and elongation modules (Finking and Marahiel, 2004).
These modules catalyse at least the steps of substrate activation, covalent binding, and peptide bond formation of nonribosomal peptide synthesis.
Before peptide formation occur, the building blocks (amino acids) to be condensed need to be recognized and activated. The adenylation (A) domain is capable of substrate recognition and formation of the corresponding acyl-adenylate-monophosphate by consumption of ATP. Thus, the
peptidyl carrier protein (PCP) domain (∼90 amino acid residues, counterpart to the ACP in PKS and FAS) acts as a thioester through covalent fixation to keeping the reaction intermediates bound to the enzymatic machinery. PCP domains are post-translational modified to function via the attachment of a 4’-phosphopantetheine cofactor to a conserved serine residue. Thus, amino acids are covalently attached to PCP domains via a thioester. After such an acylation, the PCP domain directs the substrate toward the next processing condensation (C) domain (∼450 aa). The C domain catalyses the formation of peptide bonds between an activated aminoacyl bound intermediate and a peptidyl-bound intermediates of two adjacent module. The growing peptide chain is handed over from one module to the next until it reaches the PCP-domain of the final module, in which a transesterification (TE) domain (∼250 aa) promotes the liberation of the assembled peptide from the synthetase.
The basic set of domains within a module can be edited and/or extended by optional modification domains, including domains for substrate epimerization, N-methylation, and oxidation, methylation, reduction domains, and heterocyclic ring formation. Cyclization of amino acids against the peptide
"backbone" is often performed, resulting in further oxidized or reduced oxazolines and thiazolines. In addition to the essential domains, a number of tailoring enzymes act in the maturation of the NRPS- products.
Figure modified from Siezen and Khayatt (2008).
Figure 1-9. Basic steps during nonribosomal peptide synthesis.
Although NRPSs, PKSs, and fatty acid synthases (FASs) are related in their biosynthetic logic, the existence of NRPS-PKS hybrids led to the assumption that at least the PKS part of the protein should dimerize. The NRPS part of the protein, however, was thought to retain a monomeric architecture.