www.biogeosciences.net/12/345/2015/
doi:10.5194/bg-12-345-2015
© Author(s) 2015. CC Attribution 3.0 License.
Lena Delta hydrology and geochemistry: long-term hydrological data and recent field observations
I. Fedorova1,2, A. Chetverova2,1, D. Bolshiyanov2,1, A. Makarov1,2, J. Boike3, B. Heim3, A. Morgenstern3, P. P. Overduin3, C. Wegner4, V. Kashina2, A. Eulenburg3, E. Dobrotina1, and I. Sidorina2
1Arctic and Antarctic Research Institute, St. Petersburg, Russia
2Hydrology Department, Institute of Earth Science, Saint Petersburg State University, St. Petersburg, Russia
3The Alfred Wegener Institute, Helmholtz Centre for Polar and Marine Research, Potsdam, Germany
4Helmholtz Centre for Ocean Research, Kiel, Germany Correspondence to: I. Fedorova (umnichka@mail.ru)
Received: 25 June 2013 – Published in Biogeosciences Discuss.: 23 December 2013 Revised: 20 October 2014 – Accepted: 10 November 2014 – Published: 19 January 2015
Abstract. The Lena River forms one of the largest deltas in the Arctic. We compare two sets of data to reveal new in- sights into the hydrological, hydrochemical, and geochemi- cal processes within the delta: (i) long-term hydrometric ob- servations at the Khabarova station at the head of the delta from 1951 to 2005; (ii) field hydrological and geochemical observations carried out within the delta since 2002. Periods with differing relative discharge and intensity of fluvial pro- cesses were identified from the long-term record of water and sediment discharge. Ice events during spring melt (high wa- ter) reconfigured branch channels and probably influenced sediment transport within the delta. Based on summer field measurements during 2005–2012 of discharge and sediment fluxes along main delta channels, both are increased between the apex and the front of the delta. This increase is to a great extent connected with an additional influx of water from trib- utaries, as well as an increase of suspended and dissolved material released from the ice complex. Summer concentra- tions of major ion and biogenic substances along the delta branches are partly explained by water sources within the delta, such as thawing ice complex waters, small Lena River branches and estuarine areas.
1 Introduction
1.1 The Lena River delta study area
The Lena River, which flows into the Arctic Ocean, is one of the biggest rivers in Russia: 4400 km long from its
source near Lake Baikal to its mouth. The mean annual Lena River discharge rate in 2007 was 16 800 m3s−1, and the mean annual sediment flux was 680 kg s−1for suspended and 170 kg s−1 for bottom sediments (Alekseevsky, 2007).
Accompanying these fluxes are mean flux rates for major ions (1460 kg s−1), plankton (12 kg s−1), and heat discharge (0.49×10¹²J s−1). The Lena can be divided into several areas, differing in the gradient of water surface elevation, fluvial forms, hydraulics, and transporting capacity. As it passes through its estuarine area, the main Lena flow is di- vided into numerous arms and transverse branches, creating the largest delta in the Russian Arctic. The Lena Delta area also comprises two large regions of late Pleistocene accu- mulation plains that are mostly untouched by modern ac- tive deltaic processes (Schwamborn et al., 2002). The total area of the Lena River delta, if Stolb Island is assumed to be its upstream limit, is over 25 000 km2and includes more than 1500 islands, about 60 000 lakes, and many branches of the Lena River (Antonov, 1967). If the delta’s upstream limit is defined as including the Bulkurskaya Lena River branch to Tit-Ary Island, the delta area exceeds 32 000 km2 (Walker, 1983). The Lena River delta is a complex of more than 800 branches with a total length of 6500 km. River branches flow in different directions, some diverging, others converging. The biggest branch is the Trofimovskaya branch;
from this branch the Sardakhskaya branch diverges after Sar- dakh Island (Fig. 1). The second largest branch by volume is the branch that turns sharply to the east after Sardakh Is- land and flows into Buor Khaya Gulf. The next two largest
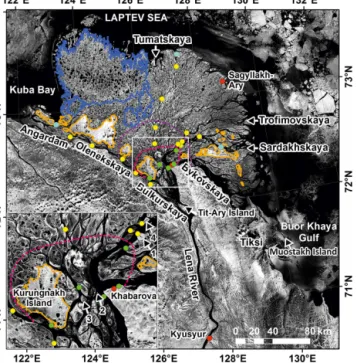
Figure 1. Place names in the Lena River delta and the loca- tions of measurement profiles during expeditions from 2002 to 2012. Red circles: polar stations of Russian Federal Service for Hydrometeorology and Environmental Monitoring (Roshydromet) (Hydrometeoizdat, 2002–2012); green circles: standard hydrome- teorological cross-sections of Roshydromet; yellow circles: addi- tional cross-sections along the branches; light-blue circles: outlet (estuarine) cross-sections. Units with non-deltaic deposits within the Lena Delta: orange outline: ice complex deposits (third terrace);
blue outline: late Pleistocene fluvial sands (second terrace); pink dashed line: outer contour of a central delta: purple dashed line:
outer contour of a middle delta; 1: Sardakh Island; 2: Stolb Island;
3: Samoylov Island; 4: Gogolevsky Island.
branches are Olenekskaya branch, which flows west into the Kuba Gulf, and the Tumatskaya branch. Recently, a decrease in discharge has been observed in the Olenekskaya and Tu- matskaya branches (Fedorova et al., 2009a). The quantity of eroded material carried by the river and the processes that occur where the river water and sea water come into contact have led to the formation of a broad, shallow shelf surround- ing the Lena Delta below the Laptev Sea.
1.2 Review of existing literature 1.2.1 Hydrology of the Lena River delta
We investigate changes in water discharge and sediment fluxes channel cross-section morphology and sandbank ex- tent that occur in the delta branches.
Observations of the principal Lena River delta hydrolog- ical features have been carried out since 1951, when the Khabarova station was established (Fig. 1). Hydrographic studies of the Arctic and Antarctic Research Institute (Ma-
rine transport, 1956), Moscow State University (Korotaev, 1984a), Tiksi hydrological party (Seleznev, 1986; Atlas, 1948), and others have been conducted in the delta. Data collected by the beginning of the 21st century described the long-term change of river water volume and the redistribu- tion of water and sediment discharge in the delta branches.
Publications since around 2000 have dealt either with as- sessments carried out on the basis of previously published hydrological data (Berezovskaya et al., 2005; Ivanov, 1963;
Ivanov et al., 1983: Ivanov and Piskun, 1999; Rawlins et al., 2009; Shiklomanov and Lammers, 2009) or with new data from the Lena River catchment area discharging at the Kyusyur gauging section, upstream of the delta (Fig. 1; Ye et al., 2003, 2009). In contrast to the Lena River, where the magnitude of fluxes is dominated by the lateral river discharge, vertical fluxes (precipitation and evapotranspira- tion) dominate the summer water budget on the low-gradient polygonal tundra of the first terrace of the delta (Boike et al., 2013). Though redistribution of storage water due to lat- eral fluxes takes place within the microtopography of polyg- onal tundra (Helbig et al., 2013), the water balance here was controlled by the vertical fluxes. The long-term water budget modeled using precipitation–evapotranspiration, on the ba- sis of ERA reanalysis data, was roughly balanced, tending towards positive values (precipitation>evapotranspiration;
Boike et al., 2013).
1.2.2 Hydromorphology of the Lena River delta A few researchers studied the long-term change in the supply of suspended materials and the characteristics of fluvial pro- cesses that are related to the cryolithic zone, but they have not investigated features of related hydrological processes within the delta itself. Syvitski (2003) modeled an increase of Lena River sediments due to water discharge increase and found that an increase in temperature in a river basin increases runoff more than does increased precipitation in the catch- ment area. Although the model was not validated using in- dependent data and calculations for the delta itself were not carried out, the study concluded that erosion and runoff of sediments is intensified in places where the ice cover of the catchment area is degraded.
Lena River delta coastal zone erosion and accumulation in the delta front and inner shelf of the Laptev Sea have been studied (Are and Reimnitz, 2000; Grigoriev, 1993; Korotaev, 1984a, b, c; Korotaev and Chistyakov, 2002; Stein and Fahl, 2004; Wegner et al., 2013). Rachold et al. (2000) assumes that most sediment entering the Lena River delta is trans- ported through the delta to the sea, an assumption contra- dicted by the findings of Charkin et al. (2011). However, Rachold et al. (2000) and Are and Reimnitz (2000) showed that most Laptev Sea sediments are composed of material from thawing coastal ice complex deposits, which are near- surface syngenetic permafrost deposits with high ice con- tent (Schirrmeister et al., 2013). Through thermo-erosion,
they contribute sediment volume almost 2.5 times as great as the fluvial sediment fluxes (Rachold et al., 2000). Charkin et al. (2011) showed that whereas the old particulate or- ganic carbon (POC) in the Laptev Sea shelf waters origi- nates from the ice complex–coastal systems, the younger to modern POC and lignin tracers originate from the fluvial dis- charges and are widely distributed on the inner and the mid- dle Laptev Sea shelf. The main part of sediment supply by the Lena to the Siberian shelf is transported in the bottom nepheloid layer in submarine channels (Wegner et al., 2013).
Semiletov et al. (2011), Charkin et al. (2011), Heim et al. (2014), and Gordeev (2006) have analyzed the geochem- ical composition of material transported by the Lena River.
However, sediment fluxes and composition and their distri- bution among the branches of the Lena Delta are not an- alyzed. We show that the spatial distribution of water dis- charge, sediment load, geochemistry, and river-bed morphol- ogy changes within the delta. Changes to the hydromorphol- ogy of delta channels provide a possible explanation for the observed changes in discharge and suspended load along the delta arms.
1.2.3 Hydrochemistry and geochemistry of the Lena River delta
It is difficult to access the Arctic zone throughout much of the year; therefore, data describing Arctic river hydrochem- istry and geochemistry are poorly reported in the literature.
The first expeditions to collect Arctic river hydrochemical data describing the chemical composition of Arctic river wa- ters were conducted by the Omsk and Yakutsk territorial department offices of the Federal Service for Hydromete- orology and Environmental Monitoring of Russia (Roshy- dromet; e.g., Hydrological yearbook, 1974). Lena River hy- drochemistry at the Kyusyur gauging section (Fig. 1) and seasonal hydrochemistry in the main channel have been stud- ied (Alekseevskiy, 2007; Gordeev et al., 1999; Hoelemann et al., 2005; Izrael et al., 2004, 2012; Schpakova, 1999; Zubak- ina, 1979). Studies of the geochemistry of suspended matter are presented by Gordeev (2009), Hoelemann et al. (2005), and Savenko (2006). We present the hydrochemistry and geochemical composition of suspended material of the delta branches during the summer (July, August) 2005 and 2010–
2012.
2 Materials and methods 2.1 Long-term hydrological data
Five standard hydrometric cross-sections are located within the Lena River delta, one on the main channel (4.7 km upriver from Khabarova Station) and the others on the Bykovskaya, Trofimovskaya, Tumatskaya, and Olenekskaya main delta branches (Fig. 1). Observations began in 1951 at the Bykovskaya and Trofimovskaya cross-sections and in
1977 at the other three. Long-term observations on water dis- charge and sediment loads were used (Hydrological year- books, 1951–2007). At the Khabarova water gauge located on the Bykovskaya branch, water levels (H, m) were mea- sured visually using a depth gauge installed in the branch and according to standard Roshydromet methods;H values on hydrological cross-sections of other delta branches are calculated from rating curves. Daily water discharges (Q, m3s−1) are deselected from water discharge curves accord- ing to Instruction for Hydrometeorological stations and posts (1958) and Guidance document (1989). The cross-section at Kyusyur, which began operating in 1936, is used as the last hydrological cross-section for assessing Lena River runoff before water is diverted into the delta branches near Tit-Ary Island (Fig. 1). Measurements of water and sediment dis- charge at Kyusyur were carried out until 2007. From 1951 to 2005 depth and water and sediment discharge measure- ments were also conducted at the Khabarova cross-section, after which only water levels were recorded.
Long-term data are presented on the basis of monthly mean discharge for the period of record for each of the avail- able stations, permitting visualization of intra-annual and in- terannual variability. These fluctuations can be revealed on the basis of difference-integral flow curves analysis. The method of plotting the difference-integral curve for assess- ing the fluctuations was proposed by Glushkov (1934) and has found wide use in hydrology. To determine time periods with differing discharges and to compare average annual val- ues of Lena River water discharge with average long-term runoff, difference-integral curves (residual mass curve, inte- gral storage curve) were plotted (Reshet’ko and Shvarzeva, 2010; Rozhdestvenskiy and Chebotarev, 1974). Andreyanov (1960) was the first to conduct a comparative analysis of data based on standardized difference-integral curves of discharge rates.
t
X
i=1
(Ki−1) Cv
=F (t ) , (1)
whereKi is modular ratio,Ki= Qi
Q0,Qi is water discharge foriobservation,Q0is average water discharge value for the observation period,Cvis the coefficient of variation,F (t )is the curve of flow accumulation,t is a period of time. If the difference(KCi−1)
v is equal to zero for some period then the av- erage value of flow in this period coincides with average wa- ter discharge during the whole observation period. The sum of positive values of difference(KCi−1)
v corresponds to height- ened water flow, and the sum of negative values conforms to low water flow. The list of parameters are in Table 7.
However, at the centennial scale, the difference-integral curve leads to inaccurate higher and lower phases of intra- century intervals or does not reproduce them at all. There- fore, an analysis of average monthly sediment discharge and of the total runoff was conducted over the long-term pe- riod (as described above for each station) to identify shorter
intervals with differing water discharge and therefore erosive power.
The discharge of water or sediment load through a chan- nel cross-section is plotted against time starting at some ini- tial time (Shiklomanov, 1979). The average water content of observation periods was determined by
Kav=1+Fl−Fi
n , (2)
wherenis number of years in the interval,FlandFiare last and initial ordinates of the difference-integral curve. Curves were constructed for the head of delta and for the main chan- nel for various periods.
2.2 Field research
In order to analyze the current hydrological regime and the characteristics of water and sediment flux distributions in the delta branches, annual summer expeditions to the Lena Delta were undertaken from 2002 to 2012. Water and sediment dis- charges were measured and suspended and bottom sediments were sampled for geochemical and grain-size composition.
Hydrological measurements were carried out every year at the standard hydrometric cross-sections; in some years other sections were added. Figure 1 illustrates all measured cross- sections. All data describing discharge of water and sus- pended sediments – dates of measurements, coordinates of each cross-section, and channel parameters – are presented in the PANGAEA database (Fedorova et al., 2013).
Hydrological measurements were made along several branch lengths over 2–3-day periods when no sizable water- level fluctuations occurred. Measurements along the Olenek- skaya branch were realized in 2005 and 2012, and more briefly (with fewer cross-sections) in 2008, 2010, and 2011.
While measurements were made along the Olenekskaya branch in 2005, for example, water level at the Khabarova water gauge varied by only 20 cm during 2–3 days. Mea- surements along the Tumatskaya branch, from Samoylovsky Island to the mouth, were taken in 2006. Detailed Sar- dakhskaya branch measurements were carried out in 2002 and in 2005. Discharges recorded by the Bykovskaya branch water gauge at Khabarova showed differences of≤3 %, al- lowing values to be compared with no need to introduce ad- ditional adjustments, with the exception of diurnal measure- ments at estuarine stations. Water discharges at the standard hydrometric cross-sections were calculated to the water level at the Khabarova water gauge, allowing those data to be used for long-term comparisons (Instruction for Hydrometeoro- logical stations and posts, 1978).
Hydrometric observations included water depth, current velocity, and total suspended solids (TSS) content in water.
Depth was measured twice using Garmin GPSmap 178C and GPSmap 421s echo sounders on board a motor boat or a river transport vessel. Some positions were determined us- ing a Garmin GPSMap76CSX navigator. Vertical profiles of
at least three measurements of current velocity were mea- sured at characteristic points of bottom relief on each cross- section. Current velocity measurements on each vertical were carried out on standard horizons, i.e., surface, 0.2, 0.6, and 0.8h, and bottom (detailed five-point method, points given as fraction of total water depth,h). Truncated velocity measure- ments were frequently made: (a) 0.6h(single-point); (b) 0.2 and 0.8h (standard two-point), and (c) 0.2, 0.6 and 0.8h (three-point). Current velocity measurements at the selected hydrometric cross-sections and surveying work at the cross- sections followed Instructions on Hydrometric Stations and Posts (1978).
Current velocities from 2002 to 2010 were measured with a GR-21M precalibrated velocity meter; in 2011 and 2012 measurements were carried out with a 2D-ACM multipara- metric probe of Falmouth Scientific, Inc. (FSI). To ensure that data collected using two different devices were equiv- alent, measurements were conducted using both devices si- multaneously. Maximum discrepancies were ±0.01 m s−1 and measurements from the two devices were treated as equivalent. Water discharge was calculated according to Q=0.7υ1f0+
υ1+υ2 2
f1+. . .+
υn−1+υn 2
fn−1
+0.7υnfn, (3)
whereQ, m3s−1is water discharge;ν1−nis average current velocity (m s−1) on the first–n velocity verticals;f0, m2 is water-section area between the bank and the first velocity vertical;f1is water-section area (m2) between the first and second velocity verticals, etc.;fn is water-section area be- tween the last verticalnand the bank. VelocityVmaveraged over the first–nvelocity verticals was calculated according to for the five-point method:
Vm=0.1·(Vs+3·V0.2h+3·V0.6h+2·V0.8h+Vb) , (4) for the three-point method:
Vm=0.25·(V0.2h+2·V0.6h+V0.8h) , (5) for the standard two-point method:
Vm=0.5·(V0.2h+V0.8h) . (6) When measuring velocity at one point, the mean velocity (Vm) was taken to be equal to the velocity at the 0.6hhori- zon. Areas between velocity verticals were calculated ac- cording to
f0=2/3h1b0, (7)
f1=
h1+h2 2
b1+
h2+h3 2
b2+. . .
+
hn−1+hn 2
bn, (8)
fn=2/3hnbn, (9)
where h1−n is the water depth of the measured verticals;
b1, b2, . . ., bn−1 are the distances between the measured
verticals;b0,bnare the distances between the outer measured verticals and the bank. Depth measurements were adjusted for vessel draft where necessary and averaged where dupli- cate values were available (the usual case).
Calculations were carried out using 102 water discharge measurements from all cross-sections. Water discharge mea- surements by a GR-21M velocity meter have an expected er- ror of 3–5 % (Zheleznov and Danilevich, 1966). The velocity meter measurement systematic error isσsys=0.02 m s−1and the random experimental errorσran=1.23 m s−1. The sum- marized field observations error SQ is also 1.23 m s−1 fol- lowing
SQ= q
σsys2 +σran2 . (10)
The critical measured velocity ucr can be calculated by (Zheleznov and Danilevich, 1966)
ucr=7.1 u0
√
β, (11)
β=6.9u0−0.06+ q
(2.3u0−0.055)2+0.00058, (12) whereu0is an initial velocity of the GR-21M velocity meter and is 0.01 m s−1. For our measurementsucr is 0.32 m s−1 less than the summarized field observations errorSQand can be accepted as satisfactory; measured water discharged can be used for analyses.
Water discharge calculated from field measurements dif- fers from long-term discharge records, which are calculated using the discharge curveQ=f (H ), by up to 30–40 % (Fe- dorova et al., 2009a). This is due to the fact that the required adjustments of correlation coefficients between water levels and water discharge volumes are not carried out at hydromet- ric stations. In recent years the water gauge altitude eleva- tions also appear to be in doubt. Starting in 2007, water-level and runoff data have been checked for such errors at the Arc- tic and Antarctic Research Institute (AARI, St Petersburg, Russia) in order to prepare them for publication in Hydro- logical Yearbooks.
To calculate sediment fluxes, SPM samples were selected from the same horizons where current velocities were mea- sured. Vertical profiles for suspended matter determination were sometimes reduced to one or two-points as detailed above because it took a long time to collect the water in a vacuum bathometer. For TSS measurements, samples were filtered through ashless filters of 11 cm diameter and 5–8 µm pore size using a GR-60 vacuum pump. For geochemical analyses polycarbonate filters 0.45 mm diameter, 0.7 µm pore size (PC; Sartorius AG) were used for major and trace ele- ment content. Filters were dried at 60◦C for paper and PC filters and weighted before filtration.
Suspended sediment supply,R, was calculated using R=
n
X
i=1
siqi, (13)
whereqi is water discharge (m3s−1) between verticals and si is mean value of TSS (mg L−1) between verticals.
Bottom sediments were collected using either a UWITEC gravity corer with a 60 cm long, 6 cm diameter PVC liner or a Hydrobios Van-Veen grab sampler and stored in plastic bags, which were transported, frozen, to the laboratory.
Water samples were taken at the same points as suspended particulate matter (SPM) samples. Water samples for main and trace elements were collected in 60 mL plastic bottles and samples were kept cool. Water samples for nutrients were collected into plastic 40 mL plastic bottles and frozen.
All samples were transported to St Petersburg for processing in the Russian–German Otto-Schmidt Laboratory for Polar and Marine Research (OSL)of the AARI laboratory.
2.3 Methods of laboratory sample processing
Suspended and bottom sediment samples collected in the field were analyzed in OSL and at the Alfred Wegener In- stitute (AWI, Potsdam, Germany). In keeping with the Rus- sian literature, we designate species as major dissolved ions (Ca2+, K+, Mg2+, Na+, Cl−, SO2−4 , HCO−3), aqueous trace elements (Al, Fe, Si, Li, Ba, Sr, Ni, Pb), and nutrients (sili- cate, phosphate, nitrite, and nitrate) (Alekin, 1970). The bulk dissolved species parameter – salinity (“mineralization” in the Russian literature) – is determined by summing of major ions’ concentrations.
Geochemical analysis of water and sediment samples (de- termination of major and trace element concentrations) was carried out via atomic emission spectrometry using an induc- tively coupled plasma optical emission spectrometer (ICP- OES; CIROS VISION). Solid samples of bottom sediments as well as SPM samples collected on PC filters were dis- solved prior to analysis in Teflon weighing bottles and heated in a mixture of acids: nitric (HNO3) – 3 mL, hydrofluoric (HF) – 4 mL, and perchloric (HClO4) – 3 mL. A sodium hy- droxide (NaOH) solution was used to neutralize the solution, then the rest of the prepared solution was diluted with deion- ized water to 25 mg. The final solution is measured on the ICP-OES. The methods of sample preparation and laboratory analyses are described in detail by Wetterich et al. (2009).
2.4 Hydromorphological analysis
Long-term studies of changes in the morphometric param- eters of lakes and delta branches require the use of carto- graphic methods to display the spatial, temporal, and quan- titative relationships between geomorphological, hydrolog- ical, and river-bed processes. For this purpose we employ change detection based on aerial and satellite images from different years (Snischenko, 1988; Usachyov, 1985). This method makes it possible to assess the rate of macro-form changes (Kondratyev et al., 1982). Changes in river-bed mor- phology were analyzed across the Trofimovskaya branch at Sardakh Island (Fig. 1). The obtained spatial change
detections were compared with field measurements of Trofi- movskaya branch depths on the Sardakh Island cross-section (Bolshiyanov et al., 2003; Korotaev, 1984a; Atlas, 1948).
Twenty-six aerial images of the studied Lena River delta area from 1951 were used as baseline data and several 1: 200 000 topographic maps were also included. Three Land- sat satellite images from 26 July 1973, 5 August 2000, and 26 June 2009, with a resolution of 60 m in 1973 and 15 m (for the panchromatic band) in 2000 and 2009 (http:
//glovis.usgs.gov) were also used to investigate hydromor- phological changes. The aerial images were georeferenced and mosaiced in Photomod Lite 5 software. The program is intended for photogrammetric processing of the remote sensing data. The Landsat satellite image data were georef- erenced and matched to one another using MapInfo Profes- sional 9.0.2 software. Changes in vector layers of river-bank line contours between years revealed bank cave-ins and areas of scouring or sedimentation. Average maximal rates of shift- ing were calculated (in meters per year) by dividing the ob- tained distance by which the bank had shifted (in meters) by the time interval between images (in years). The spatial res- olutions of the aerial images and the Landsat images differ.
Pixel resolution of the Landsat 1973 image is 60 m, and of the 2000 and 2009 Landsat images is 15 m (panchromatic band) (Usachyov, 1985; Riordan et al., 2006). The lower boundary of areal changes that can be detected in the case of the Land- sat MSS baseline data (1973) is 0.014 km2(±60 m× ±60 m mixed pixel error). For changes between 2000 and 2009 the lower boundary of change detection accuracy is 0.0009 km2 (±15 m× ±15 m).
Images were made between 26 July and 7 August, during the descending phase of the water regime. The water level changed from 250 to 270 cm relative to the height mark of the nearest water gauge at Sagyllakh-Ary. The area of braided bars was digitized and measured, and calculated in MapInfo software.
The volume of deposited or eroded sediments was calcu- lated by representing those sediments as a regular geomet- ric figure, in the case of this study as a truncated pyramid.
The calculation involves determining the volumes of differ- ent truncated pyramids. The area that existed during the most recent year of a period of interest, for example 1973, was taken as the upper plane of the pyramid; the area that existed during the first year of the period of interest, for example 1951, was taken as the lower plane. The selection of peri- ods is limited by image availability. Volumes were calculated from digitized areas via
W =1 31H
f0+f1+p f0f1
, (14)
wheref0andf1 are areas of sandbanks that existed on the dates when the images were captured, bounded by water sur- face;1H is the difference between water levels in the years under investigation.
3 Results
3.1 Long-term discharge changes
3.1.1 Data from the hydrometeorological network:
1951–2007
Analysis of long-term Lena River hydrological data from Kyusyur showed that, from the middle of the last century un- til the end of the record, average annual water discharge and suspended sediment flux show a positive linear trend (Fig. 2), yet the average annual water discharge remains below the long-term average value (Fig. 3). This is typical both for the outlet cross-section of the Lena River at Kyusyur and for the cross-section 4.7 km upriver at Khabarova, on the main prin- cipal delta area channel. Figure 3 shows a decrease in water discharge before the beginning of the 1970s and then a slight increase. In 1983 there was a sharp drop in water discharge which continued until the end of the 1980s, when the delta area water discharge decrease fell to its lowest recorded level (Fig. 2). From the late 1980s until today water discharge has continued to increase.
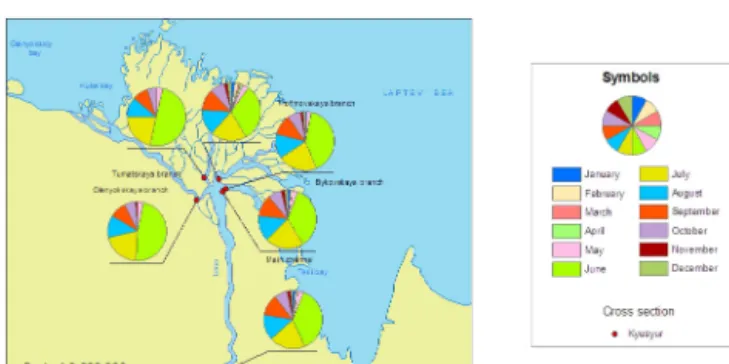
A long period of observing the intra-annual water dis- charge distribution shows that the largest increase of water discharge is observed during high water in May–June. Sus- pended sediments load is lower during high water (June) and higher during winter low water (February). More than 50 % of the suspended sediment discharge from the Olenekskaya and Tumatskaya branches occurs in June (Fig. 4).
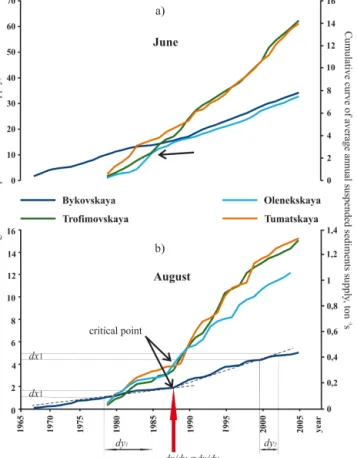
The rate of increase of cumulative suspended sediment discharge from the main delta branches shows variability over time (Fig. 5). Several points are evident at which the rate of increase changes, indicating hydromorphological pro- cesses of erosion and accumulation in the delta. The timing of the critical points is different for each branch. One can clearly see a critical point on the Olenekskaya branch during high water in 1983–1984. In August (middle of summer low water) this critical point on the Olenekskaya, Trofimovskaya, and, to a greater extent, Tumatsksya branches is typical for 1985–1986.
One can also observe a difference in angles of positive trend slopes during high water and low water. It is illustrated on Fig. 5: the same augmentation of the suspended supply cu- mulative curve carried out for different periods. Since about 1987, the June water content and sediment runoff have in- creased slightly in comparison with previous years. An even greater increase has been observed since the end of the 1990s for all branches. At the same time there has been a slight de- crease of water volume during the low-water period.
3.1.2 Field hydrological observations: 2002–2012 Discharges at the main branches measured at the standard hydrometric cross-sections, and calculated to the one water
Table 1. Measured dischargeQ(m3s−1) for the main branches. All discharges have been calculated normalized to one water level, equal to 365 cm at the Bykovskaya branch water gauge at Khabarova.
The Lena Delta main branches 2002 2004 2005 2006 2007 2008 2010 2011 2012
Main Lena channel 18 854 29 897 26 171 23 776∗ 31 998∗ 25 380∗
(1 Aug) (20 Aug) (29 Aug)
Olenekskaya branch 2023 2021 1693 2335 1700 1778 1406∗ 1180 1696
(2 Aug)
Bykovskaya branch 4007 5641 6140 4353
Trofimovskaya branch 12 824 15 038 14 800 20 800 15 299
Tumatskaya branch 2023 1746 1462 1730 1690 1037 2800 1225 643
∗Measured water discharges without normalization.
Figure 2. (a) Typical hydrograph for the Lena River delta (on the main channel section): average monthly water discharges for years with minimal (1987), maximal (1989), and average (2002) runoff;
(b) average annual water discharge from 1950 to 2005 on branches of the Lena River delta according to data from Roshydromet (Hy- drological yearbooks, 2002–2005).
level of 365 cm at the Bykovskaya branch water gauge at Khabarova, are specified in Table 1.
Our own field observation measurements between 2002 and 2012 showed that during the summer low-water pe- riod (August) discharge volumes from the main delta branches were in the ratio of 1:1:7:21 for the Olenek- skaya : Tumatskaya : Bykovskaya : Trofimovskaya channels, respectively. The data also show that discharge from the main Lena River channel before it branches near Stolb Is- land at the time of summer low water sometimes exceeded 30 000 m3s−1.
From the central delta to the sea there is, in general, a two-fold decrease in branch water discharge and sus- pended sediment supply (Fig. 6). But on some branches, the Sardakhskaya for example, water discharge can decrease
Figure 3. Difference-integral curve of average annual water dis- charge from 1935 to 2007 in the Lena River at Kyusyur, and from 1951 to 2005 in the Lena River main channel, at a cross-section 4.7 km upriver from Khabarova. “0” is the rate of water discharge.
Figure 4. Intra-annual distribution of average annual suspended sediment supply in the Lena River delta.
from 7942 m3s−1near Gogolevky Island to 11 m3s−1at the mouth. The discharge of sediments shows a similar change over the same distance, from 183 to 0.03 kg s−1. Because there are particular areas of channel scour and sediment accu- mulation within the delta itself, the discharge decrease along
Figure 5. Cumulative average monthly suspended sediment supply from the main delta branches based on data from the Russian hy- drometeorological network for June (a) and August (b). The right y-axis is for the Olenekskaya and Tumatskaya branches; the left y-axis is for the Bykovskaya and Trofimovskaya branches. The ar- rows indicate points at which the rate of increase of cumulative sus- pended sediment discharge shifts; dashed lines are trend lines.
the length of the branches occurs unevenly, i.e., there could be a local increase of water discharge and suspended sedi- ment supply in one area and a decrease in another.
This heterogeneity reflects the complex hydrographic lay- out of the delta and peculiarities of delta geological and geo- morphological structure (Bolshiyanov et al., 2013). Thus, in 2005 on the middle Olenekskaya branch the measured water discharge was 2065 m3s−1, at the beginning of this branch (after the influx of the Bulkurskaya branch) discharge was 1701 m3s−1, and at the mouth it was only 956 m3s−1. In 2012 discharges at the same cross-sections were 1609 and 1439 m3s−1, respectively. The same situation can be seen on the Tumatskaya and Sardakhskaya branches (Fig. 6).
It is also typical for TSS to change along the length of a branch. In general, TSS decreases from 50–100 mg L−1 in the head of the delta to 3–5 mg L−1on the sea edge. A major part of suspended sediments brought by the Lena River from the water catchment has already been deposited before the Lena reaches Lenskaya Truba (Lena’s Tube), where TSS of more than 250 mg L−1was observed during low water (Fe-
Figure 6. Discharge of water and sediments along the branches:
on the Olenekskaya branch during 2005 and 2012, on the Tu- matskaya branch during 2006, and on the Sardakhskaya branch during 2002. The distance of the measurement cross-section from the standard hydrometeorological cross-sections of Roshydromet is shown on the x-axis. The position of the standard hydrometeoro- logical cross-sections of Roshydromet on the branch (cross-section near Gogolevsky Island for the Sardakhskaya branch) is taken as zero.
dorova et al., 2009b). TSS also varies within the delta: in the center and at the edge it can vary by a factor of 2–10, while it remains more or less the same between the two lo- cations. Thus, during low water, values of TSS in the central delta (Fig. 1) vary from 20 to 45 mg L−1, in the middle reach of the branch they remain around 20–25 mg L−1, and at the edge they vary from 3 to 30 mg L−1.
3.2 River-bed hydromorphology changes in the Trofimovskaya branch area and change of water discharge near Sardakh Island
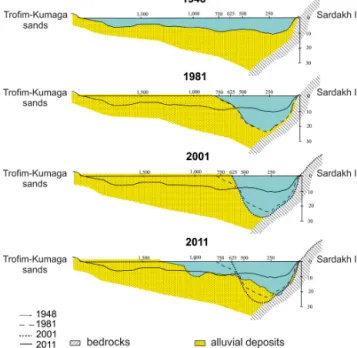
Using data from previous studies (Antonov, 1967; Korotaev, 1984b, c) and from field observations carried out within the framework of a Russian–German Lena River delta expedi- tion in the area of Sardakh Island and on the Trofimovskaya branch at the Sardakh-Khaya–Trofim-Kumaga cross-section made it possible to analyze the velocity and direction of river-bed morphology changes. Cross-section profiles of the branch channel that were obtained for various years dur- ing the low-water period clearly demonstrate erosion in this profile, indicating an accumulation of alluvial deposits on the left bank of the Trofimovskaya branch; the main water- course shifted to the right river bank, i.e., near Sardakh Is- land, which is a rocky island resistant to scouring (Fig. 7).
Over the period from 1948 to 1981 the width of the Trofi- movskaya branch channel decreased by more than half, while the depth increased from 10 to 22 m. Over the next 20 years
there were no fundamental channel changes, but from 2001 to 2010 sediments accumulated in the cross-section and the channel width increased, i.e., lateral erosion increased.
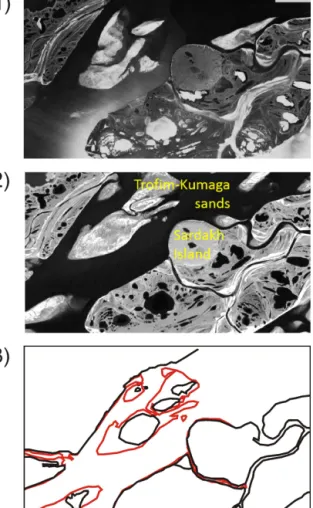
These changes were also traceable in comparing the differ- ent image acquisitions. Figure 8 shows the state of the Trofi- movskaya channel close to Sardakh Island in summer 1951 (aerial image) and in summer 2000 (Landsat satellite image).
These images show where sediment accumulated and where erosion occurred. The area of the Trofim-Kumaga sands sig- nificantly increased from 1951 to 2000.
In general, the Trofim-Kumaga sands opposite Sardakh Is- land are constantly changing. The braided sandbar area in- creased from 1951 to 2000, but by 2009 began to decrease again. Table 2 presents the results of aerial and volume changes according to Eq. (14) between 1951 and 2000.
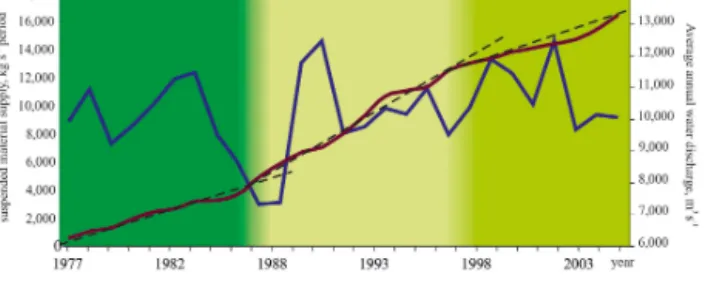
During the period from 1951 to 1973 the area of Trofim- Kumaga sands increased by 4.13 km2, while at the same time the sand volume increased by 2.45 km3. During the period from 1973 to 2000 the area increased by just 1.5 km2, but the volume increased by 6.09 km3. Roshydromet long-term data of water discharge and suspended sediment supply for Trofimovskaya branch confirm an increase and are presented in Fig. 9. Measurements carried out from 1977 to 2005 show a positive trend and mostly overlap the period during which changes in the Trofim-Kumaga sands’ morphometric charac- teristics were observed.
3.3 Geochemical results: ion sinks and the composition of suspended sediments
Studies conducted in the Lena River estuarine area (Zubak- ina, 1979), i.e., on the main delta branches, Tiksi Bay, Olenek Bay, the Buor-Khaya Gulf, and the Laptev Sea coast, estab- lished that water salinity of the Lena River varies throughout the year. In the area of Stolb on the principal channel salin- ity ranges from 84 to 613 mg L−1, while in the Bykovskaya branch it ranges from 55 to 561 mg L−1. Salinity of the Lena River delta varies inversely with water discharge. Dissolved major ion concentration is practically unchanged throughout its depth, as well as downstream. In winter low water oc- curs near Stolb Island and chloride minerals are prevalent with higher salinity. When the high water recedes, Ca2+and Mg2+ions dominate with higher salinity (up to 540 mg L−1).
From then until the freeze-up period, low salinity with dom- inance of carbonate and calcium ions prevails. Estuarine wa- ter pH fluctuates within narrow limits, from 7.27 to 7.82, reaching its minimum value during spring high water.
Considerable attention is paid in the modern literature to estimating the amounts of dissolved mineral and organic sub- stances carried by Arctic rivers to the Arctic Ocean. Ac- cording to Alekseevsky (2007), the average long-term an- nual major ion delivery at the Lena River closing cross- section equals 48.4–59.8×10⁶tons per year, including 37–
104×106tons per year sulphate, 6.3–11.3×10⁶tons per year chloride, 16.5–26.0×10⁶tons per year hydrocarbonate, 7.6–
Figure 7. River-bed deformation changes of the Trofimovskaya branch at the Sardakh-Khaya–Trofim-Kumaga cross-section near Sardakh Island for the years 1948, 1981, 2001, and 2011 (33-, 20- , and 10-year intervals, respectively). The x-axis shows distance (m) from Sardakh Island; the y-axis shows depth (m) of the Trofi- movskaya branch.
Table 2. The measured areas and volumes of Trofim-Kumaga sands on the Trofimovskaya branch close to Sardakh Island over various time periods.
Period Changes of Changes of Mean volume for area for changes of each period, each period, volume,
km3 km2 km3year−1
1951–1973 2.45 4.13 0.11
1973–2000 6.09 1.50 0.23
1951–2000 7.73 5.63 0.16
24.7×10⁶tons per year calcium, 2.4–5.8×10⁶tons per year magnesium, and 7.0–9.5×10⁶tons per year sodium.
Intra-annually, the maximum major ions’ flux occurs in the spring, due to the larger water volume carried by Arctic rivers and the high concentrations during this period. Silicon, iron, and ammonium nitrogen have the highest concentrations (Yearbook, 1989–2012). Annual transport is about 44.6× 10³tons per year ammonium nitrogen, 2.6×10³tons per year nitrite nitrogen, 32.5×10³tons per year nitrates, 3.7× 10³tons per year phosphates, and 7.3×10³tons per year total phosphorus (Gordeev et al., 1999).
The intra-annual Lena River ion runoff distribution varies considerably: up to 47 % of ion runoff occurs during the high-water period and up to 34 % in the ice-covered period.
Figure 8. Changes of areal extent of the Trofim-Kumaga sandbanks in the Trofimovskaya branch close to Sardakh Island area: (1) on 10 July 1951 (aerial image), (2) on 5 August 2000 (Landsat TM satellite image), (3) digitized contours of islands, watercourses, and water basins (red contour line for 1951, black for 2000).
Figure 9. Average annual water discharge (blue line) with trend (red line) and suspended sediment supply (green line) on the Trofi- movskaya branch over the period of instrumental observations ac- cording to data from Roshydromet (Hydrometeoizdat, 2002–2005).
The highest discharge of ammonium, nitrates, and iron oc- curs during the spring high-water period, when from 64 to 84 % of the annual nutrients’ runoff occurs. Data from labo- ratory analyses of water sampled during summer campaigns
Table 3. The range of dissolved element content concentrations of main ions and trace elements in water of Lena River delta large branches from the summer period (July–August), 2010 to 2011.
Type of Element Range of Mean
element concentration, value,
mg L−1 mg L−1
Major ions Ca2+ 15.2–18.9 16.8
K+ 0.5–1.1 0.6
Mg2+ 3.6–4.5 4.0
Na+ 4.1–8.8 5.5
Cl− 4.7–13.5 7.1
SO2−4 8.8–18.1 10.6
HCO−3 12.0–50.8 27.8
Salinity 63.8–83.9 71.8
Trace Alaq 0.009–0.07 0.017
elements Feaq 0.012–0.042 0.023
Siaq 1.6–2.1 1.8
Liaq 0.010
Baaq 0.007–0.016 0.013
Sraq 0.124–0.148 0.13
Niaq 0.020
Pbaq 0.050
Nutrients Silicates SiO2 1.4–2.4 1.8 Phosphates PO4 0.003–0.026 0.005 Nitrites NO2 0.003–0.011 0.006 Nitrates NO3 0.003–0.035 0.02
and field measurements are presented in Tables 3 and 4, re- spectively.
The hydrochemistry of the Lena within the delta is sim- ilar to data published by Zubakina (1979) and Alekseevsky (2007). Water from the major branches (Table 3) is character- ized by low salinity in the summer (≤84 mg L−1), low trace elements (<0.05 mg L−1) and nutrients (<2.5 mg L−1) con- tents, and high silicate concentration (≤2.4 mg L−1). The delta’s small branches (Table 4) and streams had high salinity (≤285 mg L−1). Geochemical characteristics of suspended sediments, i.e., the major petrogenic elements and trace elements content, were determined for large branches of the Lena Delta. These values are in good compliance with published data (Gordeev, 2009; Hoelemann et al., 2005;
Savenko, 2006) for the Lena River. Mean data and their range for the main delta channels are presented in Table 5.
4 Discussion
4.1 Hydrology of the Lena River delta and river-bed morphology
Long-term water discharge and sediment fluxes showed a positive trend. This has been observed before: Berezovskaya et al. (2004), Bolshiyanov et al. (2004), and Fedorova et
Table 4. Water salinity, turbidity, and temperature in the Lena River delta smaller branches and streams.
Stream/channel Temperature,◦C Turbidity, g L−1 Salinity, mg L−1
Ysy-Khaya-Tyobyulege branch 10.6 – 80
Stream 1 from Kurungnakh Island 6 495 285
Stream 2 from Kurungnakh Island 6 102 227
Sistyakh-Aryi-Uesya branch 11.2 – 53
Krestyakhskaya branch 10.2∗ 0.03 56
Stream 3 from Arga-Bilir-Aryita Island – 0.01 162
∗Measurement conducted on 22 August 2012; other data gathered collected on 8 August 2012.
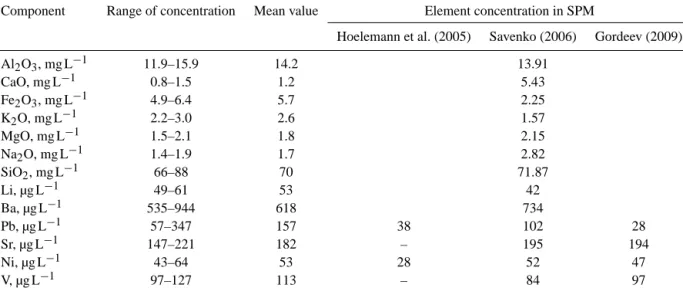
Table 5. Chemical elements found in suspended material from the Lena River delta in 2002–2012 in comparison with data from Savenko (2006), Hoelemann et al. (2005), and Gordeev (2009).
Component Range of concentration Mean value Element concentration in SPM
Hoelemann et al. (2005) Savenko (2006) Gordeev (2009)
Al2O3, mg L−1 11.9–15.9 14.2 13.91
CaO, mg L−1 0.8–1.5 1.2 5.43
Fe2O3, mg L−1 4.9–6.4 5.7 2.25
K2O, mg L−1 2.2–3.0 2.6 1.57
MgO, mg L−1 1.5–2.1 1.8 2.15
Na2O, mg L−1 1.4–1.9 1.7 2.82
SiO2, mg L−1 66–88 70 71.87
Li, µg L−1 49–61 53 42
Ba, µg L−1 535–944 618 734
Pb, µg L−1 57–347 157 38 102 28
Sr, µg L−1 147–221 182 – 195 194
Ni, µg L−1 43–64 53 28 52 47
V, µg L−1 97–127 113 – 84 97
al. (2009a) reported statistically significant positive trends (by Student’sttest andF ratio) in water discharge of an av- erage of 35 m3s−1year−1(0.22 % of the average long-term discharge for 1951–2005 period). Nevertheless, such an in- crease is slight, and until 2000 Lena River discharge (mea- sured at Kyusyur) was lower than the rate of water discharge (Fig. 3). From 2000 on, discharge increase began to rise sig- nificantly.
However, the increased water discharge occurs mostly dur- ing high water (June). During summer low water (August) there is a slight water discharge decrease (Fig. 5). In our opinion, it is premature to draw any conclusions about win- ter low water and possibly more crucial discharge varia- tions due to climate change. Model calculations (Fedorova et al., 2009b) show that hydrological systems require a long period of adaptation when parameters that control discharge formation change. Also, discharge measurements that have been carried out in the 21st century have been of varying quality, and sometimes do not meet the requirements of the hydrometeorological network; out-of-date devices and meth- ods are often used. For example, winter measurements of
water depth and flow have not been made for a period of more than 10 years. Long interruptions, for example, in sedi- ment discharge measurements in February are given in Ta- ble 6. The possibility of measurement inaccuracies at the Roshydromet stations has previously been noted by oth- ers (Berezovskaya et al., 2004). Previous measurements in the delta branches (Antonov, 1967; Bolshiyanov and Treti- akov, 2002; Gordeev, 2006; Ivanov et al., 1983; Ivanov and Piskun, 1999; had not shown long-term changing of water and sediment flow distribution between branches. Fedorova et al. (2009a) found the following distribution of the increase in flow, expressed as percentages of the observed discharge increase in the principal channel: 6.8 % in the Olenekskaya branch, 6.4 % in the Tumatskaya branch, 61.5 % in the Trofi- movskaya branch, and 25.3 % in the Bykovskaya branch.
At the Sardakh-Trofimovskaya branch point during the open water period, 20–26 % flows into the Trofimovskaya and 23–
33 % into the Sardakhskaya branches. On this background of longer term increases in discharge, however, is superimposed spatial and temporal variability in flow, caused by ice. Ice jams have an impact on this distribution of discharge within
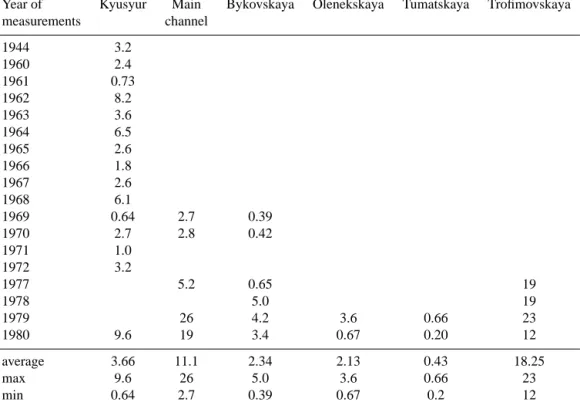
Table 6. Average monthly (for February) sediment discharges (kg L−1) during all periods of long-term observations on the standard hydrom- eteorological cross-sections of Roshydromet on the branch.
Year of Kyusyur Main Bykovskaya Olenekskaya Tumatskaya Trofimovskaya
measurements channel
1944 3.2
1960 2.4
1961 0.73
1962 8.2
1963 3.6
1964 6.5
1965 2.6
1966 1.8
1967 2.6
1968 6.1
1969 0.64 2.7 0.39
1970 2.7 2.8 0.42
1971 1.0
1972 3.2
1977 5.2 0.65 19
1978 5.0 19
1979 26 4.2 3.6 0.66 23
1980 9.6 19 3.4 0.67 0.20 12
average 3.66 11.1 2.34 2.13 0.43 18.25
max 9.6 26 5.0 3.6 0.66 23
min 0.64 2.7 0.39 0.67 0.2 12
the delta and its temporal variation (Izrael et al., 2012). They may, for example, cause a sharp increase of Bykovskaya branch water level, and can block the Olenekskaya and Tu- matskaya branches entirely.
Ice events in the delta play a significant role in river-bed processes; for example, an ice jam can cause greater fluvial adjustments than a change of water runoff volume. During one flood caused by an ice jam 40 m of shoreline was washed away due to thermal erosion and banks being cut by ice (Are, 1983). In our opinion, catastrophic ice events were the pri- mary cause of the dramatic increase of sediment runoff on the Olenekskaya branch in 1984 (Fig. 5), despite the fact that, from 1983 to 1984, no Olenekskaya branch jams were officially registered in the yearbooks. However, this cross- section is far from Khabarova, and visual observations are lacking because it is dangerous to access this area. In 1982 an ice jam was registered near Kyusyur on 1–6 June, and on 10–12 June a jam occurred near Tit-Ary Island, i.e., at the place where the delta begins to branch out. Here, the Bulkurskaya branch begins, which later enters the Olenek- skaya branch further upriver from the hydrometric cross sec- tion. According to yearbook data, there was no runoff of wa- ter and sediments on the Olenekskaya branch in June (during high water) in 1983. This was apparently due to the branch channel being blocked by ice. Ice jams were also observed near Kyusyur and Khabarova on 3–9 and 10–12 June, respec- tively. There was a sharp increase of average suspended sed-
iments on the Olenekskaya branch, from 290 kg s−1in 1982 up to 1400 kg s−1in 1984.
The annual cutoff of river bank edges during high water (Figs. 10, 11; Supplement 1) produces an unmeasured quan- tity of suspended and bottom sediments which are carried into the delta and, as a consequence, ejected into the delta front. Costard et al. (2003) noted the important role of slope erosion during flood periods for the middle part of the Lena River due to thermal erosion. A change detection study for Kurungnakh Island in the central Lena Delta showed mean annual river bank erosion rates of 2.9 and 1.8 m year−1 for two different cliff sections over the period 1964-2006 (Gün- ther, 2009). Such erosion can be a trigger for river-bed pro- cesses intensification and cause additional sediment runoff to streams (Morgenstern et al., 2011).
In the opinion of Charkin et al. (2011) and Heim et al. (2014), during the low water-level period in summer a rel- atively minor amount of suspended sediments is contributed to the sea from the Lena River branches delta. Heim et al. (2014) and Charkin et al. (2011) measured 3–5 mg L−1 in the estuarine parts of the delta and in the coastal waters of Buorkhaya Gulf in the surface water layer where veloc- ities are reduced. This is confirmed by our field data. The main marine sediment transport functions with the bottom nepheloid layer (Wegner et al., 2013). However, the volume and, more importantly, the composition of sediments on the
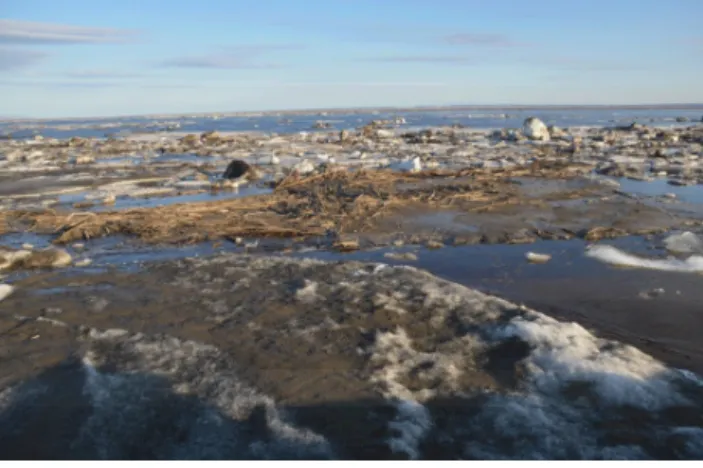
Figure 10. Ice on the sands of Sistyakh-Ariyta Island after a flood (photo by I. Fedorova).
delta edge and the quantity of sediments ejected onto the in- ner shelf have not been identified.
Questions that remain to be studied include how dissolved and solid substances are provided by the erosion of ice com- plex and flood plain terrace material and its resedimentation (Bolshiyanov et al., 2013). An increase of water and sedi- ment discharge occurs in the middle part of the Olenekskaya branch, where separate ice complex masses are exposed to the warming action of the water and active processes of bank thermoerosion and thermodenudation. The role of ground- water runoff from the thawed horizon in thermokarst areas is also mentioned in Woo et al. (2008). On Kurungnakh Island, water pools loaded with high amounts of sediments have been observed flowing down a thermoerosion valley and dis- charging into the Olenekskaya branch during summer 2008 (Supplement 2). When ice dams break up, water carrying particulate material flows down thermoerosion valleys and enters the delta branches. Increases in summer precipitation are often responsible for increased summer discharge (Kane et al., 2003). In a thermokarst landscape, such increases may also be due to catastrophic lake drainage following an ice jam.
Possible mechanisms underlying the observed increase of water and sediment discharge within the Lena Delta include neotectonic (isostatic) processes (Bolshiyanov et al., 2013) that can cause an increase of the water surface altitude gradi- ent and, as a consequence, an increase of erosive power that exposes new sediment material to erosion. Such a hypothe- sis could be confirmed using geodesic benchmarks inside the delta, as well as by conducting additional branch water-level and sea-level measurements.
Any local decrease or increase of water and sediment discharge in the estuary zone is often constrained by the sea. However, our studies carried out in 2005 (Fedorova et al., 2007) and 2012 (Fedorova et al., 2013) in the Olenek-
Figure 11. River ice during a flood on the Olenekskaya branch (photo by M. Grigoriev).
skaya branch delta showed an absence of seawater influx 60 and 15 km deep into the branch; electroconductivity did not exceed 125 µS cm−1. In addition, neither salt water nor a change of water current direction at the Angardam branch cross-section was observed. The influx of sea water could certainly have an impact by changing the inclination of the branch water surface, but confirming this hypothesis will re- quire high-precision geodesic work.
The situation on the Bykovskaya branch is slightly differ- ent. In recent times, according to observation by the hydrom- eteorological network (at Muostakh and Bykovsky), the hy- drological regime of this branch has been estuarine with a prevalent marine influence. Roshydromet is currently con- sidering the possibility of reconfiguring the estuarine station with regard to the interface between river and sea, including additional measurements on Bykovsky Peninsula.
There are other possible explanations for the observed de- crease in discharge within the delta. River water may infil- trate into the talik below the river bed of the Lena Delta.
We have shown that water discharge from the estuarine areas of the measured branches decreases by orders of magnitude compared to the discharge of the middle delta. For example, flow in the Sardakhskaya branch decreased from more than 11 000 m3s−1near Gogolevsky Island (in the middle delta) to 11 m3s−1 at the branch outlet. Certainly runoff can de- crease due to flow branching or because of a rise in sea level, but the existence of such a large difference in discharge re- quires additional study. A hydraulic connection between flow in the river and flow in the talik beneath it is possible and could include outflow to the talik in summer and inflow to the river in winter. Similar variations in water salinity might be explained by the same mechanism (Zubakina, 1979). Bur- dyikina (1951) provides another explanation for interdeltaic discharge decrease: infiltration of spring flood water from the Lena River through the Lena–Anabar depression to the Olenek and Anabar River basins.
Figure 12. Long-term average annual discharge (blue line, right- hand axis) and the cumulative amount of average annual suspended sediments (red line, left-hand axis) over the period of instrumental observation. Dashed lines are trends of suspended sediments dis- charges for three periods with different annual water volumes (green tints).
4.2 Cyclicity of hydrological processes
Hydrological and river-bed processes in the Lena River delta are cyclic. Three large-scale periods characterized wa- ter flow fluctuations: low-water (1938–1957, Kav=0.93);
water-average (1958–1987,Kav=1.00); high-water (1988–
2006, Kav=1.06). Within the large-scale phases of flow fluctuations there are periods of heightened and low water content which have shorter duration. For instance, water av- erage period (1958–1987) includes three high-water, three low-water and four water-average phases of water content.
The relationship between long-term average annual water discharge and increasing average annual suspended sediment supply over the period of instrumental observations is shown in Fig. 12.
Inflection points in the plot of average monthly sediment discharge can indicate critical points (Fig. 5). In spite of the three large-scale periods characterized by water flow fluctu- ations with different Kav values, water content of the river cannot be, in our opinion, the main criterion for highlight- ing certain periods because many delta processes may impact fluvial deformations and rearrangements of the delta shape.
One can see from Fig. 12 that from 1977 to the middle of the 1980s a cycle existed that was characterized by low water volume and little fluvial deformation, as evidenced by sedi- ment discharge. From the mid-1980s to the mid-1990s river water content increased and fluvial processes were active.
Currently, with increased water content, the transport capac- ity of the Lena River delta has actually decreased slightly. Of course, a hydrological system does not immediately respond to changes in water volume or fluvial deformation; there is a certain lag time between change and effect.
Nevertheless, as has been mentioned above, at the begin- ning of the 1980s abrupt increases in Olenekskaya branch sediment runoff were observed. By the 1980s rapid increases had also occurred in the Trofimovskaya branch channel near Sardakh Island (Fig. 7). Trofim-Kumaga sands accumulated until 1973; in 1981 a process of active bottom erosion of
these sands began near Sardakh Island. Over the third interval (from the late 1990s until 2005) another decrease of fluvial process activity was observed, manifested by the gradual silt- ing up of the Trofimovskaya branch channel, decreasing the channel depth and increasing the channel width.
4.3 Geochemistry of the delta
An assessment (Chetverova et al., 2011) of the amount of dissolved substances upstream of the Lena River over the period from 1960 to 1987 produced averages of annual dis- solved substances at the outlet cross-section of the Lena River (Kyusyur). Results obtained by the authors are consis- tent with published assessments (Alekseevsky, 2007). Analy- sis of long-term dissolved substance runoff data has enabled conclusions to be drawn regarding the seasonal and long- term dynamics of Lena River runoff.
Analysis of the intra-annual variations of dissolved sub- stance runoff showed that levels are highest when the Lena River water volume is high. From 1960 to 1987 the Lena River ion transport decreased almost 3-fold. A decreasing tendency is observed for all major ions, except for magne- sium. The flux of calcium decreased by 54 %, sodium and potassium by 43 %, hydrocarbons by 44 %, sulphates by 7 %, and chlorides by 30 %. A decreased flux for nutrients was also observed, including a 2.2-fold decrease for nitrates and a 7 % decrease for phosphates, and more than a 2-fold de- crease for silicon; in contrast, a 9-fold increase of iron was observed.
Geochemical processes in the delta are closely connected with the amount of river discharge and changes in that dis- charge due to division of the channel into smaller branches.
This process is the basis of the postulated mechanism of a marginal filter that has been developed by Lisitzin (1988).
However, a quantitative discussion of these linkages is lack- ing due to insufficient study of the delta watercourses. For river systems upstream from the delta, this question is be- ing answered on the basis of linking runoff characteristics to stream order, as determined within the conceptual framework advanced by Horton (1945). The concept of conventional or- ders, proposed by Alekseevsky and Chalov (2009), quantifies stream order within the delta. As the main branch in the delta divides into smaller and smaller watercourses, all other char- acteristics of river discharge change, including the ability of the water to transport dissolved substances including ions, trace elements, and nutrients.
Dissolved and suspended chemical compounds and ele- ment concentrations vary spatially between the delta apex and the coastline. Major dissolved elements and most ele- ments of suspended material are transported through the delta without significant concentration changes at the branch bi- furcations, as shown by the small concentration ranges ob- served in suspended material from differently sized branches.
Some dissolved nutrient and trace element concentrations changed at channel bifurcations. Concentrations of nitrites