Inaugural-Dissertation
zur
Erlangung der Doktorw¨ urde der
Naturwissenschaftlich-Mathematischen Gesamtfakult¨ at
der
Ruprecht-Karls-Universit¨ at Heidelberg
vorgelegt von
Dipl.-Phys. Wolfgang Gradl aus Heidelberg
Tag der m¨undlichen Pr¨ufung: 18. Juli 2001
Das Auslesesystem des Inneren Spurkammersystems des HERA-B Detektors
und
Drell-Yan Physik mit dem HERA-B Detektor
Gutachter: Prof. Dr. Franz Eisele Prof. Dr. Johanna Stachel
Dissertation submitted to the
Combined Faculties for the Natural Sciences and for Mathematics of the Rupertus Carola University of
Heidelberg, Germany for the degree of Doctor of Natural Sciences
The Readout System of the HERA-B Inner Tracker and
Prospects of HERA-B in the Field of Drell-Yan Physics
presented by
Diplom-Physicist Wolfgang Gradl Born in Heidelberg
Heidelberg, July 18th, 2001
Referees: Prof. Dr. Franz Eisele Prof. Dr. Johanna Stachel
Abstract
The HERA-B experiment at the HERA accelerator at DESY is designed and built to measure CP violation in the system of neutral B mesons. One sub-detector is the Inner Tracker, which is built of Micro-Strip Gas Chambers with Gas Electron Multiplier (GEM-MSGC) with about 120 000 readout channels.
Using results of test beam experiments, the readout system of the Inner Tracker was finalised in its design. At HERA-B, it was extended from small test installations to the full system during the installation 1999/2000. The software needed for the processing of the raw data was developed. This thesis describes the readout hardware and software in use at HERA-B and the steps needed for commissioning. Results from the first year of running at HERA-B are reported.
In a second part of this thesis, the prospects of HERA-B to contribute to the field of Drell-Yan physics are evaluated, where significant deviations from the predictions of perturbative QCD were observed. Starting from an analysis of the di-muon triggered data of the run period 2000, the expected number of high-mass muon pairs produced by the Drell-Yan process is extrapolated. With a conservative estimate of the outcome of the detector and trigger improvements, about 26 000 high-mass Drell-Yan pairs are expected for the run period 2002. Although the measurement will be difficult due to the low number of events at higher transverse momentum, this will allow a first measurement of the angular distributions of Drell-Yan pairs produced inpNcollisions.
Zusammenfassung
Das Experiment HERA-B am Speicherring HERA ist geplant worden, um die Ver- letzung der CP Symmetrie im System der neutralen B-Mesonen zu messen. Eine der Hauptkomponenten des Detektors ist das Innere Spurkammersystem, das aus Mikrostreifen-Gasz¨ahlern mit einer GEM-Folie (GEM-MSGC) aufgebaut ist. Das Innere Spurkammersystem hat ungef¨ahr 120 000 analoge Auslesekan¨ale.
Das Design des Auslesesystems f¨ur die Inneren Spurkammern wurde nach ausf¨uhrli- chen Systemtests festgelegt. Bei HERA-Bwurde das Auslesesystem im Laufe der Jah- re 1999/2000 von kleinen Testinstallationen zum vollst¨andigen System f¨ur die gesam- ten Inneren Spurkammern ausgebaut und erfolgreich in Betrieb genommen. Ebenso wurde die zum Aufbereiten der Rohdaten ben¨otigte Software wurde entwickelt. Diese Arbeit beschreibt Hard- und Software des bei HERA-B eingesetzten Auslesesystems und die zur Inbetriebnahme n¨otigen Tests. Ergebnisse aus dem ersten Betriebsjahr werden berichtet.
In einem zweiten Teil werden die Aussichten von HERA-B untersucht, einen Beitrag zum Feld der Drell-Yan Physik zu leisten. Hier wurden in fr¨uheren Experimenten signifikante Abweichungen von den Vorhersagen der perturbativen QCD festgestellt.
Ausgehend von einer Analyse der im Jahr 2000 aufgenommenen Di-Myon Daten wird die erwartete Zahl von Drell-Yan Myon-Paaren f¨ur das Betriebsjahr 2002 abgesch¨atzt;
mit konservativen Annahmen ¨uber den Zustand des Detektors nach dem Lumino- sit¨ats-Upgrade von HERA werden etwa 26 000 Myon-Paare mit hohen invarianten Massen erwartet. Nur eine geringe Zahl von Ereignissen in diesem Massenbereich wird auch einen großen Transversalimpuls haben. Dennoch wird eine erste signifikan- te Messung der Winkelverteilung der in pN-Kollisionen erzeugten Drell-Yan Paare m¨oglich sein.
ii
Contents
Introduction 1
1 The Experiment HERA-B 3
1.1 The HERA Storage Ring . . . 3
1.2 Physics Goals of HERA-B . . . 4
1.2.1 Generation ofCP Violation in the Standard Model . . . 5
1.2.2 Physics with B Mesons and CP Violation inB Decays . . . 8
1.2.3 Proposed Physics Programme for 2002 . . . 9
1.3 Overview over the Detector . . . 10
1.4 Trigger . . . 15
1.4.1 Pretriggers . . . 15
1.4.2 First Level Trigger . . . 15
1.4.3 Second and Third Level Trigger . . . 17
1.4.4 Fourth Level Trigger . . . 17
1.5 Data Acquisition System . . . 18
I Readout for the Inner Tracker of HERA-B 21 2 The Inner Tracker of HERA-B 23 2.1 Requirements . . . 23
2.2 Detector Technology . . . 24
2.2.1 Operation Principle . . . 25
2.2.2 Construction of the HERA-B GEM-MSGC . . . 26
2.3 Building a Tracking Device with GEM-MSGCs . . . 29
2.4 Chamber Operation and Infrastructure . . . 32
3 Readout for the Inner Tracker 35 3.1 Readout Chain and Data Flow . . . 35
3.2 Front End Chip: Helix128S . . . 36
3.2.1 Input Stage . . . 36
3.2.2 Comparators . . . 37
3.2.3 Pipeline . . . 39
3.2.4 Readout Cycle . . . 39
3.2.5 Multi-Event Buffer and Dead Time . . . 39
3.2.6 Testpulse Circuit . . . 40
3.2.7 Programmable Parameters . . . 41
3.2.8 Helix PCB . . . 42
3.2.9 Helix Versions Used . . . 45
iv CONTENTS
3.3 FED System . . . 46
3.4 Additional Electronics . . . 48
3.4.1 Data Valid Board . . . 49
3.4.2 Digital Control Signals . . . 50
3.4.3 Helix Register Loading . . . 50
3.4.4 Signal Distribution Board . . . 51
3.4.5 Analogue Data Transmission . . . 51
3.4.6 Setup in the Electronics Trailer . . . 52
3.5 Grounding Scheme . . . 53
3.6 Readout Software . . . 55
3.6.1 Data Format . . . 55
3.6.2 Pedestal and Noise Following . . . 55
3.6.3 Cluster Finder . . . 59
3.6.4 Online Sparsification . . . 61
3.6.5 Configuration and Setup Database . . . 63
3.6.6 Online Monitoring . . . 64
4 Commissioning of the ITR Readout System 67 4.1 Preparatory Beam Tests . . . 67
4.2 Installation in HERA-B . . . 68
4.2.1 Cabling Cross-checks . . . 68
4.3 Timing and Synchronisation . . . 69
4.4 Optimisation of Pulse Shaping . . . 70
4.5 Operation Experience and Performance . . . 77
4.5.1 Variation of Analogue Gain . . . 77
4.5.2 Time Stability of Noise and Pedestal Estimates . . . 79
4.5.3 Stability of Readout System . . . 79
4.5.4 Noise Behaviour . . . 82
4.5.5 Chamber Occupancies . . . 84
4.5.6 Chamber Performance . . . 87
4.5.7 Chamber Efficiency . . . 91
4.6 Simulation of Pulse Shapes . . . 98
4.6.1 Time Evolution of the Chamber Signals . . . 98
4.6.2 Results of the Simulation . . . 101
4.7 Summary and Outlook . . . 104
II Drell-Yan Physics at HERA-B: A Feasibility Study 105 5 The Drell-Yan Process 107 5.1 Perturbative QCD Predictions . . . 107
5.2 Angular Distributions and the Lam-Tung Relation . . . 110
5.2.1 Violation of the Lam-Tung Relation . . . 110
5.2.2 Theoretical Models . . . 111
5.2.3 Concluding Remarks . . . 114
5.3 DY as Surrogate for Prompt Photon Production . . . 114
CONTENTS v 6 Prospects of doing Drell-Yan Physics at HERA-B 119
6.1 Geometrical Acceptance . . . 119
6.1.1 Detector Resolution and Acceptance Correction . . . 124
6.2 Background . . . 124
6.2.1 Sources of Background . . . 125
6.2.2 Reducing the Background . . . 128
6.3 Expected Event Rate . . . 130
6.3.1 J/ψ Search in 2000 Data . . . 130
6.3.2 Expected Improvements and Impact onJ/ψ Rate . . . 137
6.3.3 Expected Drell-Yan Rate in 2002 . . . 139
6.4 Measuring the Angular Distribution . . . 139
6.4.1 Expected Shape of the Angular Distributions . . . 140
6.4.2 Direct Fit . . . 140
6.4.3 Method of Moments . . . 142
6.5 Summary . . . 144
7 Summary and Conclusions 147 A Readout Setup 149 A.1 Location of Readout Electronics . . . 149
A.2 Configuration of the FED Controller . . . 151
B Organisation of the ITR Software 153 B.1 Software Packages for Data Processing . . . 153
B.2 Organisation on Disk . . . 154
B.3 Programs running online . . . 154
C Total Gain of the Analogue Readout Chain 157 D Kinematics of the Drell-Yan Process 159 D.1 Kinematical Variables . . . 159
D.2 Reference Frames . . . 160
Bibliography 168
Acknowledgements 169
Introduction
Symmetries are one of the fundamental principles of nature. By identifying the symmetries of a system, many of its physical properties can be discovered. Continuous symmetries are always linked to conserved currents of a certain quantity (Noether’s theorem); for example, symmetry under time and space translation is linked with the conservation of energy and momentum.
A different kind of symmetries are the discrete symmetries time reversal T, charge conjuga- tionC, and parity (space inversion)P. It was long believed that the physical laws governing the interaction of elementary particles are also symmetric under each of these three operations. In 1957, it was experimentally shown that the weak interaction violates bothC and P maximally [WAH+57]. The combined symmetryCP was then thought to be a good symmetry for the weak interaction, untilCP violation was found in the system of neutralK mesons in 1964 [CCFT64].
In theK system, the effect of CP violation is very small; the asymmetry of decay probabilities which shows CP violation is of the order O(10−3). In analogy to the K system, the standard model predicts CP violation in the system of neutral Bd mesons; the expected asymmetry is large.
To search for the violation ofCP symmetry in the system of neutral B-mesons, a number of new, dedicated experiments forBphysics have been planned and built: BaBar (SLAC) and Belle (KEK) are situated at asymmetric electron-positron colliders, where theB0mesons are produced by the decay of the Υ(4S) resonance. They reported first measurements in 2000. HERA-B, which is currently being commissioned at DESY in Hamburg, is a fixed-targed experiment using the proton beam of the HERA storage ring impinging on thin wire targets. Here, alsoBs-mesons are produced and accessible for measurements. The experiment of the next generation is planned at the Large Hadron Collider (LHC) at CERN, which will start operation in the middle of this decade. There, LHCb is dedicated to studyCP violation in the Bd and theBs systems; it will allow high precision measurements of theCP violating parameters.
To produce enoughB0s at HERA-B to measure theCP violation within about one year, a large interaction rate of up to 40 MHz is needed, which results in very high particle fluxes and track densities. The high radiation load poses strict requirements on the radiation tolerance of the detectors and readout electronics used. One of the main components of HERA-B is the Inner Tracker, which was developed and built by the Universities of Heidelberg, Siegen, and Z¨urich. The Inner Tracker measures tracks 6 – 25 cm away from the beam centre. It consists of 184 Micro-Strip Gas Chambers with Gas Electron Multipliers (GEM-MSGC) and contains in total about 120 000 analogue readout channels.
The first part of this thesis describes the readout system of the Inner Tracker. The design of the readout system was finalised based on the experience gained during several test beam experiments in 1998. In parallel to the installation of tracking chambers in HERA-B during autumn 1999 and spring 2000, the readout system was extended from a small test installation to the full system. The steps necessary to commission the readout system are described, and an overview over the software packages processing the raw data is given. Results of the first year of running at HERA-B are presented.
2 Introduction In the second part, the results of a feasibility study concerning the prospects of HERA-B to contribute to the field of Drell-Yan physics are presented. Drell-Yan production is considered as one of the possible topics of the physics programme for HERA-B besidesCP violation. The number of expected Drell-Yan events is estimated based on a measurement using the data of the run 2000 and an extrapolation about the detector performance after the upgrade during 2000/2001.
Chapter 1
The Experiment HERA-B
This chapter presents a brief overview over the experiment HERA-B. The original physics goal—
measuring theCP violating parameter sin 2β in the system of neutralB mesons—for which the experiment was proposed and designed is outlined, as well as the modified physics programme intended for the run period 2001/2002. Finally, the components of the HERA-B detector are explained.
1.1 The HERA Storage Ring
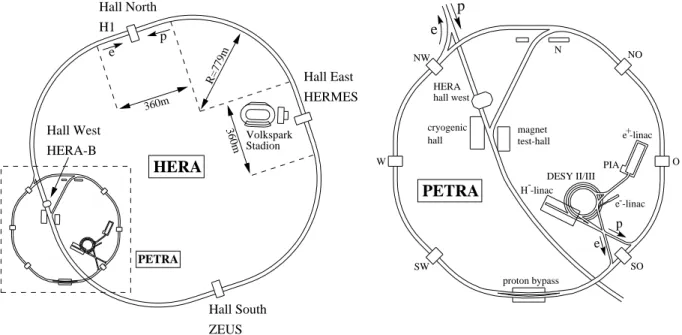
HERA-Bis one of four high energy experiments which are located at the storage ring HERA1at DESY2 in Hamburg. HERA is the world’s only lepton-proton collider. The electrons3 have an energy of 27.5 GeV, and the protons an energy of 920 GeV. The storage ring has a circumference of 6.3 km and is located in the North-West of Hamburg, partly beneath the Volkspark. It is depicted schematically in Fig. 1.1, together with the cascade of pre-accelerators.
The two beams are brought to collision in two interaction zones (Hall North and Hall South), where the experiments H1 and ZEUS are situated. Their physics programme comprises the measurement of the proton structure with a resolution varying over more than five orders of magnitude, reaching partons with momentum fractions down to 10−6. Studies of the hadronic final state include jet physics, diffractive scattering in deep inelastic scattering, and the photo- production of jets.
The experiment HERMES, which is located in the East experimental area, uses only the electron beam, which is longitudinally polarised for the experiment by means of spin rotators.
Using an internal polarised gas target, HERMES investigates the spin structure of the nucleon.
Finally, HERA-B is located in the West experimental area. It uses the protons in the outer regions of the proton beam, which are brought to collision with thin wires. With this target in the halo of the proton beam, high interaction rates are possible without disturbing the operation of the other experiments. The physics programme of HERA-B and the detector are described in more detail below.
1Hadron-Elektron-Ring-Anlage
2DeutschesElektronen-Synchrotron
3or positron; both options were used several times so far. However, with positrons the lepton beam is much more stable and can reach higher currents, providing better running conditions and higher luminosities for the collider experiments. In the following, ‘electron beam’ and ‘positron beam’ are used interchangeably.
4 1 The Experiment HERA-B
Hall North H1
Hall East HERMES
Hall South ZEUS
HERA
HERA hall west
PETRA
cryogenic
Hall West hall
HERA-B
magnet test-hall
DESY II/III PIA
e -linac+
e -linac- H -linac-
NW N NO
O
SO SW
W
proton bypass
p e e
p
Volkspark Stadion 360m
360m R=779m
e p
PETRA
Figure 1.1: The HERA storage ring at DESY in Hamburg. Left: overview over the complete facility, which extends below the Volkspark. Right: the pre-accelerators DESY-II and PETRA which are situated on the DESY site, and the experimental area Hall West, where HERA-B is installed.
1.2 Physics Goals of HERA- B
The experiment HERA-B was proposed and designed to measure the violation of theCP sym- metry in the system of B0/ ¯B0-mesons. The violation ofCP symmetry was first observed in the system of K0– ¯K0 mesons [CCFT64], and the standard model of high-energy physics offers a mechanism which can explain the violation. Also the system of neutralB mesons should show CP violation, caused by the same mechanism. While the effect is exceedingly small in the kaon system, it is predicted to be large in the B-system.
A series of experiments was planned and built in the past few years to measureCP violation in theB-system: the first generation of ‘B-factories’ BELLE ([BEL01], at KEK, Japan) and BaBar ([BAB01], at PEP-II, SLAC, USA) are built at asymmetrice+e−colliders whose centre-of-mass energy is near the Υ(4S) resonance. The small production cross section (σe+e−→Υ(4S) ≈1 nb) is offset by luminosities of L ≈ 3×1033 cm−2s−1. Both BaBar and BELLE reported first measurements on CP violation in the B-system in summer 2000 (see below).
A different approach to produce the neededBmesons to measureCP violation is pursued by HERA-B. Here the b¯b are produced in proton-nucleon collisions at a centre-of-mass energy of about√
s= 41.6 GeV. Due to many problems during the development and commissioning of the detector, the start of HERA-B data taking was delayed by several years. Most of the detector problems could be solved in the meantime. Nevertheless, a significant contribution to this field cannot be expected from HERA-B at least during the run period 2001/2002. However, the intended physics programme imposed stringent demands on the detector design; it is therefore briefly explained in this section. An alternative physics programme for the run period 2001/2002 was proposed in December 2000. Its aim is to prove that the complete detector, including the First Level Trigger, is capable of doing valuable physics, while only setting goals which are realistically achievable.
1.2 Physics Goals of HERA-B 5 1.2.1 Generation of CP Violation in the Standard Model
The three fundamental discrete symmetries in the standard model are Charge Conjugation (C, particles are replaced by their antiparticles)Parity(P,Space Inversion), andTime Reversal (T).
TheCPT theorem [Lue57] states that any local, causal, relativistic field theory is invariant under the combined application ofC,P, andT. The weak interaction violates bothCandP maximally.
CP violation is another special feature of the weak interaction; both the electromagnetic and the strong interaction conserve each of the two symmetries separately. The generation of CP violation in the standard model is described in great detaile.g. in [har98] and [G+00].
CKM Matrix. The eigenstates of the weak interaction of quarks do not coincide with the mass eigenstates; the transition between the two bases is described by the Cabibbo-Kobayashi- Maskawa matrixVCKM:
VCKM=
Vud Vus Vub Vcd Vcs Vcb Vtd Vts Vtb
(1.1)
This mixing betwee the quarks implies thate.g. the decay of ansquark into anuquark involves the matrix element Vus (see Fig. 1.2). To conserve probability, VCKM must be unitary if only three generations of quarks exist.
i j
W±
Vij Figure 1.2: Weak interaction of two quarks i and j, taking into account the quark mixing described by the CKM matrix
The constraint of unitarity implies that the CKM matrix can be described using only four parameters; these could be three angles θi and one complex phase δ. However, nature ex- hibits a hierarchy in the mixing between the quark families, and most of the mixing angles are small; this is used to parametriseVCKM using the real parameters λ, A, ρ, and η (Wolfenstein parametrisation, [Wol83]):
VCKM≈
1−λ2/2 λ Aλ3(ρ−iη)
−λ 1−λ2/2 Aλ2 Aλ3(1−ρ−iη) −Aλ2 1
(1.2)
whereλ= sinθCabibbo ≈0.22. Using the unitarity condition, relations between the parameters can be obtained, for example
VudVub∗ +VcdVcb∗ +VtdVtb∗ = 0 (1.3) or approximately
Vub∗ +Vtd=λ Vcb∗ . (1.4)
Using the Wolfenstein parametrisation, this relation can be visualised in the complex (ρ, η)- plane as a triangle (the ‘unitarity triangle’, see Fig. 1.3). The angleβ is connected to the CKM matrix elements by
sin 2β = Im
VtdVtb∗ Vtd∗ Vtb
. (1.5)
The current knowledge (as of end of 2000) about the parameters ¯ρ = ρ(1 −λ2/2) and ¯η = η(1−λ2/2) is shown in Fig. 1.4 (from [CDF+00]).
6 1 The Experiment HERA-B
B0 J/ψ Ks λVcb
V*ub α
β γ
-1 1
0
0 1
ππ, ρπ B
B B
λV V
0 0
cb td
ρ sK
η
K
ρ
Bs s 0, D
0
Figure 1.3: Unitarity triangle in the complex (ρ, η)-plane. It is a visualisation of one of the unitarity relations; if its area is non-zero,CPis violated. Also indicated in the figure are different physics channels which can be used to measure constraints for the angles or sides of the triangle (figure from [Hau98]).
0 0.2 0.4 0.6 0.8 1
-1 -0.8 -0.6 -0.4 -0.2 0 0.2 0.4 0.6 0.8 1 εK
∆md
∆ms/∆md
|Vub|
|Vcb|
ρ
_η
_∆ms 95% limit sensitiv.
Figure 1.4: Knowledge as of end of 2000 about the unitarity triangle (from [CDF+00]): the contours show the allowed regions for ¯ρand ¯η at 68 %, 95 %, 99 %, and 99.5 %.
1.2 Physics Goals of HERA-B 7 Mixing in theB System. Like in theKsystem, the neutralBmesons can mix via diagrams like the box diagrams depicted in Fig. 1.5. Therefore, the two weak eigenstates B0
and B¯0 will mix to give two statesBH,L0 :
BH,L0
≡pB0
∓q B¯0
(1.6) where p and q satisfy the normalisation condition |p|2+|q|2 = 1. The two states BH and BL
are those which travel through the detector. They are no longer degenerate, but have slightly different masses by ∆mB≡mH−mL and decay widths ΓH, ΓL. The mass difference has been measured for the neutralBd mesons to be [G+00]
xd ≡ ∆mBd
ΓBd = 0.73±0.03 ; the lifetime difference ∆ΓBd is expected to very small.
An initially pure B0
state which is created at time t = 0 e.g. by a strong interaction propagates through the vacuum as a physical state B0physE
which has the time evolution Bphys0 (t)
=e−iM te−Γt/2 cos(∆mBt/2)B0 +q
pe−iM te−Γt/2isin(∆mBt/2)B¯0
, (1.7) at a timet >0 it therefore has a non-zero probability to be a B¯0
.
CP Violation by Interference. With a complex phase present in the CKM matrix, CP violation can be generated if two decay amplitudes interfere which contain complex conjugates of the same CKM matrix element. This condition is fulfilled in the mixing ofB0with ¯B0mesons, which is mediated by intermediate weak reaction (see Fig. 1.5). If both B0 and ¯B0 can decay into the same final state fCP which is a CP eigenstate, the decay of a B0 can therefore either take place directly, B0 → fCP, or the B0 can first oscillate into a ¯B0, B0 → B¯0 → fCP. The amplitudes for the two processes interfere. If a complex matrix element ofVCKM occurs in the mixing, the two decay rates are not the same, andCP is violated. This type of CP violation is calledCP violation in the interference between decays with and without mixing [har98].
t
W W
¯t
d B0
¯b
b B¯0 d¯
Vtd Vtb∗ Vtd Vtb∗
t W W
¯t d
B0
¯b
b B¯0 d¯
Vtd
Vtb∗ Vtd
Vtb∗
Figure 1.5: Lowest order Feynman diagrams describing the mixing ofB0↔B¯0. The main contribution to the loops comes fromt,¯tquarks.
This can be observed by comparing the decay rates into final CP eigenstates of a time- evolving B state that begins at time t= 0 as aB0 to those of the state that begin as a ¯B0:
afCP = Γ(Bphys0 (t)→fCP)−Γ( ¯Bphys0 (t)→fCP) Γ(Bphys0 (t)→fCP) + Γ( ¯Bphys0 (t)→fCP)
= (1− |λfCP|2) cos ∆mBt−2ImλfCP sin ∆mBt
1 +|λfCP|2 . (1.8)
8 1 The Experiment HERA-B Here, λfCP is the parameter which decided if CP is violated. It is defined as the ratio of the decay amplitudes into the final state fCP,
λfCP ≡ q p
hfCP|HB¯0
hfCP|H|B0i . (1.9)
The ‘cleanest’ decay modes are those where oneCP violating phase dominates; for these modes, the hadronic uncertainties inλcancel.
1.2.2 Physics with B Mesons and CP Violation in B Decays
The Gold-Plated Decay. The favoured decay mode of theB0/B¯0 in whichCP violation can be measured is the so-called gold-plated decay
B0 →J/ψ Ks0 .
It has the advantage that the decay proceeds dominantly through the tree diagram shown in Fig. 1.6. Other diagrams involving W-loops (‘penguin’ diagrams) are very difficult to calculate;
they are however doubly suppressed and can be neglected for this decay mode. Besides being
‘gold-plated’ theoretically, this decay channel has a clean experimental signature.
d
¯b
d
¯ s c
¯ c
d
¯b
d
¯ c c
¯ s
Figure 1.6: Tree level (left) and ‘QCD penguin’ diagram (right) for the ‘gold-plated’ decayB0→J/ψ Ks0. Compared to the tree level diagram, the QCD and electroweak penguin diagrams are strongly suppressed for this special decay mode.
The measurement consists in counting how many B0 and how many ¯B0 decay into the CP eigenstate J/ψ Ks0. The resulting asymmetry a(t) is connected to the angle β of the unitarity triangle like this:
a(t)≡ N( ¯B0 →J/ψ Ks0)−N(B0 →J/ψ Ks0)
N( ¯B0 →J/ψ Ks0) +N(B0 →J/ψ Ks0) = sin 2β sin ∆mbt . (1.10) Besides reconstructing the decay of theB, it is also needed to determine whether a B0 or a ¯B0 has decayed. This can be done by tagging the other B meson which contains the other produced b quark. Its flavour is determined by the charge of a lepton or kaon produced in its decay (see Fig. 1.7).
Recently, both BaBar and Belle reported first mesurements of sin 2β using the gold-plated decay. Their results are
sin 2β = 0.34±0.20 (stat)±0.05(syst) BaBar, [A+01b]
sin 2β = 0.58+0.32−0.34(stat)+0.09−0.10(syst) Belle, [A+01a]
1.2 Physics Goals of HERA-B 9
Signal B
Tagging B
B (120 GeV)0
920 GeV p
Kaon tag (P = 0.24) lepton tag (P=0.17)
B
D0 e ,- µ-
K- µ ,+ e (34 GeV)+
µ ,-e-
π+ (15 GeV) π- K0s
- 10 mm
1.1 m
vertex charge tag (P = 0.16)
Figure 1.7: The ‘gold-plated’ decay mode B0 →J/ψ Ks0 →µ+µ−π+π−. The flavour of the B meson decaying into J/ψ Ks0 (top) is measured by tagging the otherB (bottom), using its decay into a lepton (lepton tag) or a kaon (Kaon tag). The decay lengths and momenta indicated in the figure are valid for the conditions at HERA-B.
The experimental challenge to measure sin 2β in the gold-plated decay at HERA-B consists in the vast difference between the expected rate of events with B → J/ψ Ks0 to all produced events. With a beam momentum of 920 GeV, the total inelastic cross section for proton- nucleon scattering is of the order of 13 mb/nucleon, while the production cross section of a b¯b pair is only about 10–20 nb/nucleon. Additionally, the produced B mesons have many decay channels; the branching ratio into the gold-plated decay mode is only BR(B0 → J/ψ Ks0) = 8.9×10⁻⁴ [G+00]. Together with the branching ratio BR(J/ψ → µµ) = 0.059 and trigger and reconstruction efficiencies, about 1011 interactions result in one triggered, reconstructed gold- plated decay written to tape. For a significant measurement of sin 2β, about 2 000 events are needed; if these are to be collected within one year of running, this implies a mean interaction rate of about 40 MHz.
Bs mixing and Rare Decays. Other possible topics for HERA-B in the field of B physics are the measurement of mixing in theBs system, and rare decays of b-flavoured mesons.
1.2.3 Proposed Physics Programme for 2002
The proposed physics programme for the run 2002 is documented in an [HER01]. It concentrates on the physics feasible with an experiment which is optimised for the detection of lepton pairs with high transverse momentum, but where the expected trigger rates are not high enough to be competitive in the field ofB physics.
The physics programme comprises the measurement of nuclear effects in charmonium sup- pression and the determination of theb¯bproduction cross section in proton-nucleon collisions at
√s≈41 GeV.
Other topics which were investigated for inclusion into the physics programme were open charm production, prompt photon production and measurements in the field of Drell-Yan physics. The prospects of HERA-B in the latter field were investigated during the work on this thesis. The results of this study are presented in Part II of this thesis.
10 1 The Experiment HERA-B Charmonium Suppression. The A-dependent suppression of charmonium production is of considerable interest. In heavy ion collisions, the relative suppression ofJ/ψ production relative to the production of Drell-Yan pairs or open charm is generally believed to be a tell-tale sign of the formation of a quark-gluon plasma. Such a suppression has been observed by NA50 in central lead-lead collisions (see for example [A+00]). However, charmonium production in heavy-ion collisions is far from being well understood; the different theoretical models lack basic experimental input and give vastly differing predictions.
The existing measurements mainly cover the phase space region withxF >0, while HERA-B covers the range of−0.4< xF <0.3, extending the range where model predictions can be tested.
The possibility to measure simultaneously the production of J/ψ, ψ0, χc1,2, and even Υ allows the determination ofrelative suppression factors which are almost completely free of systematic effects.
Measurement of the b¯b Cross Section. The production cross section σb¯b at √
s= 41 GeV is known only to about one order of magnitude. The measurement of σb¯b at HERA-B will most likely proceed using the inclusive decay B → J/ψ X, identifying the J/ψ from B decays with a detached secondary vertex. The cross section can then be obtained by scaling the ratio NB→J/ψ X/Nprompt J/ψ with the cross section for promptJ/ψproduction. This is expected to give a measurement which is accurate to about 20 %, the error being dominated by the uncertainty on σJ/ψ.
Apart from being an interesting measurement in itself, constraining perturbative QCD cal- culations for the production of heavy quarks, knowledge about σb¯b is essential to assess the prospects of HERA-B to pursue a programme inB physics after 2002.
1.3 Overview over the Detector
A schematic overview of HERA-B is shown in Fig. 1.8. The experiment is a typical forward spectrometer with a multi-wire target followed by a Vertex Detector. The spectrometer consists of a warm dipole magnet with a field integral ofR
Bdl≈2.2 Tm and a series of tracking stations in front, behind and inside the magnet. Particle identification is provided by a Ring Imaging Cerenkov Counter (RICH), an Electromagnetic Calorimeter (ECAL) and a Muon Detector Sys-ˇ tem. The complete detector had to fit into the existing West hall of HERA, posing a length limit of about 20 m to the experiment.
The coordinate system used throughout this thesis has its origin at the target system. Thez axis is along the direction of the proton beam, the yaxis points upwards, and the xaxis points to the centre of the HERA ring.
Target. The internal wire target consists of two stations with four wires each. The wires can be moved into the halo or the outmost regions of HERA’s proton beam. This allows to choose the desired interaction rate within a wide range. The interaction rate is measured by a set of scintillator hodoscopes which are mounted at the exit window of the RICH. The target position relative to the beam is actively controlled to obtain a fixed interaction rate.
The measurement ofCP violation within a reasonable time requires interaction rates as high as 40 MHz. To achieve this rate with the bunch structure of HERA’s proton beam which has a bunch spacing of 96 ns, multiple interactions have to occur during one bunch crossing. The reconstruction program should be able to separate the different interactions. This is achieved by using several (eventually all eight) target wires simultaneously. Charge integrators which monitor the interactions produced by each wire help to distribute the interaction rate evenly among the wires. During the run period 2000, the first target station was equipped with titanium wires,
1.3 Overview over the Detector 11
The HERA-B Experiment at DESY
Ring Imaging Cherenkov Counter 250 mrad
220 mrad
160 mrad
Magnet
Si-Strip Vertex Detector
Calorimeter TRD
Muon Detector
Target Wires
0 m 5
10 15
20
Photon Detector
Planar Mirrors
Top View
Side View
Proton Beam
Electron Beam
Proton Beam
Electron Beam
Spherical Mirrors
Vertex Vessel Inner / Outer Tracker
Beam Pipe
C4 F10
Figure 1.8: Schematic overview of the HERA-B experiment. The protons enter from the right. From right to left visible are the vertex vessel with the target wires and the Vertex Detector System, the spectrometer magnet with tracking chambers, and four layers of tracking chambers between the exit of the magnet and the RICH. Between RICH and the electromagnetic calorimeter, another two tracking layers are installed. The Muon System is located downstream of the ECAL, behind a shielding of iron and armoured concrete.
12 1 The Experiment HERA-B while the second station also contained wires made from aluminium, carbon, and tungsten. For the run period 2002 a similar setup is planned. The different target materials allow to measure nuclear effects in the production of e.g. charmonium. These measurements can be performed using two wires at the same time, drastically reducing the impact a possible change of the detector configuration has on the systematic error.
The target mechanics is mounted together with the Vertex Detector System into one vacuum vessel which is part of the primary vacuum of the proton beam.
Spectrometer
Vertex Detector System. The Vertex Detector System (VDS) is built of 64 double-sided silicon micro-strip detectors which are arranged in eight super-layers. The detectors have a readout pitch of 50µm. A system of manipulators and vacuum bellows (roman pots) allows to retract the detectors while the beam is injected, and to move the detectors in their measuring position once stable beam conditions have been reached. In its nominal position, about 10 mm away from the beam core, the detector can measure tracks with polar angles from 10–250 mrad.
The track information measured in the VDS is used to reconstruct the primary interaction vertices as well as detached secondary vertices from decays likeB →J/ψKs0 orKs0 →ππ. The secondary vertex resolution obtained during the run 2000 are σx ≈70µm perpendicular to the beam and σz ≈700µm along the beam direction.
2 3 4
5
Al-cap secondary Vacuum
1
exit flange
UHV-Balg
2 double-sided primary
(not to measure)
p p
Target- system
pot number
z x
Vacuum Si-detectors
beampipe
-6 -5
-4 -3
-2 -1
0
-0.4 -0.3 -0.2 -0.1 0 0.1 0.2 0.3 0.4 -0.2 -0.1 0 0.1 0.2 0.3 0.4 0.5 0.6
z [cm]
x [cm]
y[cm]
Figure 1.9: Left: Schematic view of the Vertex Vessel. Right: Primary vertices reconstructed with the VDS during a multi-wire run which used all eight target wires. Dimensions in cm (figures from [Mas00]).
Spectrometer Magnet. The spectrometer magnet is a warm (non-superconducting) dipole magnet with a field integral of 2.2 Tm. The magnetic field is parallel to the y axis, deflecting charged particles crossing the magnet in the (xz) plane.
A system of three magnets upstream of HERA-Bcompensates the deflection the proton beam experiences while travelling through the spectrometer magnet; the electron beam which has also to pass through the magnet is protected by a specifically shaped pole face of the spectrometer magnet, a compensating coil and a series of shielding cylinders around the beam pipe.
1.3 Overview over the Detector 13 Tracking System. Along the beam axis, the stations of the tracking system are installed.
The track density is highest near the beam pipe and falls off approximately like 1/r2⊥ with transverse distance from the beam. To cope with the vastly different particle fluxes and the ensuing different requirements on spatial resolution, the tracking system is divided into two parts, the Inner and the Outer Tracker. The Inner Tracker uses GEM-MSGCs with an intrinsic resolution of about 100 µm; it covers the area up to r⊥ ≈25 cm. It is described in detail in Chapter 2.
With a small overlap to the Inner Tracker, the Outer Tracker covers the remaining acceptance up to polar angles ofθx≈250 mrad. It is built of honeycomb drift chambers with a cell size of 5 mm in the inner and 10 mm in the outer part. In both tracking systems, each tracking station is equipped with several layers of detectors; the counting wires are oriented perpendicular to the bending plane of the magnet. Some of these layers are additionally rotated by astereo angle of
±5◦, so that also the coordinate along the counting wire of a passing particle can be measured.
The hit resolution which was reached during the run 2000 is about 350µm perpendicular to the wire [HER00b].
High-pTSystem. The high-pT system consists of three super-layers of tracking chambers which are placed inside the spectrometer magnet. In its inner part, it is made of gas pixel chambers, while tho outer part consists of straw tube drift chambers with cathode pad readout.
Using the segmentation inx and y, the high-pT system looks for tracks with a high transverse momentum and signals them to the First Level Trigger.
Particle Identification
A series of detectors serves to identify particles. This is needed for most of the physics studies intended for HERA-B; for example, tagging the secondBin the golden decay with high efficiency requires an excellent separation ofπ and K.
Ring Imaging ˇCerenkov Counter. The Ring Imaging ˇCerenkov Counter (RICH) exploits the ˇCerenkov radiation to distinguish between different particle types: a particle passing through a medium with refractive index n emits photons if its velocity βc is larger than the speed of lightc/n. The photons are emitted on a cone around the path of the particle; the opening angle θC of the cone depends on nand β:
cosθC = 1/(βn) .
The photons are focused by a spherical mirror to a ring whose radius depends on θC. If the particle’s momentum p = mβ/p
1−β2 is known, e.g. measured by the tracking system, the information about the ˇCerenkov angle allows to distinguish between particles of different masses m. To a good approximation, for each particle type the relation betweenθ2C and 1/p2 is linear.
The HERA-B RICH uses perfluoro-butane (C4F10) as a radiator; this gas has a refractive index ofn−1≈3×10⁻³, leading to a ˇCerenkov angle ofθC = 51.5 mrad for particles with the velocity β = 1. The ˇCerenkov light is read out by photomultiplier tubes.
Electromagnetic Calorimeter. The Electromagnetic Calorimeter (ECAL) is a sampling calorimeter of the ‘shashlik’ type: each cell consists of a sandwich of absorber and scintillator plates; the light output of the scintillator is collected by wavelength shifting fibres and guided parallel to the beam direction to photo-multipliers. The ECAL is segmented into an inner, a middle and an outer part, with cell sizes of 2.23×2.23 cm2, 5.58×5.58 cm2, and 11.15×11.15 cm2,
14 1 The Experiment HERA-B respectively. In the inner part, the absorber consists of a tungsten-nickel-iron alloy, while the middle and outer parts use lead. The total radiation length is about 20 – 22X0.
The ECAL measures the deposited energy and the position of electrons and photons with a fine granularity, providing information for many interesting physics channels, e.g. decays of J/ψ→e+e−. Information about clusters with high energy (and transverse energy) deposition is very quickly available and is used as one of the pretriggers. Additionally, the ECAL is used to distinguish electrons and photons from hadrons, providing particle identification for eandγ.
Muon System. To identify muonse.g. from decays J/ψ→µµ, a system of hadron absorbers and tracking chambers is installed downstream of the ECAL. The absorber consists of iron and armoured concrete; it is instrumented with four tracking super-layers of the Muon System. In total, the absorber has a thickness of about 20 interaction lengths. The innermost part of the Muon System is made of Gas Pixel Chambers with a cell size of about 9×9 mm2; they cover radial distances from 14 to 30 – 40 cm around the beam axis.
In the first two super-layers MU1 and MU2, the outer part consists of proportional wire chambers which are arranged in three stereo views of 0◦ and ±20◦. The last two super-layers, MU3 and MU4, are built of single layers of drift chambers (stereo angle 0◦) with cathode pad readout. The readout pads have a size of about 12×10 cm2. Since very little absorber material is placed between these two layers, pad coincidences can be used as a pretrigger signal.
Figure 1.10: Isometric drawing of the HERA-B detector.
1.4 Trigger 15
1.4 Trigger
It is not feasible to read out and record the complete detector data for every event; with 600 000 detector channels and a bunch crossing rate of 10 MHz this would amount to more than 6 Tbit/s.
The tiny ratio of interesting events (e.g. from B production) to all produced interactions pre- cludes a simple down-scaling of the trigger rate. Therefore, a highly selective event filter has to be used which suppresses most of the background events and keeps the interesting ones with high efficiency. Rejection factors of the orderO(105) have to be reached. This is the task of the trigger system.
The trigger design of HERA-B forsees a multi-stage trigger scheme. According to the main physics goal at the time of design, already at the first trigger level a pair of lepton candidates is searched which point back to the target region. The description given here reflects the intended mode of operation for the run period 2002; during the run 2000, not all components of the trigger chain could be used as designed.
1.4.1 Pretriggers
Three pretrigger systems provide fast information on track candidates, which is then passed to the FLT:
The ECAL pretrigger searches for clusters of 3×3 calorimeter cells where a local maximum of deposited energy can be found. Programmable thresholds can be applied to the cluster energy and the ratio of the energies deposited in the centre cell and its neighbours. The resulting centre-of-gravity of the cluster is then converted into a Region of Interest (RoI) for the First Level Trigger.
The high-pT pretrigger searches for coincidences in projective segments in the pad and pixel chambers of the three super-layers of the high-pT system. This pretrigger offers the possibility to trigger on non-leptonic decay modes ofB mesons, e.g. B0→π+π−, making a wide field of rare B decays and otherCP violating channels available.
The muon pretrigger uses the data from the cathode pads in the super-layers MU3 and MU4 of the Muon System. It requires coincident hits which form a track segment pointing back to the target region.
1.4.2 First Level Trigger
The First Level Trigger is a hardware trigger. It implements a discrete Kalman-filter algorithm to trace tracks through the detector. Starting from the pretrigger seeds given by the Muon System or the ECAL, the FLT extrapolates aregion of interest (RoI) into the next super-layer of the tracking system, using the assumption that the track originates from the target. If a coincidence of hits in all stereo-layers of the tracking station can be found within the RoI, a refined RoI is determined for the next tracking chamber. This procedure is shown schematically in Fig. 1.11.
If the FLT was able to successfully trace a track from the pretrigger seed to the exit of the spectrometer magnet, the Track Parameter Unit (TPU) computes an estimate for the momentum of the track. For each pair of trigger tracks, the invariant mass of the track pair is calculated. If the mass exceeds a threshold, the event is triggered. The decision whether to keep an event has to come within 12.2 µs = 128BX cycles, otherwise the event is discarded. The maximal FLTb output rate which can be digested by the following trigger stages is about 50 kHz.
16 1 The Experiment HERA-B
TFU TFU TFU TFU
TFU TFU TFU TFU
TFU TFU TFU TFU
TFU TFU TFU TFU
TPU
TPU
TDU .
. .
. . .
. . .
. . .
. . .
to second level trigger
µ tracking inner & outer tracking
µ
µ-pads ECAL
e
p - pads
T
π , K
magnet
TFU TFU TFU
TFU TFU TFU
TFU TFU TFU
TFU TFU TFU
. . .
. . .
. . .
µ - Pretrigger e - Pretrigger p - Pretrigger
T
Figure 1.11: Sketch of the FLT implementation [HER00b]. The hit information of four tracking super- layers is transferred into Track Finding Units (TFU). Starting from seeds given by the three pretrigger sources, the TFUs extrapolate Regions of Interest (RoIs) into the next trigger layer upstream and search for coincident hits in these regions. If a coincidence was found, the RoI is refined and projected into the next super-layer. Tracks which were successfully traced through the complete detector behind the magnet are passed to the Track Parameter Units (TPUs), which computes an estimate for the momenta.
This information is then passed to the Track Decision Unit (TDU) which decides whether to keep or discard the event. In case of a positive decision, the regions of interest and the found track parameters are passed to the Second Level Trigger.
1.4 Trigger 17 To limit the amount of data which has to be transferred from the detector readout elec- tronics to the FLT processors, the FLT uses only four of all installed tracking super-layers, and the information from these layers is reduced to digital information ‘hit’/‘no hit.’ The trigger electronics of the Inner Tracker combines the hit information of four neighbouring channels, resulting in a much coarser resolution which is available to the FLT.
During the run period 1999/2000, the FLT was still in the commissioning phase. At the end, a reliable trigger requiring one track found by the FLT could be used routinely, but the results of runs triggered with a two-track mode are not yet understood.
1.4.3 Second and Third Level Trigger
The following trigger levels are implemented as software triggers; the trigger programs run on a farm of about 240 industry-standard PCs (they are called second level processors, SLP). After the FLT decided to keep an event, the complete event information is transferred from the sub- detector specific front-end electronics into the Second Level Buffers (SLB). These are digital signal processors which are used to buffer the detector data for a longer time (O(100 ms). A dedicated custom network using the same type of signal processors as an active switch allows each of the SLPs to access the event data from every sub-detector.
Each triggered event is assigned to one node of the SLT farm for processing. The SLT algorithm starts with the RoIs defined by the FLT and refines the tracks, using the drift-time information of the OTR, and the full resolution of the Inner Tracker, adding hits from more layers if necessary. The search is however still restricted to the RoIs, so that only a limited amount of data has to be transferred from the SLBs to the SLPs. The successfully confirmed tracks are then propagated through the spectrometer magnet using a look-up table for the magnetic field.
Finally, track segments in the Vertex Detector are reconstructed. The event is accepted if the trigger tracks can be matched to VDS track segments which form a common vertex.
Only at this point the complete event data are transferred from the SLBs into the SLP which processes the event. The event builder assembles the data to form one complete event record. The option to call a Third Level Trigger routine at this stage exists, but was not used during the run 2000. The event data is then transferred to the Fourth Level Trigger Farm via a Fast-Ethernet network.
1.4.4 Fourth Level Trigger
The Fourth Level Trigger farm consists of another about 200 processors. Here, the complete event is reconstructed, making full use of all detector information and the best known calibration and alignment constants. The possibility to reject events also at this stage is forseen, although it was not used in the run period 2000. An event classification routine searches for signatures of interesting physics processes; the result of this search is also stored with the event data, providing a fast pre-selection for analysis jobs. The software performing this online reconstruction is exactly the same which also used for the offline data analysis.
Finally, the event data, containing the raw detector information and the output of the reconstruction, is transferred to the DESY computing centre, where it is archived (logged) on tape. Including all information, about 150 kB per event check are needed; since the logging rate is restricted to about 10 MB/s, the output rate of the Fourth Level Trigger farm should not exceed about 30 events per second.
18 1 The Experiment HERA-B
1.5 Data Acquisition System
The Data Acquisition System is depicted schematically in Fig. 1.12. It is closely connected to the trigger system. Its main components are
The Fast Control System [Ful99]. It is the interface between the DAQ system, the front-end electronics of all sub-detectors and the trigger system. It distributes the bunch crossing clock (BX clock) and trigger information (trigger number, BX number of the trigger, trigger type) to the front-ends to synchronise the readout. The FCS also provides a means for the later trigger stages to reduce (throttle) the FLT trigger rate in case the network gets congested; throttling the FLT produces dead time.
The system of Second Level Buffers (SLBs) and the switch connecting the SLBs with the processors of the Second Level Trigger farm [Wag00]. This is done using about 1 200 digital signal processors (SHARCs, ADSP-21060 from Analog Devices), which buffer the detector data.
The Second Level Trigger (SLT) Farm. It consists of 240 off-the-shelf PCs (with Intel Pentium II processors running at 350 MHz), which are equipped with a custom-made interface to the SHARC network.
The Fourth Level Trigger (4LT) Farm consists of another group of single- and dual- processor PCs, with altogether 200 CPUs. The connection between the SLT and the 4LT farm is done using a switched Fast-Ethernet network; the up-link to the computing centre where the data is archived centrally is a Gigabit-Ethernet line.
1.5 Data Acquisition System 19
Tape Farm
Second and Third Level Trigger First Level
Trigger
Front End Pretrigger
Link
Trigger Link Pretrigger
Router Fast
Control
Event Control
System
Buffer Detector specific
HERA Clock
Switch Level
Second
L4 Control
First Level Buffer
Control Processors Network Buffers
Event Data Control
Electronic Subdetector
HERA-B
Fourth Level Trigger / Online Reconstruction Farm
Figure 1.12: The HERA-B Data Acquisition System (from [Med97]).
20 1 The Experiment HERA-B
Part I
Readout for the Inner Tracker of
HERA-B
Chapter 2
The Inner Tracker of HERA-B
As explained in the previous chapter, HERA-B is a high rate experiment. In order to cope with the high particle flux and the ensuing high occupancies, the HERA-B tracking system is divided in two main parts, which are using different geometries and detector technologies. In the centre-of-mass system of the proton-nucleon system, the backwards hemisphere (η∗ <0 in the proton-nucleon centre-of-mass system) is covered by the Outer Tracker, while the Inner Tracker covers most of the forward hemisphere. The Outer Tracker covers distances perpendicular to the beam from about 20 cm up to 290 cm, corresponding to track angles up to 250 mrad. It consists of honeycomb drift chambers with cell sizes of 5 mm in the inner part and 10 mm in the outer part. The Inner Tracker covers the region from the inner border of the Outer Tracker down to about 6 cm around the beam, measuring tracks with slopes from 10 – 100 mrad. In both tracking systems the counting wires are oriented vertically, perpendicular to the bending plane of the spectrometer magnet. The Inner Tracking system was developed and built by the Universities of Heidelberg, Siegen, and Z¨urich. In this chapter, the detectors developed for the Inner Tracker and the configuration at HERA-B are presented.
2.1 Requirements
From the physics programme intended for HERA-B, the following requirements on the Inner Tracking system are derived:
Radiation tolerance and rate capability. The Inner Tracker covers the region from 6 – 25 cm around the beam pipe, where the track density is highest. The particle flux varies from 2×104 mm−2sec−1 in the innermost region to 2×103 mm−2sec−1at the outer edge of the Inner Tracker at a nominal interaction rate of 40 MHz, which was foreseen at the time of HERA-B’s design [L+95]. This translates to a radiation dose of up to 1 Mrad/year, which the detectors have to withstand for several years without a serious degradation in performance. Also, the detectors must be capable of operating at such high counting rates without loss in detection efficiency. Operation experience showed that the presence of heavily ionising particles (HIPs) in hadronic beams poses a very severe constraint because they can induce fatal discharges in the chambers.
Granularity. The granularity of the detector has to be chosen such that the maximal occu- pancy (the percentage of readout channels which are hit on average in each event) does not exceed 5–10%. If the occupancy is significantly higher, the trigger and the pattern recognition and track reconstruction software have a much harder job to find the correct tracks. This re- quirement poses a constraint on the maximal length of a readout strip, given a certain readout
![Figure 1.4: Knowledge as of end of 2000 about the unitarity triangle (from [CDF + 00]): the contours show the allowed regions for ¯ρ and ¯η at 68 %, 95 %, 99 %, and 99.5 %.](https://thumb-eu.123doks.com/thumbv2/1library_info/5505792.1685954/18.892.135.716.716.1011/figure-knowledge-unitarity-triangle-cdf-contours-allowed-regions.webp)
![Figure 3.2: Schematic diagram of the Helix128S readout chip (taken from [FB + 99]). Only one of the 128 analogue readout channels is shown.](https://thumb-eu.123doks.com/thumbv2/1library_info/5505792.1685954/49.892.131.806.141.501/figure-schematic-diagram-helix-readout-analogue-readout-channels.webp)