Temperature dependence of ion-beam mixing in crystalline and amorphous germanium isotope multilayer structures
M. Radek, H. Bracht, M. Posselt, B. Liedke, B. Schmidt, and D. Bougeard
Citation: Journal of Applied Physics 115, 023506 (2014); doi: 10.1063/1.4861174 View online: http://dx.doi.org/10.1063/1.4861174
View Table of Contents: http://scitation.aip.org/content/aip/journal/jap/115/2?ver=pdfcov Published by the AIP Publishing
Temperature dependence of ion-beam mixing in crystalline and amorphous germanium isotope multilayer structures
M. Radek,1H. Bracht,1,a)M. Posselt,2B. Liedke,2B. Schmidt,2and D. Bougeard3
1Institute of Materials Physics, Westf€alische Wilhelms-Universit€at M€unster, 48149 M€unster, Germany
2Institute of Ion Beam Physics and Materials Research, Helmholtz-Zentrum Dresden-Rossendorf, Bautzner Landstraße 400, D-01328 Dresden, Germany
3Institut f€ur Experimentelle und Angewandte Physik, 93040 Regensburg, Germany
(Received 17 December 2013; accepted 18 December 2013; published online 9 January 2014) Self-atom mixing induced by 310 keV gallium (Ga) ion implantation in crystalline and preamorphized germanium (Ge) at temperatures between 164 K and 623 K and a dose of 11015cm2 is investigated using isotopic multilayer structures of alternating 70Ge and natGe layers grown by molecular beam epitaxy. The distribution of the implanted Ga atoms and the ion-beam induced depth-dependent self-atom mixing was determined by means of secondary ion mass spectrometry. Three different temperature regimes of self-atom mixing, i.e., low-, intermediate-, and high-temperature regimes are observed. At temperatures up to 423 K, the mixing is independent of the initial structure, whereas at 523 K, the intermixing of the preamorphized Ge structure is about twice as high as that of crystalline Ge. At 623 K, the intermixing of the initially amorphous Ge structure is strongly reduced and approaches the mixing of the crystalline material. The temperature dependence of ion-beam mixing is described by competitive amorphization and recrystallization processes. VC 2014 AIP Publishing LLC.
[http://dx.doi.org/10.1063/1.4861174]
I. INTRODUCTION
The availability of highly enriched stable isotopes of, e.g., silicon (Si) and germanium (Ge) enables the preparation of isotopically controlled semiconductors that are advanta- geous for studying many fundamental material properties.
Such studies concern, e.g., the mechanisms of self- and dop- ant diffusion,1–3the electronic properties and nature of deep defect centers,4the impact of isotopic composition on heat transport,5–7and the ion-beam induced self-atom mixing.8–10 Although atomic mixing in solids caused by ion irradiation is a known and widely discussed phenomenon,11–17 experi- mental results on self-atom mixing in semiconductors such as Si and Ge are rather limited. Present studies mainly con- cern ion-beam induced self-atom mixing in Si and Ge at room temperature.8–10
In our previous work, we described ion-beam induced self-atom mixing in crystalline and amorphous Ge isotope multilayer structures. In this case, both structures were grown by means of molecular beam epitaxy (MBE).10 A stronger mixing in the crystalline MBE multilayer structure compared to its amorphous counterpart was observed for 300 K. This behavior is at variance to molecular dynamics (MD) simulations of, e.g., Nordlundet al.18In order to test our former results, we prepared an amorphous isotope multi- layer from the MBE grown crystalline isotope structure by Ge implantation. We used this preamorphized Ge structure for comparison of ion-beam mixing in crystalline and amor- phous Ge induced by Ga implantation at different tempera- tures. We demonstrate, in this work, that, depending on the temperature, the ion-beam mixing in preamorphized Ge is
equal to or higher than the mixing in the initially crystalline Ge. This mixing behavior supports the predictions of MD calculations and contradicts our former results obtained by using MBE grown amorphous isotope layers.10The opposite result of our former work published in Ref. 10 is likely affected by contaminations of oxygen and carbon later detected with secondary ion mass spectrometry (SIMS). Our measurements reveal that oxygen and carbon are easily incorporated in MBE grown amorphous Ge by handling in air. It is therefore not representative for pure amorphous Ge.
II. EXPERIMENTAL
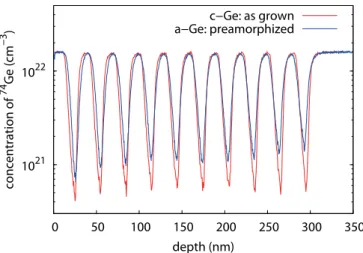
Crystalline (natGe/70Ge)10 isotope multilayers were grown by means of MBE. The thickness of each natural and isotopically enriched layer is about 15 nm. The crystalline structure was deposited on a (100)-oriented n-type Ge wafer with a specific resistivity of 40 X cm. The preamorphized multilayer structure was prepared by Ge ion implantation into the crystalline isotope structure. The implantation was performed at 77 K with 310 keV Ge ions, a dose of 71013cm2, and an ion current of 200 nA. The amorphiza- tion dose of Ge at 77 K is about 61013cm2, according to Koffel et al.19 Cross-sectional transmission electron micro- scope (XTEM) measurements of the preamorphized samples reveal complete amorphization up to a depth of about 200 nm. Moreover, a 50 nm wide defective range is observed beneath the amorphous Ge layer. Figure 1 illustrates 74Ge concentration profiles of the as-grown crystalline (c-Ge: red) and preamorphized (a-Ge: blue) isotope structures measured with SIMS. The SIMS measurements were performed with a TOF-SIMS 5 system in a dual beam mode. Oxygen ions with 1 keV energy were used for sputtering and 25 keV bismuth ions for analysis. The depth of the craters left from the SIMS
a)Electronic address: bracht@uni-muenster.de
0021-8979/2014/115(2)/023506/5/$30.00 115, 023506-1 VC2014 AIP Publishing LLC
analysis was determined with an optical profilometer. The sputter time is converted to penetration depths taking into account the crater depth and assuming a constant sputter rate during SIMS profiling. With the well-known abundance of the Ge isotopes in natural Ge, the detected Ge ion counts are transformed to concentrations. The obtained concentration profiles of74Ge are analytically described by the following equation:
CGeðxÞ ¼C1þC2C1
2 X20
i¼1
ð1Þiþ1erfc xxi
ri
; (1)
wherexis the depth,C1andC2are the minimum and maxi- mum concentrations of the 74Ge isotope, and erfc(x)¼1-erf(x) is the complementary error function. The error function erf(x) is defined as erf(–1)¼ 1 and erf(1)
¼ þ1.xirepresents the depth of theith isotope interface and riis a measure of the steepness in the Ge concentration at the ith interface between natural and isotopically enriched Ge layers.
Ion implantation of 310 keV Ga with a dose of 11015cm2 and an ion current of 200 nA was performed at six different temperatures (164 K, 219 K, 300 K, 423 K, 523 K, and 623 K). The samples are held at these tempera- tures in the implantation chamber for about 30 min. After im- plantation, the temperature was rapidly reduced by liquid nitrogen cooling to suppress any post-implantation induced self-atom mixing that could be caused by the dissolution of defect clusters formed during implantation. Due to the con- struction of the target chamber, all implantations were per- formed at nearly normal incidence to the (100) sample surface. At 164 K and 219 K, Ga implantation was only per- formed into the crystalline Ge isotope structure, whereas both crystalline and preamorphized samples were implanted simultaneously for T300 K.
III. RESULTS AND DISCUSSION
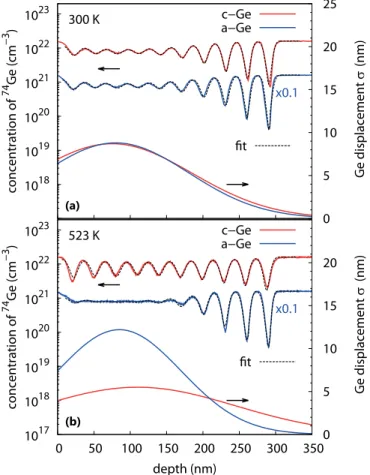
Figure 2shows concentration profiles of74Ge and69Ga measured with SIMS after Ga ion implantation in the ini- tially crystalline (red: c-Ge) and preamorphized (blue: a-Ge) Ge isotope structures. The implantations illustrated in this
figure were performed at 300 K and 523 K. Figure2(a)dem- onstrates that the Ga profile at 300 K in c-Ge (red dashed-- line) is very similar to the Ga profile in a-Ge (blue dashed-line). Both concentration profiles are reproduced by Crystal-TRIM calculations (e.g., Ref.20) (black dashed-line) assuming an amorphous target, whose thickness exceeds the amorphous layer of the preamorphized sample. This is in accord with XTEM results showing an amorphous layer of 320 nm thickness for the Ga implantation at 300 K. The small difference between the Ga profile in c- and a-Ge is due to channeling during Ga implantation in c-Ge until the struc- ture turns amorphous. At 523 K (see Fig.2(b)), the Ga profile of c-Ge strongly deviates from the Ga profile of a-Ge, but is accurately reproduced by Crystal-TRIM calculations assum- ing a crystalline structure during the whole Ga implantation process. The Ga profile of a-Ge follows the Crystal-TRIM prediction (see black dashed line in Fig. 2(b)) when a 200 nm thick amorphous layer on top of a crystalline struc- ture is assumed. This thickness equals the width of the dam- aged layer in the preamorphized Ge. Overall this indicates that Ga implantation at 523 K in c- and a-Ge does not induce any significant structural changes, i.e., both the structure of c- and a-Ge samples remains unchanged.
The self-atom mixing at 300 K in c-Ge, indicated by the
74Ge concentration profiles in Fig.2(a), is very similar to the mixing in a-Ge. In contrast, the self-atom profiles obtained after Ga implantation at 523 K differ strongly across the whole isotope structure as illustrated by Fig. 2(b). A
FIG. 1. SIMS concentration profiles of74Ge of the crystalline (red) and prea- morphized (blue) (natGe/70Ge)10MBE multilayer structures.
FIG. 2. Concentration profiles of74Ge (solid lines) and Ga (dashed lines) in initially crystalline (red) and preamorphized (blue) (natGe/70Ge)10multilayer structures measured by SIMS after implantation with 310 keV Ga at a dose of 11015cm2and temperatures of (a) 300 K and (b) 523 K. The black dashed line and solid black line (histograms) show the Ga implantation pro- file predicted by Crystal-TRIM. The depth profile of the nuclear energy dep- osition per target atom calculated by Crystal-TRIM is illustrated in (c).
023506-2 Radeket al. J. Appl. Phys.115, 023506 (2014)
comparison between 300 K and 523 K reveals that for x200 nm, the self-atom mixing in c-Ge at 300 K is stron- ger than at 523 K. For x>200 nm, it is reverse, i.e., the self-atom mixing in c-Ge at 300 K is weaker than at 523 K.
On the other hand, the amorphous Ge structure is clearly stronger mixed at 523 K than at 300 K for x200 nm, whereas for x>200 nm, the self-atom mixing of a-Ge at 300 K and 523 K is very similar.
The difference in self-atom mixing of c-Ge and a-Ge can be evaluated more quantitatively by modeling the implantation-induced atomic displacements with a convolu- tion integral8
CafterGe ðxÞ ¼ ð
CbeforeGe ðx0Þ gðxx0Þ dx0; (2) where CbeforeGe ðxÞ and CafterGe ðxÞ represent the Ge distribution before and after Ga implantation, respectively. gdenotes a Gaussian function of the form
gðxÞ ¼ 1 ffiffiffiffiffiffiffiffi
p2prexp x2 2r2
: (3)
The quantityrdetermines the width of the Gaussian function and is assumed to be depth dependent
rðxÞ ¼kexp ðxlÞ2 2m2
: (4)
With Eqs.(2)to(4), the depth dependent ion-beam induced self-atom mixing of the Ge multilayer is described by means of a depth dependent displacement function rðxÞ. The pa- rametersk,l,andmare the amplitude, position, and width of therðxÞfunction. These parameters were optimized to accu- rately describe the 74Ge concentration profiles. Figure 3 shows best fits to the experimental74Ge profiles obtained af- ter Ga implantation into c- and a-Ge at 300 K and 523 K. The correspondingrðxÞprofiles referred to the right ordinate are also displayed. The similarity of the rðxÞ profiles at 300 K (see Fig.3(a)) expresses the almost identical self-atom mix- ing in c- and a-Ge at this temperature (see Fig.2(a)). On the other hand, the disparity of the rðxÞprofiles at 523 K (see Fig.3(b)) indicates the difference in self-atom mixing in c- and a-Ge shown in Fig.2(b). The stronger mixing of a-Ge compared to c-Ge forx200 nm leads to a higher Ge dis- placement as shown in Fig.3(b). The higher Ge displace- ment of c-Ge compared to a-Ge forx>200 nm reflects the stronger mixing of c-Ge than of a-Ge. As expected, the Ge displacement r of c- and a-Ge is in qualitative agreement with the depth profile of the nuclear energy depositionEdper target atom (see Fig.2(c)).
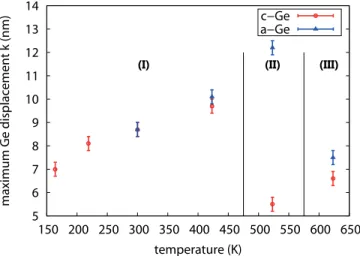
The parameters describing the Ge displacementrðxÞof all Ga implanted c- and a-Ge samples investigated in this work are listed in TableI. The amplitude of mixingk, i.e., maximum Ge displacement, is shown in Fig.4as a function of the sample temperature during ion implantation. The tem- perature dependence of ion-beam mixing in c- and a-Ge is divided in three temperature regions. In region I, ion-beam mixing in initially crystalline and preamorphized Ge is
nearly equal. Within this region, the Ge displacement increases with temperature. Thekvalues for c- and a-Ge at 300 K and 423 K are equal within the experimental accuracy indicating that the corresponding Ge profiles are very similar (see Fig.2(a) for 300 K). The similar atomic mixing of the initially crystalline and preamorphized sample is a
FIG. 3. Best fits (black dashed lines) based on Eqs. (2)–(4) to the Ga-implantation induced self-atom mixing profiles (solid lines) in initially crystalline (red) and preamorphized (blue) Ge at (a) 300 K and (b) 523 K.
The74Ge concentration profiles of c- and a-Ge are differently scaled for clarity. The lower solid lines in (a) and (b) show the corresponding Ge dis- placementrðxÞdetermined from the analysis of ion-beam induced self-atom mixing at 300 K and 523 K, respectively. Note, the Ge displacement ris referred to the right axis. The parameters of therðxÞfunction of all samples investigated, in this work, are listed in TableI.
TABLE I. Fit parametersk(amplitude),l(position), andm(width) of the depth dependentrðxÞfunction deduced from the analysis of self-atom mix- ing in crystalline and preamorphized Ge isotope multilayers. The mixing of the isotope structure was induced by 310 keV Ga implantation at a dose of 11015cm2and temperatures ranging from 164 K to 623 K.
sample T(K) k(nm) l(nm) m(nm)
c-Ge 164 6.060.3 10065 9565
c-Ge 219 8.160.3 11065 12065
c-Ge 300 8.760.3 7565 11065
a-Ge 300 8.760.3 8565 8565
c-Ge 423 9.760.3 8065 11565
a-Ge 423 10.160.3 8565 10565
c-Ge 523 5.560.3 11065 13565
a-Ge 523 12.260.3 8565 8565
c-Ge 623 6.660.3 12065 11065
a-Ge 623 7.560.3 9065 11865
consequence of the amorphization of c-Ge during Ga im- plantation. The amorphization threshold of Ge at 300 K is reached at a Ga ion dose of about 61013cm2.19 Considering the total ion dose of 11015cm2, the initially crystalline sample is amorphous during more than 90% of the ion implantation time. This explains the very similar Ge mixing in the initially crystalline and preamorphized Ge in region I. The slightly stronger Ge mixing in c-Ge compared to a-Ge at 300 K for x>200 nm (see Fig. 2(a)) is due to channeling effects before the crystalline host structure turns amorphous. The non-crystalline state after implantation at 300 K is confirmed by channeling Rutherford backscattering spectrometry (RBS/C).21For RBS/C measurements, a colli- mated 1.7 MeV helium (He2þ) beam was used. The sample was mounted on a three-axis, high precision (60.01) goni- ometer in a vacuum chamber. The increasing self-atom mix- ing with increasing temperature observed within region I is in accord with the thermal spike model (see, e.g., Ref.15).
This model predicts that self-atom mixing mainly takes place during the relaxation stage following the collision cascade.
The incident Ga ion transfers its kinetic energy through colli- sions to the Ge host atoms resulting in locally melted regions. With increasing temperature of the sample, the vol- ume of these areas and the time, the temperature exceeds the melting point increases. Thus, atomic mixing within these regions increases with temperature. It should be mentioned that the thermal spike model must be used for the explana- tion since a pure ballistic interpretation of the observed self-atom mixing is only possible if unphysically low values for the displacement energy of Ge atoms are assumed.10
RBS/C measurements of the c-Ge sample implanted at 523 K reveal that it is crystalline. On the other hand, RBS/C analysis shows that the a-Ge sample remains non-crystalline.
Therefore, one can assume that in region II, the initial struc- ture of both samples is not severely modified by the implan- tation. Within the framework of the thermal spike model, the higher mixing of the amorphous structure compared to its crystalline counterpart can be explained by the lower heat transport capacity and the reduced melting point of a-Ge
(965 K) compared to c-Ge (1210 K). This interpretation is in agreement with MD calculations of, e.g., Nordlund et al.18 The MD simulations reveal that the magnitude of mixing in a-Ge is about a factor of 2 higher than in c-Ge.
The c-Ge structure shows a more pronounced intermix- ing for x>200 nm at both 300 K and 523 K than the a-Ge structure. Since Ga implantation was performed at nearly 0 incidence and c-Ge remains crystalline at 523 K, channeling effects lead to higher penetration depths of Ga and stronger Ge mixing in c- than in a-Ge for x>200 nm. Figure 2(c) illustrates this by the comparison to the depth profile of the nuclear energy deposition. This quantity is a measure of the intensity of atomic collisions and therefore of the self-atom mixing. It is obvious that atx>200 nm, the nuclear energy depositionEdis higher in c-Ge than in a-Ge. The a-Ge sam- ples implanted at 300 K and 523 K reveal a similar atomic mixing for x>200 nm. This indicates similar structures of the samples, most of the time during implantation.
Finally, region III indicated in Fig.4is characterized by a self-atom mixing of the preamorphized sample that drops to the level of the crystalline structure. The Ge displacement at 623 K of a-Ge (c-Ge) is strongly reduced (slightly enhanced) compared to the value at 523 K. As found by RBS/C, the preamorphized sample turns crystalline during implantation at 623 K. It is very likely that the recrystalliza- tion of a-Ge proceeds by solid phase epitaxy (SPE). This can be concluded from the experimental results on the recrystal- lization velocity in dependence on temperature.22From these data, it follows that at 623 K, the SPE regrowth (SPER) pro- cess is sufficiently fast to recrystallize the entire amorphous isotope structure, whereas at 523 K, the recrystallization ve- locity is still too low. The difference observed in atomic mix- ing of a- and c-Ge at 623 K can be explained with the higher mixing efficiency of a-Ge compared to c-Ge until SPE of a- Ge is completed. However, a SPE induced self-atom mixing could also explain the difference.
IV. CONCLUSION
Ga implantation induced mixing in initially crystalline and preamorphized Ge isotope multilayer structures were investigated by means of SIMS in combination with RBS/C.
A convolution integral method was applied for the quantita- tive analysis of the self-atom mixing. Three temperature regions were identified in the range of 164 K to 623 K, which show different mixing characteristics. All observed charac- teristics of self-atom mixing and of the corresponding Ga profiles are consistently explained in the framework of the thermal-spike model, channeling effects, amorphization and recrystallization processes, and differences in the heat trans- port capacity and melting point of the crystalline and prea- morphized Ge.
ACKNOWLEDGMENTS
The authors thank TASCON GmbH in M€unster for SIMS measurements, Professor Dr. E. E. Haller for provid- ing the Ge isotopes for the MBE growth, S. Eisenwinder for ion implantation, Dr. R. Heller for RBS analysis, and Dr. R.
FIG. 4. Temperature dependence of the amplitudekof mixing (maximum Ge displacement), cf. TableI. The mixing of the initially crystalline samples is marked in red, the results for the preamorphized samples are marked in blue. Three temperature regimes (I, II, and III) with different mixing charac- teristics are identified.
023506-4 Radeket al. J. Appl. Phys.115, 023506 (2014)
H€ubner for XTEM measurements. This work was funded by the Deutsche Forschungsgemeinschaft under Grant Nos. BR 1520/14-1 and PO 436/6-1 as well as an individual Grant No. BR 1520/10-2 within the Heisenberg program for H.B.
1H. Bracht, H. H. Silvestri, I. D. Sharp, and E. E. Haller,Phys. Rev. B75, 035211 (2007).
2S. Brotzmann, H. Bracht, J. L. Hansen, A. N. Larsen, E. Simoen, E. E.
Haller, J. S. Christensen, and P. Werner,Phys. Rev. B77, 235207 (2008).
3E. H€uger, U. Tietze, D. Lott, H. Bracht, D. Bougeard, E. E. Haller, and H.
Schmidt,Appl. Phys. Lett.93, 162104 (2008).
4M. Steger, A. Yang, T. Sekiguchi, K. Saeedi, M. L. W. Thewalt, M. O.
Henry, K. Johnston, H. Riemann, N. V. Abrosimov, M. F. Churbanov, A.
V. Gusev, A. K. Kaliteevskii, O. N. Godisov, P. Becker, and H.-J. Pohl, J. Appl. Phys.110, 081301 (2011).
5T. Ruf, R. W. Henn, M. Asen-Palmer, E. Gmelin, M. Cardona, H.-J. Pohl, G. G. Devyatych, and P. G. Sennikov, Solid State Commun.115, 243 (2000);127,257(2003).
6H. Bracht, N. Wehmeier, S. Eon, A. Plech, D. Issenmann, J. L. Hansen, A.
N. Larsen, J. W. Ager III, and E. E. Haller,Appl. Phys. Lett.101, 064103 (2012).
7H. Bracht, S. Eon, R. Frieling, A. Plech, D. Issenmann, D. Wolf, J. L. Hansen, A. N. Larsen, J. W. Ager III, and E. E. Haller, “Thermal conductivity of isoto- pically controlled silicon nanostructures,” New J. Phys. (to be published).
8Y. Shimizu, M. Uematsu, K. M. Itoh, A. Takano, K. Sawano, and Y.
Shiraki,Appl. Phys. Express1, 021401 (2008).
9Y. Kawamura, Y. Shimizu, H. Oshikawa, M. Uematsu, E. E. Haller, and K. M. Itoh,Physica B404, 4546 (2009).
10H. Bracht, M. Radek, R. Kube, S. Knebel, M. Posselt, B. Schmidt, and E.
E. Haller,J. Appl. Phys.110, 093502 (2011).
11R. Collins,Radiat. Eff.98(1–4), 1–20 (1986).
12Y.-T. Cheng,Mater. Sci. Rep.5, 45 (1990).
13M. Nastasi and J. W. Mayer,Mater. Sci. Eng. R.12, 1 (1994).
14W. Bolse,Mater. Sci. Eng., A253, 194 (1998).
15R. S. Averback and T. D. de la Rubia, Solid State Phys.51, 281–402 (1997).
16C. Jaouen, A. Michel, J. Pacoud, C. Dufour, P. Bauer, and B. Gervais, Nucl. Instrum. Methods Phys. Res. B148, 176 (1999).
17T. Weber and K. P. Lieb,J. Appl. Phys.73, 3499 (1993).
18K. Nordlund, M. Ghaly, and R. S. Averback, J. Appl. Phys.83, 1238 (1998).
19S. Koffel, P. Scheiblin, A. Claverie, and G. Benassayag,J. Appl. Phys.
105, 013528 (2009).
20M. Posselt, L. Bischoff, D. Grambole, and F. Herrmann,Appl. Phys. Lett.
89, 151918 (2006).
21In Handbook of Modern Ion Beam Material Analysis, edited by J. R.
Tesmer, M. Nastasi, J. C. Barbour, C. J. Maggiore, and J. W. Mayer (Materials Research Society, Pittsburgh, 1995).
22B. C. Johnson, P. Gortmaker, and J. C. McCallum, Phys. Rev. B77, 214109 (2008).