Research Collection
Journal Article
Major depressive disorder subtypes and depression symptoms in multiple sclerosis: What is different compared to the general population?
Author(s):
Rodgers, Stephanie; Calabrese, Pasquale; Ajdacic-Gross, Vladeta; Steinemann, Nina; Kaufmann, Marco;
Salmen, Anke; Manjaly, Zina-Mary; Kesselring, Jürg; Kamm, Christian P.; Kuhle, Jens; Chan, Andrew;
Gobbi, Claudio; Zecca, Chiara; Müller, Stefanie; von Wyl, Viktor Publication Date:
2021-05
Permanent Link:
https://doi.org/10.3929/ethz-b-000472333
Originally published in:
Journal of psychosomatic research 144, http://doi.org/10.1016/j.jpsychores.2021.110402
Rights / License:
Creative Commons Attribution-NonCommercial-NoDerivatives 4.0 International
This page was generated automatically upon download from the ETH Zurich Research Collection. For more information please consult the Terms of use.
ETH Library
Journal of Psychosomatic Research 144 (2021) 110402
Available online 16 February 2021
0022-3999/© 2021 The Authors. Published by Elsevier Inc. This is an open access article under the CC BY-NC-ND license
(http://creativecommons.org/licenses/by-nc-nd/4.0/).
Major depressive disorder subtypes and depression symptoms in multiple sclerosis: What is different compared to the general population?
Stephanie Rodgers
a,*,1, Pasquale Calabrese
b,1, Vladeta Ajdacic-Gross
a,c, Nina Steinemann
a, Marco Kaufmann
a, Anke Salmen
d, Zina-Mary Manjaly
e,f, Jürg Kesselring
g,
Christian P. Kamm
d,h, Jens Kuhle
i, Andrew Chan
d, Claudio Gobbi
j,k, Chiara Zecca
j,k, Stefanie Müller
l, Viktor von Wyl
aaEpidemiology, Biostatistics and Prevention Institute, University of Zurich (UZH), Zurich, Switzerland
bDivision of Molecular and Cognitive Neuroscience, University of Basel, Basel, Switzerland
cDepartment of Psychiatry, Psychotherapy and Psychosomatics, Psychiatric University Hospital Zurich (PUK), Zurich, Switzerland
dDepartment of Neurology, Inselspital, Bern University Hospital and University of Bern, Bern, Switzerland
eDepartment of Neurology, Schulthess Clinic, Zürich, Switzerland
fDepartment of Health Sciences and Technology, ETH Zurich, Zürich, Switzerland
gDepartment of Neurology and Neurorehabilitation, Rehabilitation Centre Kliniken Valens, Valens, Switzerland
hNeurocentre, Luzerner Kantonsspital, Lucerne, Switzerland
iNeurologic Clinic and Policlinic, Departments of Medicine, Biomedicine and Clinical Research, University Hospital and University of Basel, Basel, Switzerland
jDepartment of Neurology, Multiple Sclerosis Center (MSC), Neurocenter of Southern Switzerland, 6900 Lugano, Switzerland
kFaculty of Biomedical Sciences, Universit`a della Svizzera Italiana (USI), 6900 Lugano, Switzerland
lDepartment of Neurology, Cantonal Hospital St. Gallen, St. Gallen, Switzerland
A R T I C L E I N F O Keywords:
Multiple sclerosis Depression Subtypes
A B S T R A C T
Objective: To compare and characterize major depressive disorder (MDD) subtypes (i.e., pure atypical, pure melancholic and mixed atypical-melancholic) and depression symptoms in persons with multiple sclerosis (PwMS) with persons without MS (Pw/oMS) fulfilling the DSM-5 criteria for a past 12-month MDD.
Methods: MDD in PwMS (n =92) from the Swiss Multiple Sclerosis Registry was compared with Pw/oMS (n = 277) from a Swiss community-based study. Epidemiological MDD diagnoses were based on the Mini-SPIKE (shortened form of the Structured Psychopathological Interview and Rating of the Social Consequences for Epidemiology). Logistic and multinomial regression analyses (adjusted for sex, age, civil status, depression and severity) were computed for comparisons and characterization. Latent class analysis (LCA) was conducted to empirically identify depression subtypes in PwMS.
Results: PwMS had a higher risk for the mixed atypical-melancholic MDD subtype (OR = 2.22, 95% CI = 1.03–4.80) compared to Pw/oMS. MDD in PwMS was specifically characterized by a higher risk of the two so- matic atypical depression symptoms ‘weight gain’ (OR =6.91, 95% CI =2.20–21.70) and ‘leaden paralysis’ (OR
=3.03, 95% CI =1.35–6.82) and the symptom ‘irritable/angry’ (OR =3.18, 95% CI =1.08–9.39).
Conclusions: MDD in PwMS was characterized by a higher risk for specific somatic atypical depression symptoms and the mixed atypical-melancholic MDD subtype. The pure atypical MDD subtype, however, did not differen- tiate between PwMS and Pw/oMS. Given the high phenomenological overlap with MS symptoms, the mixed atypical-melancholic MDD subtype represents a particular diagnostic challenge.
Abbreviations: MDD, Major Depressive Disorder.
* Corresponding author at: Epidemiology, Biostatistics and Prevention Institute, University of Zurich (UZH), Hirschengraben 84, CH-8001 Zürich, Switzerland.
E-mail address: stephanie.rodgers@uzh.ch (S. Rodgers).
1 First authorship
Contents lists available at ScienceDirect
Journal of Psychosomatic Research
journal homepage: www.elsevier.com/locate/jpsychores
https://doi.org/10.1016/j.jpsychores.2021.110402
Received 11 September 2020; Received in revised form 4 January 2021; Accepted 13 February 2021
1. Introduction
Empirical evidence demonstrates that major depressive disorder (MDD) is the most prevalent comorbidity of the immune-mediated, in- flammatory disease multiple sclerosis (MS) [1]. Compared to the life- time prevalence of MDD ranging between 12.8% to 17.1% in the general community [2–4], prevalence was reported substantially higher in persons with MS (PwMS), with the magnitude of difference depending on the examined sample (clinical, community/registry-based) and the choice of instrument [5,6]: while studies using dimensional screening tools with different cut-offs led to lifetime prevalence ranges between 20 and 50% [e.g., 7, 8–11], studies applying clinical diagnostic interviews showed ranges between 17 and 34% [11–13] together with a 12-month prevalence of 15.7% [9]. The burden and the consequences of comorbid MDD are high and constitute one of the main determinants of decreased quality of life in PwMS [14–17]. Thus, the issue of MDD in MS still de- mands more attention in research and clinical practice [18].
MDD is a well-treatable mental disorder [19,20]. However, MDD in PwMS is mostly not adequately recognized and hence undertreated [18]. The high symptom overlap between MDD and MS represents a particular diagnostic challenge and may result in potential distortions of MDD prevalence in PwMS [5]. For example, fatigue is one of the most common symptoms in MS and, at the same time, represents a major diagnostic criterion for MDD, and also psychomotoric retardation and sleeping problems occur in both MDD and MS [5]. Furthermore, the diagnostic process is hampered by the fact that both MDD and MS bear a high symptom heterogeneity. Therefore, apart from the comparison of depression symptoms, focusing on homogeneous subtypes (i.e., speci- fied clusters of differing symptoms) is a promising approach to achieve more tailored diagnostics and treatments [21].
Studies directly comparing depression symptoms between PwMS and persons without MS (Pw/oMS) are still scarce: some studies found that MDD in PwMS was characterized by a higher occurrence of either neurovegetative or somatic symptoms or health-related concerns and suicidal ideation [22–26], whereas other studies, statistically controlling for depression severity, concluded that the presentation of depression symptoms is highly similar [27,28]. Certain non-somatic depression symptoms, such as future pessimism, were also judged to be relevant in PwMS [25,29], but these findings were not consistently replicated.
Apart from the diagnostic threshold level of MDD, the subsyndromal symptom ‘irritability’ hallmarking affective instability was also emphasized within PwMS [12,30].
Evidence is even scarcer regarding depression subtypes. The most consistent finding concerns a distinction between melancholic and atypical symptom constellations [21,31]; these two depression subtypes are also catalogued as MDD specifiers in the fifth edition of the Diag- nostic and Statistical Manual of Mental Disorders (DSM-5) [32]. The melancholic MDD subtype (MDD episode characterized by: a) either loss of pleasure or lack of reactivity, and b) three or more of the following features: distinct quality of depressed mood, worse in the morning, early morning awakening, psychomotor retardation or agitation, anorexia or weight loss, excessive guilt) shows a lifetime prevalence of 24–32%
[33–35] and cumulative incidence rates of 7% [33], the atypical MDD subtype (MDD episode characterized by: a) mood reactivity, and b) two or more of the following features: weight gain or increase in appetite, hypersomnia, leaden paralysis, long-standing pattern of interpersonal rejection sensitivity) between 15 and 39% [36–38] and 4% [33], respectively. Notably, atypical depression, which is correlated with in- flammatory processes [39–41] and might particularly benefit from specific treatments [41,42], deserves further examination in PwMS. The only study so far [29] compared sum scores of atypical and melancholic depression symptom clusters between PwMS and Pw/oMS, without finding any differences. A potential problem with such clustering algo- rithms is the overlap in some depressive symptomatology between the atypical and melancholic clusters [43]. Consequently, they are not defined in their distinct, pure forms, as required by the DSM-criteria.
Apart from pure melancholic and atypical MDD subtypes, however, melancholic and atypical depression subtypes have indeed shown sub- stantial longitudinal overlap in nearly half of all cases, particularly in women [33,34,44,45]. In fact, such defined mixed atypical-melancholic MDD subtypes (i.e., persons fulfilling specifiers criteria for both atypical and melancholic depression) have not been considered in DSM- classifications so far. Because women represent the majority of PwMS in most developed countries, the mixed atypical-melancholic MDD subtype may also be more prevalent in the population of PwMS and thus requires further examination.
Therefore, the aims of the current study were: 1) to compare depression symptoms between PwMS and Pw/oMS; 2) to compare MDD subtypes between PwMS and Pw/oMS with a MDD subtype definition based on a) distinct pure atypical, pure melancholic, and mixed atypical- melancholic MDD subtypes according to DSM-5 criteria [32] and b) MDD subtypes based on latent class analysis (LCA), a data-driven approach; and 3) to describe these MDD subtypes by depression char- acteristics and MS characteristics in PwMS. In particular, a more frequent occurrence of the atypical MDD subtype / atypical depression symptoms in PwMS compared to Pw/oMS was hypothesized, given that inflammatory processes play a central role in MS and are thought to be involved in atypical depression [39–41]. We also expected that the mixed atypical-melancholic MDD subtype showing a female prepon- derance was relevant in PwMS [33,34,44]. Finally, by applying LCA we expected that the atypical, melancholic, and mixed atypical-melancholic MDD subtypes would be replicated while retaining the option to detect potentially novel MDD subgroups that could be related to MS.
2. Materials and methods 2.1. Study sample
Data were derived from two sources: a) the Swiss Multiple Sclerosis Registry (SMSR), and b) the epidemiology survey of the ZInEP project (Zürcher Impulsprogramm zur nachhaltigen Entwicklung der Psychia- trie, i.e. the „Zurich Program for Sustainable Development of Mental Health Services“):
a) The SMSR is an ongoing, prospective, longitudinal observational study focusing on the life circumstances of adult PwMS and their relatives and proxies in Switzerland (n =2370; status quo: August 31, 2020) (http://www.Clinical- Trials.gov identifier:
NCT02980640). This study was initiated and is funded by the Swiss MS Society. The patient-centered SMSR is based on a citizen-science approach directly involving PwMS in central functions. Details on the study design and evidence of the representativeness of the SMSR for the Swiss MS population are described elsewhere [46–48]. For the current study, the 12 month post baseline survey data containing a focus topic depression (n =567) was considered. The SMSR was approved by the Ethics Committee Zurich (PB-2016-00894) and written informed consent was obtained from all participants [46].
b) The ZInEP epidemiology survey was established in order to generate comprehensive data about mental health in the general population of adults in the canton of Zurich [49]. This survey was designed as a cross-sectional sequel to the longitudinal Zurich Study [50], i.e., age and sex structure and instruments were parallelized. It consisted of three components: a) a brief telephone screening (n =9829), b) a structured face-to-face-interview of a sample stratified along sex, age and mental psychiatric symptoms severity (n =1500) supplemented by self-report questionnaires, and c) a longitudinal survey (n =227) [49]. For the present study, information from the face-to-face- interview (n =1500) was used.
All subjects with an epidemiological MDD diagnosis at any time in the past 12 months minimum were selected from the SMSR (n =92) and
Journal of Psychosomatic Research 144 (2021) 110402
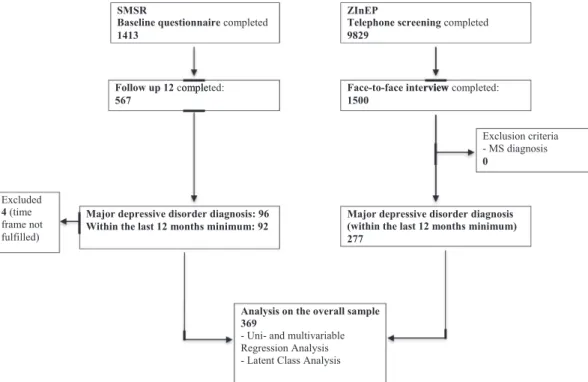
3 the ZInEP survey (n = 277), leading to an overall sample of 369 depressed persons. Exclusion criterion was a MS diagnosis in the ZInEP survey, not occurring in any participant. In contrast, 4 participants were excluded in the SMSR sample, as they did not fulfill the required past 12 months time-frame of MDD. The detailed composition of the samples used for subsequent data analysis is depicted in a flow-chart (Fig. 1).
2.2. Measurements
2.2.1. Socio-demographic characteristics
The socio-demographic variables sex, age, education, urbanicity, nationality and civil status were drawn from the SMSR baseline assess- ment and from the ZInEP screening interview, respectively.
2.2.2. Depression assessment
The instruments assessing depression were parallelized between the SMSR and the ZInEP survey by using the Mini-SPIKE, a shortened version of the SPIKE (Structured Psychopathological Interview and Rating of the Social Consequences of Psychological Disturbance for Epidemiology – Version 10). This face-to-face-interview, based on the DSM criteria, was originally developed within the scope of the Zurich Study [50,51]. It covers most psychopathological subthreshold and threshold syndromes / disorders for the time span of the last 12 months and showed very high validity and inter-rater reliability [49]. This in- strument was found to have high sensitivity and modest specificity (0.95 and 0.59, respectively) for MDD [50]. In the SMSR, the Mini-SPIKE was implemented as a self-assessment and additional information was assessed to also cover the time span before the last 12 months.
DSM-5 criteria [32] derived from the Mini-SPIKE were applied to establish an epidemiological MDD diagnosis. Depression severity was computed by the MDD diagnosis criteria sum score ranging from 5 to 9 symptoms. The atypical and melancholic MDD specifiers were separated into a) pure subtypes, and b) mixed subtypes if a person fulfilled both atypical and melancholic MDD specifiers criteria (excluding the un- equivocal specifier criterion ‘mood reactivity’).
On the symptom level, all DSM-5 MDD classification criteria, sup- plemented by non-covered symptoms of the atypical MDD and melan- cholic MDD specifiers, were considered (for a full list, see “Depression
symptoms.docx” in Supplementary material). The neurovegetative MDD criteria were disaggregated as this approach turned out to be beneficial in detecting depression subtypes in previous studies [52]. ‘Significant weight gain / loss’ was fulfilled if the self-reported weight change within one month reached at least 5% of the initial body weight. Finally, the symptom ‘irritable/angry’ was added as it was judged to be relevant within the assessment of MDD in PwMS [12].
In the SMSR, the 7-item Beck Depression Inventory-Fast Screen (BDI- FS) [53] was also applied. This self-rating questionnaire assessing cur- rent subjective burden resulting from depression (time-span: past two weeks) has been specifically validated for use in PwMS [54]. The BDI-FS counteracts the potentially biased overestimation of MDD prevalence in PwMS as it captures depression under exclusion of somatic (that is, MS- overlapping and therefore likely confounding) features. Clinically sig- nificant depressive symptomatology was defined as a BDI-FS sum score greater than or equal to 4 as this cut-off showed sensitivity between 0.97 and 1.00 and specificity between 0.79 and 0.99 [55,56].
A visual analogue scale (VAS) ranging from 0 (no burden at all) to 100 (maximal burden) was available from the Mini-SPIKE for both surveys, and analyzed both metric and dichotomized by high burden (larger than or equal to 75) versus low burden (lower than 75).
Information on additional clinical and health-related characteristics of depression and MS can been found in the Supplementary material (see
“Clinical and health-related characteristics.docx”).
2.3. Statistical analysis
The analysis design comprised two steps: In the first step, the pure and mixed MDD subtypes and depression symptoms based on DSM-5 definitions were compared in the overall sample of depressed PwMS and Pw/oMS by regression analysis. These regression analyses were adjusted for confounders – both theoretically and empirically derived ones. In the second step, LCAs on 19 depression symptoms and a variable assessing subjective burden were applied. Latent class characterization was based on odds ratios (ORs) with 95% confidence intervals (CI) from multivariate multinomial logistic regressions and performed based on both the overall sample and restricted only to PwMS. Further details of these steps are described in the Supplementary material (see “Regression
Follow up 12 completed:
567
Face-to-face interview completed:
1500
Exclusion criteria - MS diagnosis 0
Major depressive disorder diagnosis: 96 Within the last 12 months minimum: 92
Major depressive disorder diagnosis (within the last 12 months minimum) 277
ZInEP
Telephone screening completed 9829
omple rview
SMSR
Baseline questionnaire completed 1413
Analysis on the overall sample 369
- Uni- and multivariable Regression Analysis - Latent Class Analysis Excluded
4 (time frame not fulfilled)
Fig. 1. Flow chart describing the study samples of the Swiss Multiple Sclerosis Registry and the ZInEP epidemiology survey (numbers reflect numbers of persons).
S. Rodgers et al.
analysis and latent class analysis.docx”). Additional sensitivity analysis was performed with the variables antidepressant or psychotherapy treatment (overall), and DMT (PwMS) due to their potential effect on MDD presentation. In descriptive and regression analyses, we took into account the stratification of the ZInEP sample.
Descriptive analysis and regression models were performed using the IBM SPSS Statistics for Macintosh, version 25.0 [57] and Stata software for Macintosh, version 13.1 [58]. SAS Version 9.4 was used in analyses accounting for the stratification of the ZInEP sample. LCA was con- ducted using Mplus for Macintosh, version 8 [59]. Statistical signifi- cance was defined as a p-value <0.05.
3. Results
3.1. Descriptive statistics
The comparisons between depressed PwMS and Pw/oMS concerning socio-demographics are presented in Table 1. The groups were socio- demographically comparable apart from the following significantly differing characteristics: the sample of depressed PwMS encompassed more women (80.4% vs. 58.2%) and, moreover, a higher age compared with Pw/oMS (median: 49.0 vs. 29.0). Additionally, PwMS were more frequently married or in a registered partnership (47.3% vs. 25.4%).
Consequently, the socio-demographic variables sex, age and civil status were considered confounding variables, in additional to the theoretical- derived confounding variable depression severity, in all subsequent regression analyses on PwMS versus Pw/oMS (see Tables 3 and 5).
The past 12-month prevalence rate of MDD was higher in PwMS (n = 92; 16.2%) compared to Pw/oMS (n =277; 11.6%, weighted) showing the following proportions for PwMS / Pw/oMS: OR =1.5 (95% CI = 1.1–2.0; unadjusted), and OR =1.2 (95% CI =0.9–1.7; adjusted for sex and age) (data not tabulated).
MDD subtypes, and MDD- and somatic characteristics are shown in Table 2. The pure atypical and melancholic MDD subtypes according to DSM-5 were similarly distributed between PwMS and Pw/oMS. The sum scores of the melancholic and atypical specifier criteria and of the overall depression symptoms, respectively, were also comparatively distributed. However, the mixed atypical-melancholic MDD subtype was significantly higher in PwMS (n =46; 50%) than in Pw/oMS (n =122;
35.1%, weighted). The Body Mass Index (BMI) also significantly differed between the samples with PwMS showing a higher BMI in comparison with Pw/oMS. In contrast, antidepressant and psychotherapeutic treat- ment and the subjective burden resulting from depression did not differ between PwMS and Pw/oMS. Finally, information on the temporal order
Table 1
Socio-demographic characteristics of persons with MS (PwMS) and persons without MS (Pw/oMS) fulfilling the criteria for a 12-month MDD diagnosis.
PwMS (n =92) Pw/oMS (n =277) Socio-demographics
Sex
Men 18 (19.6%) 122 (41.8%a)
Women 74 (80.4%) 155 (58.2%a)
Age, years 49.0 (42.0;56.8)
range: 23–81 29.0 (24.0;36.0a) range: 21–42 Educationb
low 48 (53.9%) 136 (51.1%a)
high 41 (46.1%) 141 (48.9%a)
Urbanicityc 1
Urban 52 (56.5%) 165 (55.5%a)
Rural 40 (43.5%) 112 (44.5%a)
Nationality
Swiss 86 (93.5%) 258 (90.4%a)
Other 6 (6.5%) 19 (9.6%a)
Civil status
Married, registered partnership 43 (47.3%) 57 (25.4%a)
Other 48 (52.7%) 220 (74.6%a)
2
Results are shown as numbers (percentage), or medians (interquartile range (25PI;75PI)).
Pw/oMS: Zurich (more than 400′000 residents) and Winterthur (more than 100′000 residents) were considered as urban areas, all other communities as rural areas.
1n=3 missing;2n=1 missing
Abbreviations: MDD =Major Depressive Disorder; PwMS =Persons with Mul- tiple Sclerosis; Pw/oMS =Persons without Multiple Sclerosis.
aweighted relative percentage according to ZInEP stratification.
b High: High school or higher corresponding to 12–13 years of education.
cPwMS: based on the Federal Statistical Office of Switzerland; areas classified as ‘urban to rural’ were defined as rural.
Table 2
MDD subtypes, MDD characteristics and somatic characteristics of persons with MS (PwMS) and persons without MS (Pw/oMS) fulfilling the criteria of a 12- month MDD diagnosis.
PwMS (n =
92) Pw/oMS (n =
277) MDD subtypes (DSM-5 criteria)
12-month prevalence
Pure atypical 4 (4.3%) 21 (8.4%a)
Pure melancholic 21 (22.8%) 62 (27.5%a)
Mixed atypical-melancholic 46 (50.0%) 122 (35.1%a)
Not assignable 21 (22.8%) 72 (29.0%a)
Sum of melancholic specifier criteria 3.0 (2.0;4.0) 3.0 (2.0;4.0a) Sum of atypical specifier criteria 2.0 (1.0;3.0) 1.5 (1.0;2.0a) MDD characteristics
Subjective burden resulting from depression
0–100 80.0
(70.0;90.0) 80.0 (60.0;90.0a) Sum score of depressive symptoms 1
5 to 9 7.0 (6.3;8.0) 7.0 (6.0;8.0a)
Treatment Antidepressants
yes 24 (26.1%) 92 (33.0%a)
no 68 (73.9%) 185 (67.0%a)
Psychotherapy
yes 34 (37.0%) 102 (28.7%a)
no 58 (63.0%) 175 (71.3%a)
Antidepressants or Psychotherapy
yes 45 (48.9%) 126 (42.0%a)
no 47 (51.1%) 151 (58.0%a)
Somatic characteristic
Body Mass Index 25 (22.0;28.9) 23 (20.7;25.3a)
2 3
Additional depression characteristics Only available for PwMS
BDI-FS
Clinically relevant depressive
symptomatology 53 (57.6%) N/A
Temporal order of depression with MS 4
diagnosis N/A
Before 4 (4.7%)
After 46 (54.1%)
At the same time 6 (7.1%)
Both before and after 29 (34.1%)
WHO-Five Well-being index 5 N/A
Sum score 12 (9.0;16.0)
Good well-being 40 (46.0%)
Poor well-being, indication for testing MDD
given 47 (54.0%)
6
Results are shown as numbers (percentage), or medians (interquartile range (25PI;75PI)).
1n=3 missing;2n=3 miss;3n=2 miss;4n=6 missing;5n=7 miss;6n=5 miss NA =not applicable.
Abbreviations: PwMS =Persons with Multiple Sclerosis; Pw/oMS =Persons without Multiple Sclerosis; MDD =Major Depressive Disorder; BDI-FS =Beck Depression Inventory-Fast Screen for Medical Patients; WHO =World Health Organization.
a Weighted relative percentage according to ZInEP stratification.
Journal of Psychosomatic Research 144 (2021) 110402
5 of depression and MS, BDI-FS scores and the WHO-Five Well-being index was only available for PwMS: 58% of the group of PwMS reached the threshold for clinically relevant depressive symptomatology; more than half (54%) of the PwMS confirmed that the depression occurred after the MS diagnosis, while around one third responded that the depression occurred both before and after the MS diagnosis; and 54% of the PwMS had a poor well-being (Table 2).
The MS characteristics (such as MS form, time since MS diagnosis, disease modifying therapies (DMT), current relapses, EDSS proxy mea- sure, MS symptoms and mobility) and health-related quality of life of depressed PwMS compared to non-depressed PwMS are depicted in the Supplementary material (see “Table 1. docx”). Depressed PwMS re- ported a significantly lower health-related quality of life and a signifi- cantly higher frequency of symptoms with a substantial individual burden such as fatigue or weakness.
3.2. MDD subtypes and depression symptoms based on DSM-5
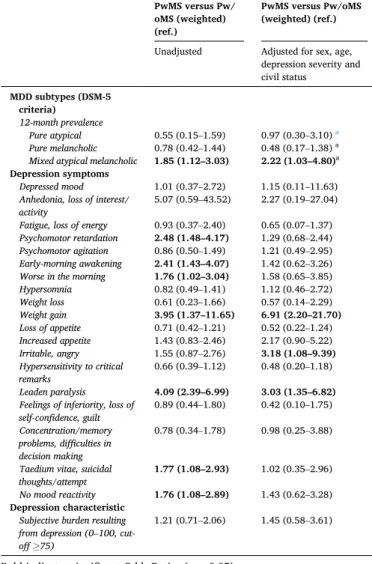
Table 3 displays the unadjusted and adjusted ORs with 95% CI from the univariable and multivariable logistic regression analyses focusing
on pure and mixed MDD subtypes and depression symptoms according to DSM-5. The risk for PwMS to fulfill the criteria for the mixed atypical- melancholic MDD subtype was around twofold higher in comparison to Pw/oMS.
Regarding specific depression symptoms, the PwMS depicted a higher risk for the depression symptoms ‘weight gain’ being ‘irritable, angry’, and ‘leaden paralysis’ (i.e., heavy, leaden feelings in arms or legs) after adjustment. The depression symptoms ‘weight gain’ and
‘leaden paralysis’ associated with PwMS represent somatic atypical MDD subtype criteria, however, the full set of criteria (pure atypical MDD subtype) did not significantly differ between the samples (Table 3).
These results also remained stable even after additional adjustment for the not significantly differing sociodemographic variables education, urbanicity, and nationality, and antidepressant or psychotherapy treat- ment (overall), as well as DMT (PwMS) (data not shown).
The higher risk for ‘psychomotor retardation’, ‘early-morning awakening’, ‘worse in the morning’, ‘taedium vitae, suicidal thoughts/
attempt’, and ‘no mood reactivity’ in PwMS was no longer significant after adjustment (Table 3).
3.3. Depression subtypes derived by LCA 3.3.1. Selection of a LCA model
For the selection of a final LCA model, the statistical fit indices, the aspect of parsimony and the theoretical interpretability were taken into account. Based on the combination of optimal statistical fit indices and the aspect of parsimony, the two-, three-, and four class LCA models were chosen for further consideration (Table 4). For more insight into the theoretical interpretability, these LCA models were plotted (Figures not shown): in the two-class model, the two latent classes mainly differentiated between more and less severe depression. From the three-class model on, the hypothesized theoretical framework with atypical and melancholic depression profiles were discriminable. The four-class model, however, led to extreme and clinically not meaningful estimates (so called boundary estimates). Under consideration of all these statistical and theoretical aspects, the three-class model was therefore chosen and implemented in further analyses.
3.3.2. Labeling of the three latent classes
Fig. 2 depicts the selected three-class LCA model. The different colored plots show the estimated probabilities (y-axis: 0 to 1) of the three classes manifesting the corresponding depression symptom (x- axis). This thus provided class-specific depression symptom profiles on all depression symptoms. In other words, every class contained a group of persons with similar depression symptom profiles and the three plots represent the overall depression symptom profiles of classes one to three. In this three-class LCA model, two severe classes (class 1 (blue) and class 2 (red)) with high probabilities for most depression symptoms were distinguishable from the less severe class (class 3 (green)): The Table 3
Odds ratios and confidence intervals (95%) from univariable and multivariable logistic regressions for the overall MDD sample (n =369) depicting the risk of persons with MS (PwMS) versus persons without MS (Pw/oMS) to show a spe- cific MDD subtype and depression symptom.
PwMS versus Pw/
oMS (weighted) (ref.)
PwMS versus Pw/oMS (weighted) (ref.) Unadjusted Adjusted for sex, age,
depression severity and civil status
MDD subtypes (DSM-5 criteria) 12-month prevalence
Pure atypical 0.55 (0.15–1.59) 0.97 (0.30–3.10) a
Pure melancholic 0.78 (0.42–1.44) 0.48 (0.17–1.38) a
Mixed atypical melancholic 1.85 (1.12–3.03) 2.22 (1.03–4.80)a Depression symptoms
Depressed mood 1.01 (0.37–2.72) 1.15 (0.11–11.63)
Anhedonia, loss of interest/
activity 5.07 (0.59–43.52) 2.27 (0.19–27.04)
Fatigue, loss of energy 0.93 (0.37–2.40) 0.65 (0.07–1.37) Psychomotor retardation 2.48 (1.48–4.17) 1.29 (0.68–2.44) Psychomotor agitation 0.86 (0.50–1.49) 1.21 (0.49–2.95) Early-morning awakening 2.41 (1.43–4.07) 1.42 (0.62–3.26)
Worse in the morning 1.76 (1.02–3.04) 1.58 (0.65–3.85)
Hypersomnia 0.82 (0.49–1.41) 1.12 (0.46–2.72)
Weight loss 0.61 (0.23–1.66) 0.57 (0.14–2.29)
Weight gain 3.95 (1.37–11.65) 6.91 (2.20–21.70)
Loss of appetite 0.71 (0.42–1.21) 0.52 (0.22–1.24)
Increased appetite 1.43 (0.83–2.46) 2.17 (0.90–5.22)
Irritable, angry 1.55 (0.87–2.76) 3.18 (1.08–9.39)
Hypersensitivity to critical
remarks 0.66 (0.39–1.12) 0.48 (0.20–1.18)
Leaden paralysis 4.09 (2.39–6.99) 3.03 (1.35–6.82)
Feelings of inferiority, loss of
self-confidence, guilt 0.89 (0.44–1.80) 0.42 (0.10–1.75) Concentration/memory
problems, difficulties in decision making
0.78 (0.34–1.78) 0.98 (0.25–3.88)
Taedium vitae, suicidal
thoughts/attempt 1.77 (1.08–2.93) 1.02 (0.35–2.96)
No mood reactivity 1.76 (1.08–2.89) 1.43 (0.62–3.28)
Depression characteristic Subjective burden resulting from depression (0–100, cut- off ≥75)
1.21 (0.71–2.06) 1.45 (0.58–3.61)
Bold indicates significant Odds Ratios (p <0.05).
Abbreviations: MDD =Major Depressive Disorder; ref.: reference.
aNo adjustment for depression severity as number of symptoms is an inherent feature of the mixed and pure depression subtype diagnoses.
Table 4
Model fit indices derived from unconditional latent class analysis with classes ranging from 1 to 5 based on the overall MDD sample (n =369) including persons with MS (PwMS) (n =92) and persons without MS (Pw/oMS) (n =277).
Fit statistics Class 1 Class 2 Class 3 Class 4 Class 5 AIC 7615.214 7473.845 7441.327 7416.552 7404.213 BIC 7693.429 7634.187 7683.797 7741.148 7810.936 ABIC 7629.977 7504.109 7487.092 7477.818 7480.980
Entropy N/A 0.570 0.704 0.770 0.803
LMR-LRT,
adj. N/A p <0.001 p =0.1184 p =0.1606 p =0.4458 NA, not applicable.
Abbreviations: MDD =Major Depressive Disorder; AIC =Akaike Information Criterion; BIC =Bayesian Information Criterion; ABIC =Sample-Size Adjusted Bayesian Information Criterion; LMR-LRT adj. =Lo-Mendell-Rubin likelihood ratio test, adjusted.
S. Rodgers et al.
estimated probabilities illustrate that the severe class 1 (n = 151) showed a predominantly melancholic depression symptom profile, therefore it was labeled ‘melancholic’. In contrast, the severe class 2 (n
=86) included individuals with both high probabilities of atypical, i.e., reversed vegetative depression symptoms, and melancholic depression features. Due to its mixed symptom profile, this class was labeled ‘mixed atypical-melancholic’. Finally, class 3 (n =132) was labeled ‘moderate’
as its depression symptom profile was characterized by less severity, that is, lower probabilities for most depression symptoms.
3.3.3. Overall: characterization of the three latent classes
Relevant characteristics of the three latent classes of the overall sample of subjects with MDD are shown in Table 5. PwMS and women had a higher risk of belonging to the ‘mixed atypical-melancholic’ class.
Both severe classes (‘mixed atypical-melancholic’ and ‘melancholic’) were additionally associated with more antidepressants or psychother- apy treatment in comparison to the moderate class. However, neither age nor civil status were significantly associated with one of the severe latent classes (Table 5).
3.3.4. PwMS: characterization of the three latent classes
Focusing only on PwMS, the ‘melancholic’ class but not the ‘mixed atypical-melancholic’ class was associated with a significantly higher risk for clinically relevant depressive symptomatology assessed by the BDI-FS compared to the ‘moderate’ class (Table 6). Both severe classes were associated with a high subjective burden resulting from depres- sion. In contrast, female sex and antidepressant or psychotherapeutic treatment were not significantly associated with the ‘melancholic’ or the
‘mixed atypical-melancholic’ classes. Also with regard to the MS-related variables time since MS diagnosis, total number of relapses, and EDSS proxy measure, no significant associations characterizing the ‘melan- cholic’ or the ‘mixed atypical-melancholic’ class were found (Table 6).
4. Discussion
This nationwide Swiss MS registry study provides new important insight into MDD in PwMS by characterizing and comparing MDD subtypes and depression symptoms with a community-based sample of depressed Pw/oMS. We found that MDD in PwMS was characterized by a higher risk of somatic atypical depression symptoms, but not for the pure atypical MDD subtype. Moreover, we demonstrated for the first time that the mixed atypical-melancholic MDD subtype was linked to PwMS. This MDD subtype occurred in 50% of all PwMS and comprised a high overlap with MS-inherent disease characteristics, thus representing a particular challenge from a diagnostic point of view.
4.1. MDD subtypes
PwMS were more likely than Pw/oMS to develop the mixed atypical- melancholic MDD subtype (i.e., fulfilling the criteria for both the Fig. 2.Unconditional three-class model derived from latent class analysis on the overall MDD sample (n =369).
Table 5
Odds ratios and confidence intervals (95%) from multivariable multinomial logistic regressions characterizing the empirically derived latent classes on the overall MDD sample (n =369).
Melancholic (n ¼ 151)
versus moderate (n
¼132) (ref.)
Mixed atypical- melancholic (n ¼86) versus moderate (n ¼ 132) (ref.) MS Diagnosis
Persons with MS (PwMS) 1.74 (0.74–4.08) 2.59 (1.01–6.64) Persons without MS (Pw/
oMS) ref. ref.
Socio-demographics Sex
Women 0.97 (0.58–1.61) 1.93 (1.03–3.59)
Men ref. ref.
Age 0.99 (0.96–1.02) 0.97 (0.94–1.01)
Civil status
Other 1.63 (0.92–2.90) 1.76 (0.89–3.47)
Married, registered
partnership ref. ref.
Depression characteristics Antidepressants or psychotherapy
yes 3.47 (2.09–5.77) 2.28 (1.27–4.09)
no ref. ref.
Bold indicates significant Odds Ratios (p <0.05).
Missing latent classes: melancholic: n =1.
Abbreviations: MDD =Major Depressive Disorder; MS =Multiple Sclerosis;
PwMS =Persons with Multiple Sclerosis; Pw/oMS =Persons without Multiple Sclerosis; ref.: reference.
Journal of Psychosomatic Research 144 (2021) 110402
7 atypical and the melancholic depression subtypes), which is in line with our hypothesis. This was not only shown by the subtyping of pure versus mixed DSM-5 criteria, but also successfully replicated by the data-driven approach.
The occurrence of the severe mixed atypical-melancholic MDD sub- type in half of all PwMS is in parallel with earlier work on Pw/oMS showing that this subtype is common. Moreover, these studies found more comorbid disorders, higher depression severity, and a female preponderance of this MDD subtype [33,34,44]. Evidence regarding the high depression severity of this MDD subtype was reflected in its defi- nition requiring the criteria of two different MDD subtypes, and by the fact, that it was clearly distinguishable from a MDD subtype with moderate severity in the data-driven approach. Such severity differences of MDD subtypes are consistent with previous studies demonstrating that apart from symptom patterns, also severity contributes to explain the heterogeneity of MDD [e.g., 45, 52, 60, 61].
The mixed atypical-melancholic MDD subtype was particularly characterized by a large number of somatic depression symptoms. In fact, this MDD subtype showed a remarkably high overlap with inherent features of the MS disease, such as ‘psychomotor retardation’, ‘sleep disturbances’, and ‘leaden paralysis’. Accordingly, one might assume that the mixed atypical-melancholic MDD subtype mainly reflects a higher MS-inherent disability. However, this was not indicated in our results among PwMS as the EDSS proxy measure [62], time since MS diagnosis and total number of relapses did not differ between the severe and moderate MDD subtypes. Considering the high probability of
somatic depression symptoms in the mixed atypical-melancholic MDD subtype, we found that the screening instruments commonly applied for PwMS were somewhat limited due to the exclusion of somatic depres- sion symptoms as in the BDI-FS [5]. We do not question the appropri- ateness of the BDI-FS as a screening instrument for PwMS, it is simply less sensitive with respect to this particular MDD subtype in our study despite the high subjective burden and high probabilities for the main, non-somatic MDD criteria and ‘suicidality’ of these persons. Conse- quently, an accurate depression diagnosis might present a particular challenge within PwMS with the mixed atypical-melancholic MDD subtype bearing the risk of false negatives in clinical practice. The alternative explanation that PwMS more often develop mixed atypical- melancholic depression states merely due to the preponderance of women [44] is insufficient in this study, as the association remained significant even after adjustment for sex. In fact, this is a remarkable finding. We speculate that the high occurrence of the mixed atypical- melancholic MDD subtype in PwMS might be the result of, multicausal factors (such as inflammatory processes, reactive depression since the MS diagnosis and during the progression of the disease, collateral depression due to neuroinflammation /− degeneration) manifesting in a mixed rather than a pure MDD subtype. In any case, this MDD subtype, which not yet been categorized in DSM-5, deserves more attention in future research.
Contrary to our expectations, the atypical MDD subtype was neither more prevalent in PwMS nor replicated in the data-driven approach.
However, as the pure MDD subtype derived by the DSM-5 criteria depicted the smallest group of depressives, it was probably statistically incorporated in the mixed atypical-melancholic MDD subtype in the three-class LCA solution of the data-driven approach. Therefore, our result distinguishing between pure and mixed MDD subtypes was in accordance with the study of Boeschoten et al. [29] not finding any difference of atypical depression clusters between PwMS and Pw/oMS, but at the level of depression symptoms.
4.2. Depression symptoms
In contrast to the lacking prevalence differences between PwMS and Pw/oMS relating to the atypical MDD subtype, differences were present in terms of atypical depression symptoms. Hence, this finding partially added weight to our hypothesis, as we also expected more atypical symptoms in PwMS compared to Pw/oMS. In our study, PwMS yielded a higher risk for the two somatic atypical depression symptoms ‘leaden paralysis’ and ‘weight gain’ and the symptom ‘irritable/angry’. These symptoms were all especially pronounced in the mixed atypical- melancholic MDD subtype. Thus, our results corroborate previous findings by highlighting the relevance of somatic or neurovegetative depression symptoms in PwMS [22–25]; this held also after adjustment for sex, age, civil status and depression severity.
In contrast to Boeschoten et al. [29], ‘leaden paralysis’ thus reached the level of significance even after adjustment in the current study. In several other reports, information on ‘leaden paralysis’ was lacking, as depression symptoms were assessed by the BDI omitting this symptom [22–24,27,28]. Although ‘leaden paralysis’ has been defined as a core feature of atypical depression in several concepts [63], this symptom is particularly difficult to disentangle from MS-related fatigue and de- serves more attention in this specific population. Concerning the higher occurrence of ‘weight gain’, the finding of a recent study [64] is inter- esting: the leading symptom for the association between depression and inflammatory and metabolic markers was ‘increased appetite’.
‘Increased appetite’ correlates to ‘weight gain’. However, it remains uncertain whether a comparable association with inflammation would occur for ‘weight gain’. Again our finding differed from another study [29] where ‘weight gain’ was not associated with MS. This might result from the different time-frames considered for the assessment of the depression symptoms: past week interval in the latter study [29], past 12-months in the current study.
Table 6
Odds ratios and confidence intervals (95%) from multivariable multinomial logistic regressions restricted to the sample of PwMS (n =92) characterizing the empirically derived latent classes on the overall MDD sample (n =369).
Melancholic (n ¼38) versus moderate (n ¼ 29) (ref.)
Mixed atypical- melancholic (n ¼25) versus moderate (n ¼29) (ref.)
Socio-demographics Sex
Women 4.43 (0.61–32.20) 2.83 (0.35–23.03)
Men ref. ref.
Depression characteristics BDI-FS
Clinically relevant depressive symptomatology
6.30 (1.42–27.91) 3.08 (0.65–14.64)
Antidepressants or Psychotherapy
yes 3.26 (0.74–14.35) 1.56 (0.32–7.48)
no
Subjective burden resulting from depression
0–100 1.05 (1.00–1.11) 1.08 (1.02–1.14)
MS characteristics Time since MS
diagnosis 0.99 (0.92–1.07) 0.99 (0.91–1.08) Relapsesa
(total number, lifetime) 0.96 (0.86–1.07) 0.95 (0.85–1.06) EDSS proxy measureb
(cut-off: ≥4) 0.63 (0.12–3.42) 0.62 (0.10–3.75)
Bold indicates significant Odds Ratios (p <0.05).
Abbreviations: MDD =Major Depressive Disorder; BDI-FS =Beck Depression Inventory-Fast Screen for.
Medical Patients; PwMS =Persons with Multiple Sclerosis; EDSS =Expanded Disease Status Scale.
aWithout n =8 persons with PPMS.
b (Kaufmann et al., 2020) Kaufmann M, Salmen A, Barin L, et al. (2020) Development and validation of the self-reported disability status scale (SRDSS) to estimate EDSS-categories. Mult Scler Relat Disord 42: doi:https://doi.org/10 .1016/j.msard.2020.102148.
S. Rodgers et al.
Apart from the two somatic atypical depression features, the symp- tom ‘irritable/angry’ was also more frequently present in depressed PwMS than in depressed Pw/oMS. This symptom does not belong to the regular MDD criteria. However, studies have emphasized that it char- acterizes depression in PwMS, which is possibly explainable by MS- related cerebral changes crucial for the maintenance of cognitive as well as emotional stability [12,25,65–68].
4.3. Limitations
This research is subject to several limitations. First, a limitation pertains to the general recall bias of self-reported data. Second, the Mini- SPIKE was applied as a self-rating questionnaire due to the general methodological approach of the SMSR. Thus, MDD prevalence in PwMS is expected to be underestimated in the SMSR since prevalence rates of mental disorders are likely lower if not assessed in face-to-face settings.
Third, information on further psychopathological comorbidities, such as bipolar depression, has been omitted in this analysis despite its rele- vance in atypical depression [69]. Notably, the symptom ‘irritable/
angry’ is relevant in bipolar disorders [70], but also within the pre- menstrual syndrome [71]. Finally, the cross-sectional design hinders causal conclusions concerning the temporal order of MDD, depression symptoms and MS.
4.4. Conclusions and outlook
The results of our study indicated that differences in MDD between PwMS and Pw/oMS resulted from the higher risk of PwMS for somatic atypical depression symptoms and the mixed atypical-melancholic MDD subtype. However, we found no differences between PwMS and Pw/oMS regarding the pure atypical MDD subtype. In fact, the somatic atypical depression symptoms were particularly pronounced in the mixed atypical-melancholic MDD subtype. As inflammation represents a core biological correlate of atypical depression [39] we thus cannot ascertain that MDD in PwMS may be linked to the MS-disease inherent inflam- mation. Even though immunological anomalies were judged to explain only a small proportion of the overall variance between MDD and MS [72], additional research on this topic is required. Important evidence was gained pertaining to the mixed atypical-melancholic MDD subtype:
this group depicted a high overlap with MS features and thus represents a particular diagnostic challenge for health-care professionals. We cannot provide any etiopathogenetic explanations for the predominance of the mixed atypical-melancholic MDD subtype in PwMS nor clearly assign the overlapping features to either disease. However, we conclude that these features are obviously constitutive for this MDD subtype in PwMS and, moreover, crucially associated with high subjective burden.
These research findings are important for the persons comorbidly affected by the two heterogeneous disorders MS and MDD. Last but not least, these results may provide the basis for advancing more specific pharmacological and psychological treatment strategies.
Funding
This work was supported by the Swiss Multiple Sclerosis Society. The first author was financially supported by a grant from the Hartmann- Müller Foundation.
Declaration of competing interest
The author(s) disclosed receipt of the following financial support for the research, authorship, and/or publication of this article:
Stephanie Rodgers, Pasquale Calabrese, Vladeta Ajdacic-Gross, Nina Steinemann, Marco Kaufmann, Zina-Mary Manjaly, Jürg Kesselring, Christian P. Kamm, Jens Kuhle, Claudio Gobbi, Stefanie Müller and Viktor von Wyl declare that there is no conflict of interest.
Anke Salmen received speaker honoraria and/or travel
compensation for activities with Almirall Hermal GmbH, Biogen, Merck, Novartis, Roche, and Sanofi Genzyme and research support by the Swiss MS Society, none related to this work.
Chiara Zecca received honoraria for speaking, consulting fees, or research grants from Abbvie, Almirall, Biogen Idec, Celgene, Genzyme, Merck, Novartis, Teva Pharma, Roche.
Andrew Chan has served on advisory boards for, and received funding for travel or speaker honoraria from, Actelion-Janssen, Almirall, Bayer, Biogen, Celgene, Sanofi-Genzyme, Merck, Novartis, Roche, and Teva, all for hospital research funds; and research support from Biogen, Genzyme and UCB. A. Chan is associate editor of the European Journal of Neurology and serves on the editorial board for Clinical and Trans- lational Neuroscience and as topic editor for the Journal of International Medical Research.
Acknowledgements
We thank all participants who participated in the SMSR survey and the epidemiology survey of ZInEP.
The authors wish to thank the Swiss Multiple Sclerosis Society for funding the Swiss MS Registry (SMSR). Moreover, we thank the study participants who not only contributed data but who are also absolutely instrumental in all aspects of study design and conduct of the Swiss Multiple Sclerosis Registry. We further thank the members of the SMSR Data Centre at the Epidemiology, Biostatistics & Prevention Institute of the University of Zurich.
Members of the SMSR are: Bernd Anderseck, Pasquale Calabrese, Andrew Chan, Claudio Gobbi, Roger H¨aussler, Christian P. Kamm, Jürg Kesselring (President), Jens Kuhle (Chair of Clinical and Laboratory Research Committee), Roland Kurmann, Christoph Lotter, Marc Lutz, Kurt Luyckx, Patricia Monin, Stefanie Müller, Krassen Nedeltchev, Caroline Pot, Milo A. Puhan, Irene Rapold, Anke Salmen, Klaas Enno Stephan, Zina-Mary Manjaly, Claude Vaney (Chair of Patient- and Population Research Committee), Viktor von Wyl (Chair of IT and Data Committee), Chiara Zecca.
The Swiss MS Registry is supported by the scientific advisory board of the Swiss MS Society.
Appendix A. Supplementary data
Supplementary data to this article can be found online at https://doi.
org/10.1016/j.jpsychores.2021.110402.
References
[1] R.A. Marrie, S.B. Patten, H. Tremlett, C. Wolfson, S. Warren, L.W. Svenson, N. Jette, J. Fisk, For, the, CIHR, Team, in, the, Epidemiology, and, Impact, of, Comorbidity, on, Multiple, Sclerosis, Sex differences in comorbidity at diagnosis of multiple sclerosis: A population-based study, Neurology 86 (14) (2016) 1279–1286.
[2] R.C. Kessler, P. Berglund, O. Demler, R. Jin, K.R. Merikangas, E.E. Walters, Lifetime prevalence and age-of-onset distributions of DSM-IV disorders in the National Comorbidity Survey Replication, Arch. Gen. Psychiatry 62 (6) (2005) 593–602.
[3] G. Parker, Through a glass darkly: the disutility of the DSM nosology of depressive disorders, Can. J. Psychiatr. 51 (14) (2006) 879–886.
[4] J. Alonso, M.C. Angermeyer, S. Bernert, R. Bruffaerts, T.S. Brugha, H. Bryson, G. de Girolamo, R. Graaf, K. Demyttenaere, I. Gasquet, J.M. Haro, S.J. Katz, R.C. Kessler, V. Kovess, J.P. Lepine, J. Ormel, G. Polidori, L.J. Russo, G. Vilagut, J. Almansa, S. Arbabzadeh-Bouchez, J. Autonell, M. Bernal, M.A. Buist-Bouwman, M. Codony, A. Domingo-Salvany, M. Ferrer, S.S. Joo, M. Martinez-Alonso, H. Matschinger, F. Mazzi, Z. Morgan, P. Morosini, C. Palacin, B. Romera, N. Taub, W.A. Vollebergh, EsemeD/Mhedea, Investigators, European, Study, of, the, Epidemiology, of, Mental, Disorders, Project, Prevalence of mental disorders in Europe: results from the European Study of the Epidemiology of Mental Disorders (ESEMeD) project, Acta Psychiatr. Scand. Suppl. 420 (2004) 21–27.
[5] A. Feinstein, S. Magalhaes, J.F. Richard, B. Audet, C. Moore, The link between multiple sclerosis and depression, Nat. Rev. Neurol. 10 (9) (2014) 507–517.
[6] S.B. Patten, R.A. Marrie, M.G. Carta, Depression in multiple sclerosis, Int. Rev.
Psychiatry 29 (5) (2017) 463–472.
[7] K.H. Jones, D.V. Ford, P.A. Jones, A. John, R.M. Middleton, H. Lockhart-Jones, L.
A. Osborne, J.G. Noble, A large-scale study of anxiety and depression in people