DOI 10.1007/s00410-015-1127-6 ORIGINAL PAPER
Peralkaline felsic magmatism at the Nemrut volcano, Turkey:
impact of volcanism on the evolution of Lake Van (Anatolia) IV
Ray Macdonald1,2 · Mari Sumita3 · Hans‑Ulrich Schmincke3 · Bogusław Bagin´ski1 · John C. White4 · Sławomir S. Ilnicki1
Received: 14 August 2014 / Accepted: 27 February 2015
© The Author(s) 2015. This article is published with open access at Springerlink.com
interpreted as having exsolved from the intermediate-rhy- olitic magmas.
Keywords Nemrut volcano · Peralkaline magmatism · Magma mixing · Open-system
Introduction
The majority of igneous suites containing peralkaline silicic members are essentially basalt-driven systems, in the sense that basalt has been the parental magma from which more evolved rocks have been derived, or has provided the heat source for partial melting of various crustal rocks (Mahood and Baker 1986; Bohrson and Reid 1997; Macdonald 2012). Considerable research effort has been focussed, therefore, on the primary role of basalt and has tried to evaluate the various factors that lead to peralkaline silicic end points, particularly the polybaric fractionation histo- ries. Approaches can be broadly divided into three types.
In one-stage models, the peralkaline melts are formed dominantly by fractional crystallisation of basaltic paren- tal magmas (Barberi et al. 1975; Civetta et al. 1998; Pec- cerillo et al. 2003; Macdonald et al. 2008a, b; White et al.
2009; Neave et al. 2012; Rooney et al. 2012). Two-stage models for the origin of peralkaline silicic rocks usually involve partial melting of (underplated?) basalts to form peralkaline trachyte, followed by fractional crystallisation of the trachyte to form peralkaline rhyolites (Lowenstern and Mahood 1991; Bohrson and Reid 1997; Trua et al.
1999; Avanzinelli et al. 2004). In the third type of model, the formation of the peralkaline melts is by partial melt- ing of continental crust; basalt does not directly contribute to melt production but may be the heat source promoting the melting (Bailey and Macdonald 1970; Macdonald et al.
Abstract Nemrut volcano, adjacent to Lake Van (Tur- key), is one of the most important peralkaline silicic cen- tres in the world, where magmatism for ~570,000 years has been dominated by peralkaline trachytes and rhyolites.
Using onshore and Lake Van drill site tephra samples, we document the phenocryst and glass matrix compositions, confirming a complete spectrum from very rare mafic to dominantly silicic magmas. Magma mixing has been com- mon and, along with the multi-lineage nature of the mag- mas, indicates that Nemrut has been a very open system where, nevertheless, compositionally zoned caps devel- oped during periods of relative eruptive quiescence. Geo- thermometry suggests that the intermediate-silicic magmas evolved in an upper crustal magma reservoir at tempera- tures between 1100 and 750 °C, at fO2 close to the FMQ buffer. The silicic magmas either were halogen poor or exsolved a halogen-rich phase prior to or during eruption.
An unusual Pb-rich phase, with up to 98.78 wt% PbO, is
Communicated by Othmar Müntener.
Electronic supplementary material The online version of this article (doi:10.1007/s00410-015-1127-6) contains supplementary material, which is available to authorized users.
* Ray Macdonald
r.macdonald@lancaster.ac.uk
1 IGMP Faculty of Geology, University of Warsaw, Z˙wirki i Wigury 93, 02-089 Warsaw, Poland
2 Environment Centre, Lancaster University, Lancaster LA1 4YQ, UK
3 Geomar Helmholtz Centre for Ocean Research Kiel, Wischhofstr. 1, 24148 Kiel, Germany
4 Department of Geography and Geology, Eastern Kentucky University, Richmond, KY 40475, USA
1987; White et al. 2006). Other processes, such as magma mixing and crustal contamination, may be involved in all three types of petrogenesis. In this paper, we explore vari- ous aspects of the origin and evolution of peralkaline erup- tive rocks at the Nemrut caldera volcano, Turkey.
Nemrut is the most active centre in Turkey. It has been the source of intense Plinian eruptions for >570,000 years, as documented by Sumita and Schmincke (2013a, b, c) and Schmincke et al. (2014) in stratigraphic traverses over an area of >6000 km2 mainly to the west of Lake Van and in drill cores of the 2010 ICDP Paleovan project (Fig. 1) (Litt et al. 2011). Magmatism has been dominated by metalumi- nous to peralkaline trachytes and rhyolites, and the possi-
into a tightly controlled stratigraphic framework gives the centre a special significance in the study of peralkaline fel- sic systems. Furthermore, Nemrut tephras are important in paleoclimate and archaeological research in lake studies not only in Turkey but in adjacent countries such as Arme- nia, Azerbaijan and Iran (Sumita and Schmincke 2013c).
Çubukçu et al. (2012) provided an extensive mineral- chemical and whole-rock geochemical database, and some age determinations, for Nemrut lavas and domes, using samples often difficult to place in a stratigraphic frame- work. Sumita and Schmincke (2013a, b, c) studied the stra- tigraphy, temporal evolution and whole-rock, matrix glass and phenocryst compositions of the volumetrically domi-
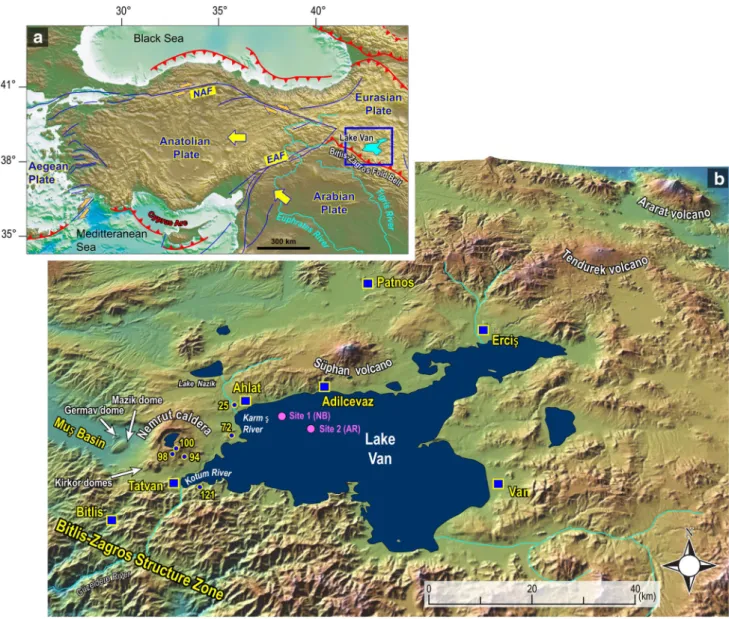
Fig. 1 a Overview map of Turkey, Anatolian, Eurasian and Arabian plates, with Lake Van just north of the collision zone. NAF North Anatolian Fault, EAF East Anatolian Fault. b Map of Lake Van and its surroundings, notably the Nemrut and Süphan volcanoes.
The Northern Basin (NB) and Ahlat Ridge (AR) coring stations are shown. Locality numbers correspond to the sampling localities of onshore samples. Map modified from Sumita and Schmincke (2013c)
Schmincke et al. (2014) studied in more detail the miner- alogy, glass compositions and volcanology of the Alleroed and Holocene drilled tephras from both Nemrut and the adjacent subalkaline Süphan volcano. We have selected a suite of tephra samples covering the compositional spec- trum from mugearite to peralkaline rhyolite, with which to study in greater depth mineral-chemical and melt (glass) compositional trends and to assess their significance for the evolution of the Nemrut magmatic system. Specifically, we (1) provide a complete series of melt compositions between mugearite and peralkaline rhyolite and comment on their significance for the existence of the Daly gap; (2) describe the P–T–fO2 conditions operative in the magma reservoir;
(3) assess the significance of alkali feldspar–glass relation- ships for the evolution of peralkaline silicic magmas; and (4) provide preliminary information on an unusual Pb-rich phase which may have exsolved from the Nemrut magmas.
Geological setting
Nemrut volcano is situated on the East Anatolian plateau, which is generally considered to have formed by the col- lision of the Arabian Peninsula with the Eurasian plate, leading to the uplift of an area exceeding 20,000 km2 (Fig. 1). The close relationships between tectonic and vol- canic events in the region have been discussed by Pearce et al. (1990), S¸enğor et al. (2003) and Keskin (2003, 2007).
Voluminous magma generation is thought to have been pro- moted by slab steepening and break-off in the Middle Mio- cene, suggesting that the mantle lithosphere is either very thin or absent beneath a considerable part of the area.
As a result of collision, the North Anatolian Block, bordered to the north by the right-lateral strike-slip North Anatolian Fault and to the south by the left-lateral East Anatolian Fault (Fig. 1), moved westwards, with the Mus¸
and adjacent Van basins being formed as pull-apart basins.
Since before 0.5 Ma, Nemrut volcano has been growing in the hinge zone between the two basins and may have been responsible for damming the huge Lake Van in the Van tec- tonic basin (Sumita and Schmincke 2013a). Çubukçu et al.
(2012) speculated that the peralkaline magmatism at Nem- rut was related to the ascent of asthenospheric partial melts into upper crustal levels under the Mus¸ basin, where pre- existing shear zones gained a strike-slip component leading to localised extension.
Volcanological framework
Although explosive activity at Nemrut may have started prior to ~600 ka, the oldest onshore deposits so far found, south of Lake Van, have recently been dated as ~570 ka (Sumita and Schmincke 2013a and unpublished data). These authors
have distinguished about forty widespread trachytic and rhyolitic fallout tephras and about twelve interbedded ign- imbrites and have subdivided the succession into three age groups, bound by widespread, distinctive tephra units. Group 1 (~405–200 ka) comprises some widespread fallout tephras and several ignimbrites. The deposits of Group 2 were emplaced between ~190 and 30 ka. The older date (~190 ka) is for AP-1, a huge rhyolitic Plinian fallout deposit overlain by a cogenetic ignimbrite with a combined magma volume (DRE; dense rock equivalent) of ~30 km3. The tephra section drilled at Lake Van also shows a major increase in Nemrut tephras starting at ~200 ka, suggesting that the increase in explosive volcanism of Nemrut at ~200 ka is real. Group 3 begins with the compositionally zoned Nemrut Formation (NF; 30 ka) which consists of several members in a complex sequence of fallout-surge-ignimbrite-surge-fallout deposits.
A prominent agglutinate and underlying trachytic fallout north of Tatvan, formerly correlated with NF (Sumita and Schmincke 2013c), is now correlated by us with the ~60 ka trachytic AP-6 (HP-10). The tephras of the Çekmece Forma- tion, previously thought by Sumita and Schmincke (2013c) to overlie NF are now thought to be older than NF. Details of the correlation are, however, still under study (see Fig. 2).
Three points made by Sumita and Schmincke (2013a, c) are relevant to the evolution of the Nemrut system. First, starting with AP-1 at ~190 ka, major eruptions appear to have occurred at intervals spaced some 20–40,000 years apart, which were interpreted as being the incubation times for the silicic magmas to develop into eruptible volumes.
Second, peralkalinity peaked at ~120 ka with the strongly peralkaline AP-4 but has decreased since. Third, the num- ber and frequency of large volume, mostly rhyolitic fall deposits, seem to have increased since ~300 ka, particularly with the large-volume AP-1 at ~190 ka. The increase in tephra output has remained high until the present.
In the spectrum of silicic caldera systems (Smith 1979), Nemrut is small- to medium-sized, as is typical of peral- kaline volcanoes (Mahood 1984; Macdonald 2012). The rhyolitic eruption rates (at intervals of ~20–40 ky) are simi- lar to other long-lived peralkaline volcanoes, such as Gran Canaria (Schmincke and Sumita 1998), whilst erupted tephra volumes are smaller. Among peralkaline centres, Baitoushan Volcano, situated in a continental rift setting straddling the North Korea–China border, is a close compo- sitional analogue to Nemrut (Horn and Schmincke 2000).
Baitoushan is a composite cone built largely of trachytic and comenditic lava flows, fallout and ignimbrites.
Samples and analytical methods
We have analysed in detail six tephra samples from onshore and six from the 219-m ICDP Lake Van drill core from Site
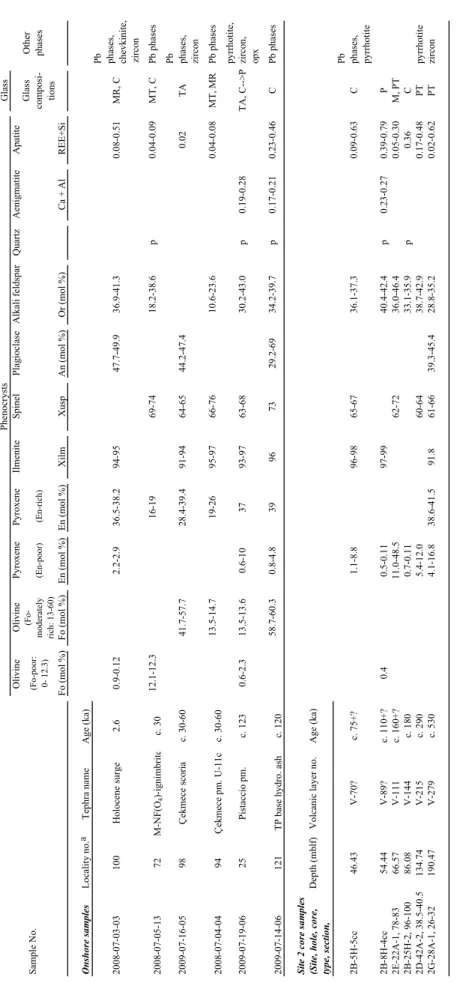
2, selected to cover the compositional range mugearite to peralkaline rhyolite (Figs. 1, 2). For further analyses of the main phenocryst phases from additional onshore and drilled tephra units, see Sumita and Schmincke (2013c) and Schmincke et al. (2014). Table 1 lists the sample numbers, their origin and their approximate age. The samples range in age from 2.6 to ~530 ka, covering much of the eruptive history of the volcano.
Mineral compositions were determined by electron microprobe at the Inter-Institute Analytical Complex at the Institute of Geochemistry, Mineralogy and Petrol- ogy, University of Warsaw, using a Cameca SX-100 microprobe equipped with three wavelength dispersive spectrometers. As an example of the analytical condi-
15 kV and the probe current 40 nA, with counting times of 20 s on peak and 10 s on each of two background posi- tions. The standards, crystals and X-ray lines used and generalised detection limits are given in the Appendix.
The “PAP”ϕ(ρZ) program (Pouchou and Pichoir 1991) was used for corrections. Analytical conditions for other minerals may be obtained from the authors. Apatite was analysed using the technique outlined in Macdonald et al.
(2008a). Estimates of analytical precision (1σ; wt%) for all phases except glass are: Si 0.07, Ti 0.03, Al 0.02, Cr 0.02, Ni 0.03, Fe 0.09, Mn 0.03, Mg 0.04, Ca 0.08, Na 0.01, K 0.01. For glass analyses, the values are Si 0.40, Ti 0.03, Al 0.14, Fe 0.29, Mn 0.12, Mg 0.02, Ca 0.03, Na 0.17, K 0.11, P 0.03, Cl 0.03, F 0.08. Averages and/
Fig. 2 Stratigraphic position of the analysed samples is shown for onshore samples in (a); modified from Sumita and Schmincke (2013c). The stratigraphic column (Site 2) for core samples (b) is taken from Stockhecke et al. (2014). Sample V-16 is from an older
piston core site (see Schmincke et al. 2014). Ages for onshore sam- ples were presented in Sumita and Schmincke (2013a). Ages for core samples are still approximate and will be presented in detail by Sum- ita and Schmincke (in prep.)
Table 1 Mineralogical summary of samples Glass Olivine OlivinePyroxenePyroxeneIlmeniteSpinelPlagioclaseAlkali feldsparQuartzAenigmatiteApatite (Fo-poor: 0- 12.3)(Fo- moderately rich: 13-60)
(En-poor) (En-rich) Fo (mol %)Fo (mol %)En (mol %)En (mol %)XilmXuspAn (mol %)Or (mol %)Ca + Al REE+Si Onshore samplesLocality no.aTephra nameAge (ka) C,RM15.0-80.03.14-9.639.94-7.7459-492.83-5.639.2-2.221.0-9.06.2egrusenecoloH00130-30-70-8002
Pb phases, chevkinite
, zircon 2008-07-05-1372M-NF(O4)-ignimbritec. 30sesahpbPC,TM90.0-40.0p6.83-2.8147-9691-613.21-1.21 AT20.04.74-2.4456-4649-194.93-4.827.75-7.1406-03.cairocsecemkeÇ8950-61-70-9002
Pb phases, zirco
n 2008-07-04-0494Çekmece pm. U-11cc. 30-60sesahpbPRM,TM80.0-40.06.32-6.0167-6679-5962-917.41-5.31 2009-07-19-0625Pistaccio pm.c. 1230.6-2.313.5-13.60.6-103793-9763-6830.2-43.0p0.19-0.28TA, C-->Ppyrrhotite, zircon
, opx 2009-07-14-06121TP base hydro. ashc. 12058.7-60.30.8-4.839967329.2-6934.2-39.7p0.17-0.210.23-0.46CPb phases Site 2 core samples (Site, hole, core, type, section,Depth (mblf)Volcanic layer no.Age (ka) C36.0-90.03.73-1.6376-5689-698.8-1.1?+57.c?07-V34.64cc5-H5-B2
Pb phases, pyrrhotite
P97.0-93.072.0-32.0p4.24-4.0499-7911.0-5.04.0?+011.c?98-V44.45cc4-H8-B2 TP,M03.0-50.04.64-0.6327-265.84-0.11?+061.c111-V75.6638-87,1-A22-E2 C63.0p9.53-1.3311.0-7.0081.c441-V80.68001-69,2-H52-B2 etitohrrypTP84.0-71.09.24-7.8346-060.21-4.5092.c512-V47.4315.04-5.83,2-A24-D2 nocrizTP26.0-20.02.53-8.824.54-3.9366-168.195.14-6.838.61-1.4035.c972-V74.09123-62,1-A82-G2
Other phasesSample No.
Phenocrysts Glass composi- tions Glass compositions: C, comendite; M, mugearite; MR, metaluminous rhyolite; MT, metaluminous trachyte; P, pantellerite; PT, peralkaline trachyte; TA, trachyandesite (mugearite/benmoreite); p, present a Localities from Sumita and Schmincke (2013a, c)
5, 6, 7 and 8; the full data set is given in Tables 1–4 in ESM.
Petrography
The rock nomenclature used here is based on the matrix glass composition; we acknowledge that the glass composi- tion in porphyritic samples will normally be more evolved than the whole-rock composition. The primary classifica- tion is from Le Bas et al. (1986) and the peralkaline tra- chytes and rhyolites are classified using the Macdonald (1974) scheme.
In detail, the Nemrut rocks are very complex. For example, whole rocks and matrix glasses described by Sumita and Schmincke (2013a, b, c) as broadly trachytic comprise silica-saturated and silica-undersaturated, and metaluminous and peralkaline varieties. Certain trachytic units were distinguished on the basis of trace element characteristics, such as high Ba and Sr. In the peralkaline rhyolites, Sumita and Schmincke (2013c) recognised three distinct assemblages including aenigmatite in addition to alkali feldspar and FeTi oxides; aenigmatite + quartz, aenigmatite + Fe-rich clinopyroxene + quartz and aen- igmatite + hedenbergite + fayalitic olivine. A fourth assemblage, aenigmatite + hedenbergite + fayalitic oli- vine + quartz, is added below (sample 2009-07-19-06).
These must represent different magmatic evolutionary paths. It would be valuable to relate phenocryst assem- blages to published whole-rock or glass compositions, but few analyses have so far been tied to specific mineral assemblages, especially for cored tephra samples whose volume is generally too small to allow bulk rock analyses of pumice clasts. The following discussion relates mainly, therefore, to our study samples. Mineral assemblages are given in Table 1. Textural details of analysed samples are given in the Tables in ESM.
The primary phenocryst assemblage in the mugearites and benmoreites is olivine (ol) + clinopyroxene (cpx) + plagioclase (plag) + ilmenite (ilm) + magnet- ite (mt) ± apatite (ap). Judging from the compositions of xenocrysts in some mixed magma rocks (below), ben- moreites mixed frequently with more felsic magmas.
The metaluminous and peralkaline trachytes contain ol + cpx + ilm + mt + alkali feldspar (af) + ap. As noted above, the rhyolites show several phenocryst assemblages;
a generalised assemblage is ol + cpx + af + ilm + mt + ap + quartz, joined, with increasing host-rock peralka- linity, by aenigmatite. Chevkinite-(Ce), zircon and pyrrho- tite microphenocrysts are present in some rocks (Table 1).
Mixed magma rocks can be recognised by containing matrix glasses of variable composition (e.g. 2009-07-19-06;
Table 1) and/or more than one phenocryst population, e.g.
the clinopyroxenes and feldspars in sample 2009-07-14-06.
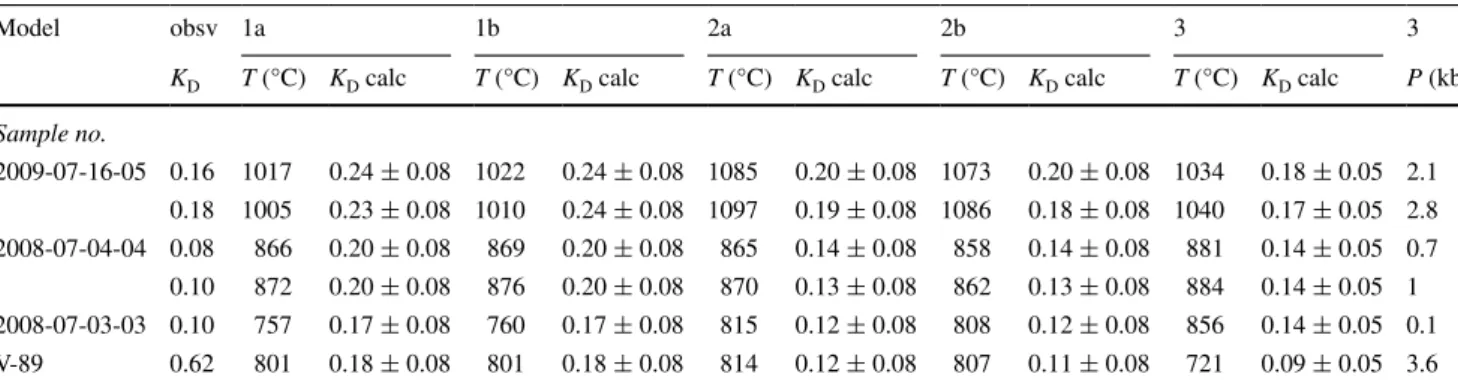
Olivine phenocrysts occur mainly as discrete, subhedral, slightly resorbed crystals up to 600 μm across, some with inclusions of FeTi oxides, zircon, apatite and chevkinite (Fig. 3a). Two types of clinopyroxene are distinguishable optically: a pale brown to colourless type in the benmore- ites and some trachytes, and a deep green variety in the more felsic rocks. In both, it occurs as euhedral to subhe- dral prisms, up to 1300 μm long, and as partly resorbed anhedral plates. The pyroxene may be included in olivine and plagioclase and itself commonly includes olivine, FeTi oxides, apatite and glass (melt) inclusions (Fig. 3b). Pla- gioclase phenocrysts in benmoreite sample 2009-07-16- 05 form anhedral plates up to 450 μm across. In mixed magma rocks, they tend to be smaller, occurring, for exam- ple, as tiny (few tens of μm) laths in dark glass in sam- ple V-279 (2G-28A-1, 26–32 cm). The dominant form of alkali feldspar phenocrysts occurs as euhedral to subhedral, partially resorbed plates up to 1250 μm across. Prismatic forms are less common. Rounded quartz phenocrysts occur in five samples, sometimes intergrown with alkali feldspar (Fig. 3c).
Ilmenite occurs mainly as euhedral to subhedral crys- tals, up to 150 μm across, associated with, or included in, olivine and clinopyroxene phenocrysts (Fig. 3b). Titano- magnetite, up to 500 μm across, is included in olivine and clinopyroxene phenocrysts but also in feldspar phenocrysts and as discrete crystals. Ilmenite and titanomagnetite are occasionally found enclosed in the same crystal. Aenigma- tite occurs as subhedral plates and prisms, up to 700 μm long.
Apatite microphenocrysts are mainly included in, or associated with, clinopyroxene phenocrysts (Fig. 3b), but also form inclusions in olivine (Fig. 3a), oxides and aen- igmatite and, more rarely, discrete crystals in glass. They vary from euhedral prisms, exceptionally 250 μm long, to rounded forms up to 70 μm across. Zoning is best devel- oped in the peralkaline rocks and includes both oscillatory and patchy types (Fig. 3d). Most commonly, bright (higher Z on BSE images) cores are rimmed by darker margins.
Zircon occurs as anhedral crystals, up to 50 μm across, included in olivine (Fig. 3a) and clinopyroxene (Fig. 3b) phenocrysts. Chevkinite-(Ce) has been positively identi- fied in sample 2008-07-03-03, where it occurs as rounded crystals (<50 μm) associated with zircon in clinopyrox- ene (Fig. 3a) and as a prism (93 μm long) attached to, and included in, olivine (Fig. 3a). We have also analysed chev- kinite in an additional sample, V-16 (VAN04-2-4-S4, 83.5–
84 cm; see Table 3 in ESM; core sample from 2004 expedi- tion—details are in Schmincke et al. 2014), where it forms small anhedral plates and subhedral prisms. Rounded FeS
inclusions are present in several rocks, most commonly as inclusions in clinopyroxene phenocrysts (Table 1), where analysed (sample 2009-07-19-06) the phase is pyrrhotite.
At least five samples contain unusual Pb-rich phases (Table 1), which, although superficially resembling amyg- dales, we interpret as having exsolved from magma. In comendite 2B-5H-5cc, the phase forms rounded to ellipsoi- dal “patches”, which, from the way in which they coalesce, were clearly deformable during melt movement. They did not grow in vesicles but rather resemble globules formed by liquid immiscibility (Fig. 4a). Perhaps the clearest evidence of the magmatic nature of at least some of the patches is shown in a feldspar crystal. In peralkaline rhyolite sample 2009-07-14-06 (Fig. 4b), a plagioclase xenocryst is com- plexly zoned from labradorite in the core (An69–61) through andesine (An50–48) to oligoclase (An29), with a return to labradorite (An60–52) at the rim. When the feldspar had reached andesine composition, there was precipitation of olivine (Fo60), clinopyroxene (Mg# ~56, where Mg# is magnesium number (Mg/(Mg + Fe2+)), titanomagnetite
and a Pb-bearing phase, now found as abundant, variably sized inclusions trapped in the feldspar. This was followed by mixing of the benmoreitic/trachytic magma with more mafic magma, as indicated by the labradoritic rim, with no further release of the Pb-rich phase, which is absent from the rim.
Phenocryst compositions Olivine
Compositions range from Fo59.2–0.4 (Table 1a in ESM), the Fo content decreasing with increasing host-rock SiO2 content and peralkalinity, as follows: mugearite Fo 57.7–
41.7, trachyte 14.7–13.5, rhyolites 2.3–0.4. Two popula- tions are present in 2007-07-19-06, Fo ~13.6 and ~5.0.
Sample 2008-07-05-13 contains both trachytic and rhy- olitic glasses; the analysed olivines are associated with the trachyte. MnO contents are up to 3.72 wt% (Tp 5.3),
Table 2 Representative compositions of clinopyroxene phenocrysts in Nemrut volcano
FeO*, all Fe as Fe2+ . Fe3+ and Fe2+ calculated from stoichiometry. Cr and V below detection in all samples. Textural details of all samples in Table 1b in ESM
Sample no./volcanic layer no. Core samples Onshore samples Core samples
V-70 V-89 2008-07-03-03 2007-07-16-05 2009-07-14-06 2008-07-04-04 V-111 V-215
SiO2 47.96 48.24 50.02 48.00 50.76 48.39 50.37 49.20 53.12 48.13
TiO2 0.39 0.29 0.28 0.25 1.08 0.38 0.49 0.36 0.19 0.44
Al2O3 0.19 0.07 0.54 0.16 2.31 0.30 1.11 0.74 2.03 0.48
FeO* 29.63 29.28 21.14 29.29 11.32 27.80 18.46 20.33 3.71 26.31
MnO 1.45 1.13 0.93 1.18 0.33 1.17 0.67 0.72 0.06 1.34
MgO 0.62 0.31 6.50 0.77 13.30 1.49 8.54 6.64 17.70 2.36
CaO 18.71 17.6 19.69 19.29 19.99 19.34 19.44 19.74 23.23 19.74
Na2O 0.90 2.10 0.42 0.60 0.35 0.61 0.31 0.37 0.17 0.48
Total 99.85 99.02 99.52 99.54 99.44 99.48 99.39 98.10 100.21 99.28
Formulae on basis of 6 oxygens
Si 1.989 2.012 1.987 1.992 1.921 1.993 1.971 1.978 1.935 1.977
Ti 0.012 0.009 0.008 0.008 0.031 0.012 0.014 0.011 0.005 0.014
Al 0.009 0.003 0.025 0.008 0.103 0.015 0.051 0.035 0.087 0.023
Fe2+ 1.027 1.021 0.702 1.017 0.358 0.958 0.604 0.683 0.113 0.904
Mn 0.051 0.040 0.031 0.041 0.011 0.041 0.022 0.025 0.002 0.047
Mg 0.038 0.019 0.385 0.048 0.750 0.091 0.498 0.398 0.961 0.144
Ca 0.831 0.787 0.838 0.858 0.811 0.854 0.815 0.850 0.907 0.869
Na 0.072 0.170 0.032 0.048 0.026 0.049 0.024 0.029 0.012 0.038
∑ cations 4.03 4.06 4.01 4.02 4.01 4.01 4.00 4.01 4.02 4.02
Ca 43.8 43.0 43.5 44.6 42.2 44.9 42.5 44.0 45.8 45.3
Mg 2.0 1.1 20.0 2.5 39.1 4.8 26.0 20.6 48.5 7.5
Fe 54.2 55.9 36.5 52.9 18.7 50.3 31.5 35.4 5.7 47.1
Fe3+ 0.090 0.180 0.026 0.060 0.029 0.036 0.001 0.025 0.065 0.049
Fe2+ 0.929 0.826 0.675 0.952 0.328 0.919 0.603 0.657 0.047 0.851
increasing with increasing Fa content. Levels of CaO are up to 0.61 wt%, and there is no correlation with Fo content.
Clinopyroxene
The full compositional range is from Ca45.8Mg48.5Fe5.7 to Ca42.7Mg0.5Fe56.8 (Table 2; Table 1b in ESM) (Fig. 5). The most magnesian compositions are found in the benmore- ites, often as crystal cores, and in mixed magma rocks.
Pyroxenes in trachytes and rhyolites are hedenbergite, with low Na contents (<0.2 apfu). Zoning is most pronounced in the benmoreites and metaluminous trachytes; one crystal in 2009-07-16-05 is zoned from Mg28.4–38.9, for example. In the salic rocks, zoning is usually ≤En2. Aluminium and Ti contents are low (≤0.131 and ≤0.042 apfu, respectively) and decrease with decreasing En content. In the benmore- ites and some trachytes, the pyroxenes have Na < Al and pyroxene crystallisation would tend to increase the peralka- linity of residual melts. In other trachytes and the rhyolites, Na exceeds Al and pyroxene crystallisation alone would tend to decrease the peralkalinity of residual melts, the so-called clinopyroxene effect of Scaillet and Macdonald (2003).
Orthopyroxene
Orthopyroxene (Wo2.9En54.5Fs42.6) forms the core to a rounded grain (160 × 120 μm) rimmed by clinopyroxene (Wo4.5En37.2Fs21.3) in sample 2009-07-19-06 (Table 1b in ESM). The orthopyroxene may be a xenocryst from wall rocks. However, there is some evidence that the phase may crystallize in alkaline suites. Freundt-Malecha et al. (2001) reported rare orthopyroxene (En75–70) in cognate syenogab- bro fragments in the Miocene rhyolitic–basaltic composite ignimbrite P1 on Gran Canaria, and orthopyroxene is also a common, although minor, phase in the basal ignimbrites of the Miocene peralkaline ignimbrite succession on Gran Canaria (Schmincke and Sumita 1998). In a series of exper- iments on a hawaiite, Nekvasil et al. (2004) found orthopy- roxene (En65–58) crystallizing in equilibrium with kaersutite at 9.3 kbar, T = 1040–1000 °C, at “high” water contents.
Rooney et al. (2012) found, during MELTS modelling, that the transition trachyte to rhyolite in the 3.1 Ma peralka- line Chefe Donsa phreatomagmatic deposits on the shoul- der of the Main Ethiopian Rift required minor amounts of orthopyroxene in the crystallizing assemblage, although the phase was not recorded modally. The possibility cannot be precluded that (some) Nemrut magmas passed through an
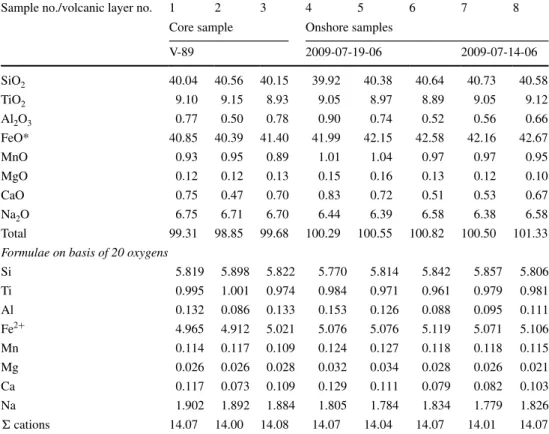
Table 3 Representative compositions of aenigmatite phenocrysts
Zn and Zr below detection in all analyses. FeO*, all Fe as Fe2+ . Sample descriptions: 1, 2, 3, subhedral phenocrysts up to 900 µm long, 4, 5, rim and core of slightly resorbed prism (700 × 250 µm); 6, anhedral grain; 7, 8, rim and core of partly fragmented crystal (625 × 350 µm)
Sample no./volcanic layer no. 1 2 3 4 5 6 7 8
Core sample Onshore samples
V-89 2009-07-19-06 2009-07-14-06
SiO2 40.04 40.56 40.15 39.92 40.38 40.64 40.73 40.58
TiO2 9.10 9.15 8.93 9.05 8.97 8.89 9.05 9.12
Al2O3 0.77 0.50 0.78 0.90 0.74 0.52 0.56 0.66
FeO* 40.85 40.39 41.40 41.99 42.15 42.58 42.16 42.67
MnO 0.93 0.95 0.89 1.01 1.04 0.97 0.97 0.95
MgO 0.12 0.12 0.13 0.15 0.16 0.13 0.12 0.10
CaO 0.75 0.47 0.70 0.83 0.72 0.51 0.53 0.67
Na2O 6.75 6.71 6.70 6.44 6.39 6.58 6.38 6.58
Total 99.31 98.85 99.68 100.29 100.55 100.82 100.50 101.33
Formulae on basis of 20 oxygens
Si 5.819 5.898 5.822 5.770 5.814 5.842 5.857 5.806
Ti 0.995 1.001 0.974 0.984 0.971 0.961 0.979 0.981
Al 0.132 0.086 0.133 0.153 0.126 0.088 0.095 0.111
Fe2+ 4.965 4.912 5.021 5.076 5.076 5.119 5.071 5.106
Mn 0.114 0.117 0.109 0.124 0.127 0.118 0.118 0.115
Mg 0.026 0.026 0.028 0.032 0.034 0.028 0.026 0.021
Ca 0.117 0.073 0.109 0.129 0.111 0.079 0.082 0.103
Na 1.902 1.892 1.884 1.805 1.784 1.834 1.779 1.826
Σ cations 14.07 14.00 14.08 14.07 14.04 14.07 14.01 14.07
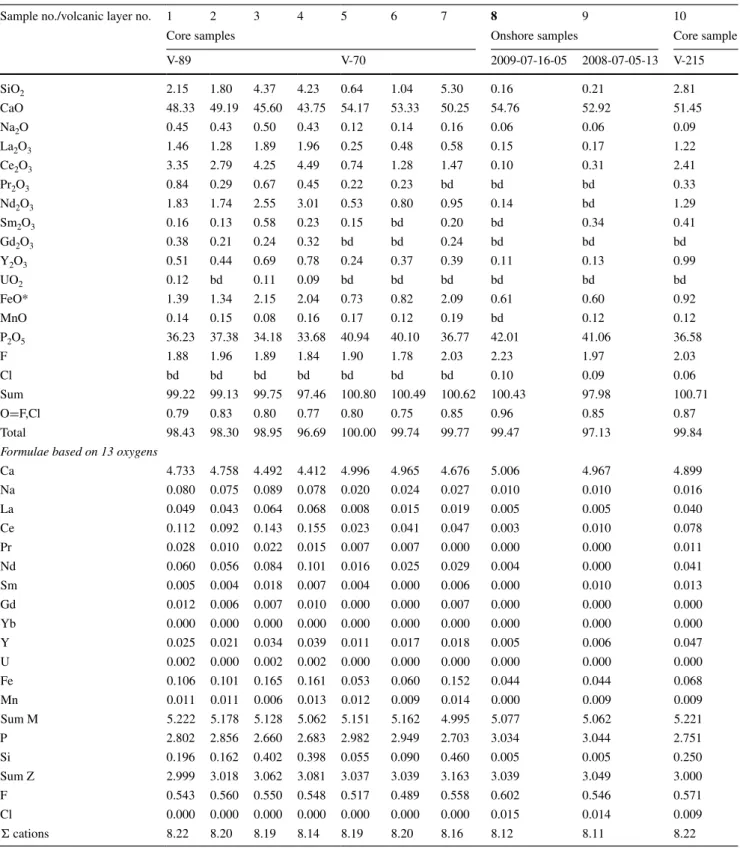
Table 4 Representative analyses of apatite
FeO*, all Fe as Fe2+ ; bd, below detection. Sample descriptions: 1–4, various zones in oscillatory zoned crystal (31 × 14 µm) in aenigmatite;
4–6, along prism in cpx; 7, cross section (32 × 19 µm) in cpx; 8, core in 67 × 27 µm crystal in cpx; 9, prism in titanomagnetite; 10, core, cross section in cpx
Sample no./volcanic layer no. 1 2 3 4 5 6 7 8 9 10
Core samples Onshore samples Core sample
V-89 V-70 2009-07-16-05 2008-07-05-13 V-215
SiO2 2.15 1.80 4.37 4.23 0.64 1.04 5.30 0.16 0.21 2.81
CaO 48.33 49.19 45.60 43.75 54.17 53.33 50.25 54.76 52.92 51.45
Na2O 0.45 0.43 0.50 0.43 0.12 0.14 0.16 0.06 0.06 0.09
La2O3 1.46 1.28 1.89 1.96 0.25 0.48 0.58 0.15 0.17 1.22
Ce2O3 3.35 2.79 4.25 4.49 0.74 1.28 1.47 0.10 0.31 2.41
Pr2O3 0.84 0.29 0.67 0.45 0.22 0.23 bd bd bd 0.33
Nd2O3 1.83 1.74 2.55 3.01 0.53 0.80 0.95 0.14 bd 1.29
Sm2O3 0.16 0.13 0.58 0.23 0.15 bd 0.20 bd 0.34 0.41
Gd2O3 0.38 0.21 0.24 0.32 bd bd 0.24 bd bd bd
Y2O3 0.51 0.44 0.69 0.78 0.24 0.37 0.39 0.11 0.13 0.99
UO2 0.12 bd 0.11 0.09 bd bd bd bd bd bd
FeO* 1.39 1.34 2.15 2.04 0.73 0.82 2.09 0.61 0.60 0.92
MnO 0.14 0.15 0.08 0.16 0.17 0.12 0.19 bd 0.12 0.12
P2O5 36.23 37.38 34.18 33.68 40.94 40.10 36.77 42.01 41.06 36.58
F 1.88 1.96 1.89 1.84 1.90 1.78 2.03 2.23 1.97 2.03
Cl bd bd bd bd bd bd bd 0.10 0.09 0.06
Sum 99.22 99.13 99.75 97.46 100.80 100.49 100.62 100.43 97.98 100.71
O=F,Cl 0.79 0.83 0.80 0.77 0.80 0.75 0.85 0.96 0.85 0.87
Total 98.43 98.30 98.95 96.69 100.00 99.74 99.77 99.47 97.13 99.84
Formulae based on 13 oxygens
Ca 4.733 4.758 4.492 4.412 4.996 4.965 4.676 5.006 4.967 4.899
Na 0.080 0.075 0.089 0.078 0.020 0.024 0.027 0.010 0.010 0.016
La 0.049 0.043 0.064 0.068 0.008 0.015 0.019 0.005 0.005 0.040
Ce 0.112 0.092 0.143 0.155 0.023 0.041 0.047 0.003 0.010 0.078
Pr 0.028 0.010 0.022 0.015 0.007 0.007 0.000 0.000 0.000 0.011
Nd 0.060 0.056 0.084 0.101 0.016 0.025 0.029 0.004 0.000 0.041
Sm 0.005 0.004 0.018 0.007 0.004 0.000 0.006 0.000 0.010 0.013
Gd 0.012 0.006 0.007 0.010 0.000 0.000 0.007 0.000 0.000 0.000
Yb 0.000 0.000 0.000 0.000 0.000 0.000 0.000 0.000 0.000 0.000
Y 0.025 0.021 0.034 0.039 0.011 0.017 0.018 0.005 0.006 0.047
U 0.002 0.000 0.002 0.002 0.000 0.000 0.000 0.000 0.000 0.000
Fe 0.106 0.101 0.165 0.161 0.053 0.060 0.152 0.044 0.044 0.068
Mn 0.011 0.011 0.006 0.013 0.012 0.009 0.014 0.000 0.009 0.009
Sum M 5.222 5.178 5.128 5.062 5.151 5.162 4.995 5.077 5.062 5.221
P 2.802 2.856 2.660 2.683 2.982 2.949 2.703 3.034 3.044 2.751
Si 0.196 0.162 0.402 0.398 0.055 0.090 0.460 0.005 0.005 0.250
Sum Z 2.999 3.018 3.062 3.081 3.037 3.039 3.163 3.039 3.049 3.000
F 0.543 0.560 0.550 0.548 0.517 0.489 0.558 0.602 0.546 0.571
Cl 0.000 0.000 0.000 0.000 0.000 0.000 0.000 0.015 0.014 0.009
Σ cations 8.22 8.20 8.19 8.14 8.19 8.20 8.16 8.12 8.11 8.22
orthopyroxene stability field at high pressure, the mineral very rarely surviving resorption at lower pressures.
A further option is that the orthopyroxene is a relict of mixing between a Nemrut magma and magma from the neighbouring Süphan volcano. Süphan rocks are commonly orthopyroxene-phyric, and Sumita and Schmincke (2013c) have speculated that magmas from the volcano may have entered the Nemrut system at various stages, e.g. follow- ing the huge eruption of the Nemrut Formation fallout and pyroclastic flow. Analyses of orthopyroxene in Süphan tephras are given in Schmincke et al. (2014).
Feldspar
Feldspar compositions range from An69.0Ab29.9Or1.1 to An0.0Ab57.6Or42.4, i.e. labradorite to sanidine (Fig. 6;
Table 1c in ESM). It is likely that the most calcic phases (An > 50), which are restricted to mixed magma rocks, crys- tallized from basaltic magmas. ivAl is low (<0.1 apfu) in the alkali feldspars but up to 0.692 apfu in plagioclase, with
ivAl/viAl ratios as high as 0.71. Iron contents (≤1.16 wt%
Fe2O3) are within the range normally recorded in peralkaline salic rocks (≤1.5 wt%; Macdonald et al. 2011). The alkali
Table 5 Representative compositions of Pb-rich phase
FeO*, all Fe as Fe2+ ; bd, below detection. Mg, Mn, Cl, S and F are below detection in all analyses.
Details of the samples are provided in Table 1 Sample no./volcanic
layer no.
1 2 3 4 5 6 7 8
Core sample Onshore sample
V-70? 2009-07-14-06
SiO2 0.09 0.41 0.08 0.11 0.67 1.16 2.45 2.69
Al2O3 bd bd bd bd 0.00 0.02 0.04 0.12
FeO* bd bd 0.15 0.16 0.18 0.34 0.03 0.44
CaO bd bd bd 0.26 bd bd 0.16 0.25
Na2O bd 0.06 0.07 0.08 0.04 0.04 0.06 0.08
K2O bd bd bd bd 0.03 0.05 0.05 bd
PbO 93.69 81.07 91.81 92.26 98.78 95.90 86.31 78.82
Sum 93.78 81.54 92.11 92.87 99.70 97.51 89.09 82.40
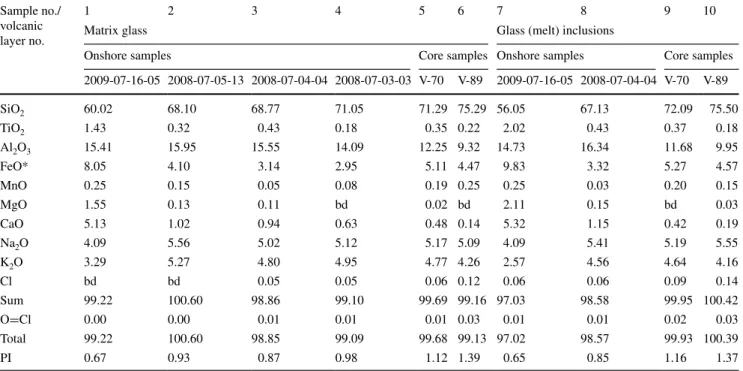
Table 6 Representative analyses of matrix glass and melt inclusions
FeO*, all Fe as Fe2+ ; bd, below detection. F and P below detection in all samples. PI, peralkalinity index [mol. (Na2O + K2O/Al2O3)]. Sample descriptions: 1: rimming cpx; 2: shard; 3: rimming cpx; 4: angular shard; 5: pumice fragment; 6: rimming alkali feldspar; 7: inclusion in olivine;
8: inclusion in cpx; 9: inclusion in cpx; 10: inclusion in olivine Sample no./
volcanic layer no.
1 2 3 4 5 6 7 8 9 10
Matrix glass Glass (melt) inclusions
Onshore samples Core samples Onshore samples Core samples
2009-07-16-05 2008-07-05-13 2008-07-04-04 2008-07-03-03 V-70 V-89 2009-07-16-05 2008-07-04-04 V-70 V-89
SiO2 60.02 68.10 68.77 71.05 71.29 75.29 56.05 67.13 72.09 75.50
TiO2 1.43 0.32 0.43 0.18 0.35 0.22 2.02 0.43 0.37 0.18
Al2O3 15.41 15.95 15.55 14.09 12.25 9.32 14.73 16.34 11.68 9.95
FeO* 8.05 4.10 3.14 2.95 5.11 4.47 9.83 3.32 5.27 4.57
MnO 0.25 0.15 0.05 0.08 0.19 0.25 0.25 0.03 0.20 0.15
MgO 1.55 0.13 0.11 bd 0.02 bd 2.11 0.15 bd 0.03
CaO 5.13 1.02 0.94 0.63 0.48 0.14 5.32 1.15 0.42 0.19
Na2O 4.09 5.56 5.02 5.12 5.17 5.09 4.09 5.41 5.19 5.55
K2O 3.29 5.27 4.80 4.95 4.77 4.26 2.57 4.56 4.64 4.16
Cl bd bd 0.05 0.05 0.06 0.12 0.06 0.06 0.09 0.14
Sum 99.22 100.60 98.86 99.10 99.69 99.16 97.03 98.58 99.95 100.42
O=Cl 0.00 0.00 0.01 0.01 0.01 0.03 0.01 0.01 0.02 0.03
Total 99.22 100.60 98.85 99.09 99.68 99.13 97.02 98.57 99.93 100.39
PI 0.67 0.93 0.87 0.98 1.12 1.39 0.65 0.85 1.16 1.37
feldspar host rocks evolve to around Or41 in the most per- alkaline rhyolites, in line with experimental evidence from peralkaline rhyolites from the Kenya Rift which showed that at melt proportions <60 wt% the alkali feldspar compo- sition remained constant at ~Or40 (Scaillet and Macdonald 2003, 2006). It is also consistent with data from the peralka- line rhyolites of Pantelleria, Italy, where the alkali feldspars evolve to a composition of Or39 (Neave et al. 2012).
FeTi oxides
Ilmenite compositions fall in the range Xilm 92–99, values generally increasing with increasing melt peralkalinity and SiO2 content (Table 2c in ESM). Manganese contents are low (0.011–0.037 apfu; 0.52–1.89 wt% MnO). Contents of Mg range from 0. to 0.155 apfu (b.d.–4.24 wt% MgO) and decrease with increasing Xilm. Niobium varies from 0 to 0.007 apfu (<0.08–0.52 wt% Nb2O5) and also decreases with increasing Xilm. Spinel compositions are in the range Xusp 61–73, the highest values tending to be in the peral- kaline rhyolites. Levels of Al2O3 are up to 1.3 wt%, with the exception of a partly resorbed, zoned crystal in 2009- 07-16-05, with core and rim values of 3.24 and 3.19 wt%, respectively. Unlike the other spinels, this crystal has detectable V2O3 contents (0.95, 1.07 wt%) and the high- est MgO values in the data set (3.77, 3.67 wt%), consistent with the intermediate composition of the host.
Aenigmatite
Macdonald et al. (2011) noted that, although Ti and Fe variations are limited in aenigmatite phenocrysts from peralkaline rhyolites, there are significant ranges in Al2O3 and CaO contents, such that compositional variation can be expressed by the coupled substitution
IVSi +VIIINa ↔IVAl +VIIICa (Kunzmann 1999) (Fig. 7).
The Nemrut data extend the field of aenigmatite phenocryst compositions in peralkaline rhyolites to slightly lower Na and Si contents (Table 3; Table 2b in ESM). There is obser- vational (Macdonald et al. 2011) and experimental (Di Carlo et al. 2010) evidence that phenocrystic aenigmatite is restricted to rhyolites with peralkalinity index >1.2. This is consistent with its occurrence in the Nemrut samples, where the aenigmatite-phyric glasses are transitional from comendite to pantellerite (see below).
Apatite
Both hydroxylapatite and fluorapatite are present (Table 4;
Table 2c in ESM), but there is no relationship between apa- tite and whole-rock compositions. The main compositional variation can be expressed as REE3++ Si4+= Ca2++ P5+ (Fig. 8). The britholite component, as inferred by the sum of REE + Si apfu, increases in the sequence mugearite–
trachyte–rhyolite, to a maximum value of 0.8 (~10 %). An
Table 7 T–fO2 estimates from
FeTi oxides Sample Glass comp. Occurrence Temp (°C) fO2
2007-07-19-06 Trachyandesite In same ol phen 875 −13.82
2008-07-04-04 Comendite In same ol phen 837 −15.29
In same glass clast 832 −15.45
In same glass clast 826 −15.61
Trachyte In same pyrox phen 898 −13.63
V-70 Comendite In same glass clast 791 −16.34
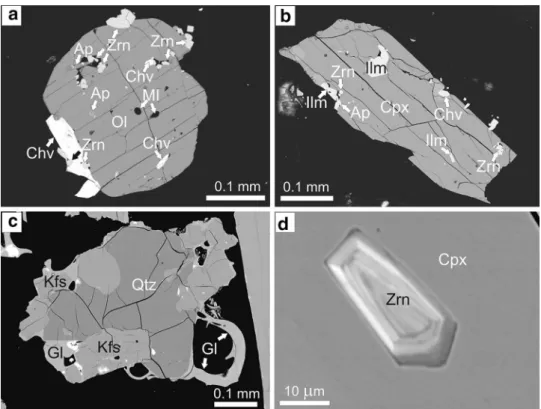
Table 8 T–P estimates from clinopyroxene–liquid equilibrium
Models: 1a and 1b, Putirka (2008); H2O content of glass calculated by difference. P = 1 kbar (1a) and 2 kbar (1b). Models 2a and 2b, recali- brated Putirka (2008) model; H2O content of glass determined by difference. P = 1 kbar (2a) and 2 kbar (2b). Model 3: Masotta et al. (2013) model, which calculates P and T simultaneously by iteration
Model obsv 1a 1b 2a 2b 3 3
KD T (°C) KD calc T (°C) KD calc T (°C) KD calc T (°C) KD calc T (°C) KD calc P (kb) Sample no.
2009-07-16-05 0.16 1017 0.24 ± 0.08 1022 0.24 ± 0.08 1085 0.20 ± 0.08 1073 0.20 ± 0.08 1034 0.18 ± 0.05 2.1 0.18 1005 0.23 ± 0.08 1010 0.24 ± 0.08 1097 0.19 ± 0.08 1086 0.18 ± 0.08 1040 0.17 ± 0.05 2.8 2008-07-04-04 0.08 866 0.20 ± 0.08 869 0.20 ± 0.08 865 0.14 ± 0.08 858 0.14 ± 0.08 881 0.14 ± 0.05 0.7 0.10 872 0.20 ± 0.08 876 0.20 ± 0.08 870 0.13 ± 0.08 862 0.13 ± 0.08 884 0.14 ± 0.05 1 2008-07-03-03 0.10 757 0.17 ± 0.08 760 0.17 ± 0.08 815 0.12 ± 0.08 808 0.12 ± 0.08 856 0.14 ± 0.05 0.1 V-89 0.62 801 0.18 ± 0.08 801 0.18 ± 0.08 814 0.12 ± 0.08 807 0.11 ± 0.08 721 0.09 ± 0.05 3.6