School performance in linguistically divided educational systems
A study of the Russian-speaking minority in Estonia and Latvia
Kristina Lindemann
Kristina Lindemann
School performance in linguistically divided educational systems
A study of the Russian-speaking minority in Estonia and Latvia
Arbeitspapiere – Working Papers Nr. 143, 2011
Mannheimer Zentrum für Europäische Sozialforschung
Lindemann, Kristina:
School performance in linguistically divided educational systems: A study of the Russian-speaking minority in Estonia and Latvia / Kristina Lindemann. –
Mannheim : 2011
(Arbeitspapiere - Mannheimer Zentrum für Europäische Sozialforschung ; No. 143) ISSN 1437-8574
Not available in book shops.
Token fee: € 3,00
Purchase: Mannheimer Zentrum für Europäische Sozialforschung (MZES), D – 68131 Mannheim WWW: http://www.mzes.uni-mannheim.de
Editorial Note:
Kristina Lindemann is a PhD candidate at the Tallinn University. Her main research interests are ethnic inequalities in the educational systems and transition from school to work. During her research stay at the MZES, from February 2010 to March 2010, she worked on the project “Educational Systems and Labour Markets in Central and Eastern Europe”, financed by the Volkswagen Foundation.
Abstract
It is often supposed that the lower educational performance of ethnic minority students is due to lan- guage difficulties. The linguistically divided school systems in Estonia and Latvia enable us to investi- gate the academic performance of minority children who study in their native language. I explore how mathematical performance is related with individual social background, achievement motives, and school context in such educational systems. I use the OECD Programme for International Student As- sessment (PISA) 2006 data to analyse the mathematical performance of Russian-speaking and native Estonian or Latvian students. The results of a multilevel analysis indicate that the linguistically divided school systems in Estonia and Latvia have different outcomes. In Latvia, results show that minority students experience no significant disadvantages irrespective of whether they attend Russian or Lat- vian schools. In Estonia, my results indicate that students who attend Russian schools have a lower performance than other students. This is partly explained by the socio-economic composition of Rus- sian schools, indicating that children undergo difficulties due to their parental disadvantages. Addi- tional reasons might be related to learning environments in these schools. However, Russian- speaking students in Estonian schools also seem to lag behind majority students. Thus, the opportu- nity to study in their native language might have only a minor influence on their educational achieve- ment, while the school or learning context seem to be the decisive factors.
Contents
1 Introduction... 1
2 Background ... 2
2.1 Ethnic minorities in Estonia and Latvia ... 2
2.2 Estonian and Latvian educational systems... 3
2.3 Linguistically divided basic and secondary schools... 4
3 Theoretical considerations ... 5
4 Data and variables ... 8
5 Method ... 10
6 Results ... 11
6.1 Descriptive overview ... 11
6.2 Multilevel models... 13
6.2.1 The case of Estonia ... 13
6.2.2 The case of Latvia... 16
6.2.3 Russian-speakers in majority language schools... 18
7 Conclusion... 19
8 References ... 22
9 Appendix ... 25
1 Introduction
Ethnic inequalities in education are characteristic of many European societies (Heath and Brinbaum 2007; Heath et al. 2008). Several studies have reported that school performance differs significantly between the native and immigrant population (Marks 2005; Schnepf 2007; Levels and Dronkers 2008).
In their comparison of different Western European countries, Heath et al. (2008) conclude that the ethnic disadvantage in education is particularly visible in school performance, while the educational choices of some ethnic minorities might be even more ambitious compared to majority students. The different educational performance of ethnic groups is often related to social background and aspira- tions. However, school context (i.e., ethnic or socio-economic composition of school) may also ac- count for the lower achievement of ethnic minority students (e.g., Portes and Hao 2004).
Although many studies have explored the ethnic differences in educational performance in Western European countries, there is much less research regarding Eastern European countries. This paper focuses on the educational achievement of the Russian-speaking minority in Estonia and Latvia. In these countries, the influx of Russian-speaking immigrants during the Soviet period (1944–1991) was substantial. Since then, schools in Estonia and Latvia have been divided based on the language of in- struction. Therefore, Russian-speaking students have an opportunity to study in their native language, although teaching is also currently partly conducted in the native language (i.e., Estonian or Latvian) in these schools. In literature, the effect of bilingual education on educational success has received little attention thus far (Esser 2006). Some previous studies have focused on the influence of multilingual teaching for the school success of ethnic minority children (e.g., Greene 1998; Slavin and Cheung 2005). However, the focus of this research has been on language immersion programmes in schools rather than on educational systems divided by language.
This paper explores the performance of Russian-speaking minority students studying in schools in Es- tonia and Latvia, with the instruction language being either in Russian or in the majority language (i.e., Estonian or Latvian). The central research questions I address are (1) whether the opportunity to study in one’s native language promotes the achievement of minority students, and (2) how math perform- ance is related with individual social background, achievement motives, and school context in linguis- tically divided schools. These questions are important from the theoretical perspective because previ- ous literature about the integration of ethnic groups has predominantly overlooked the effects of lin- guistically divided educational systems.
This paper also explores how a specific societal context shapes the achievement of minorities in schools with a different language of instruction. The immigration history of Russian-speakers was quite similar in Estonia and Latvia. However, compared to Latvia, the intermarriage rate between eth- nic groups is lower in Estonia and communities are more socially separated. The Russian-speaking minority in Estonia is less dispersed geographically than in Latvia. In addition, socio-economic differ- ences between the ethnic communities are larger in Estonia than in Latvia (Aasland and Fløtten 2001;
Hazans 2010; Rozenvalds 2010). Nevertheless, in both countries issues related to minority schools have been one of the most debated aspects of educational reform since each country regained its in-
dependence. In particular, the recent transition to bilingual teaching in Russian schools1 has raised questions about the quality of education in these schools.
I used the data from OECD’s PISA 2006 study. This data enables us to compare the mathematical performance of students while taking into account the language spoken at home and the language of instruction at school. I conducted the analysis using multi-level techniques. In the next section, I de- scribe the situation of the ethnic minorities and educational systems in both countries. After that, I in- troduce my theoretical consideration and hypothesis. Next, I provide an empirical analysis and discuss the results in the conclusion.
2 Background
2.1 Ethnic minorities in Estonia and Latvia
Estonia and Latvia became host to a sizeable Russian-speaking minority after World War II. The influx of Soviet military persons started immediately after each country’s incorporation into the Soviet Union.
In addition, the inflow of labour immigrants was high during the entire Soviet era as a result of specific industrialisation policies. Russian-speakers were primarily arriving from Russia, Ukraine, and Belarus.
As a result, the ethnic composition of the population in Estonia and Latvia changed significantly. The share of people identifying themselves as ethnic Estonians in Estonia decreased from 88% in 1934 to 62% in 1989. In Latvia, the number of ethnic Latvians dropped from 77% in 1935 to 52% in 1989.
However, the proportion of natives has increased during the last two decades to 59% in Latvia and 69% in Estonia (Central Statistical Bureau of Latvia 2010; Statistics Estonia 2010).
In both countries, differences between the ethnic majority and the Russian-speaking minority are not very large in terms of age and gender distribution, average household size, and educational level.
However, it has been argued that the distance between the native and the Russian-speaking commu- nity is larger in Estonia than in Latvia (Aasland and Fløtten 2001). In Estonia, the settlement, division of labour, and institutional ties overlapped with ethnic and language boundaries during the Soviet pe- riod (Hallik 2002). A sizeable Russian-speaking community had marginal contact with Estonians and the Estonian language (Rannut 2008). In Latvia, there was more social interaction between the ethnic groups, both at work and outside work. A larger number of Russian-speakers in Latvia was able to speak the local language and there were more interethnic marriages compared with Estonia (Aasland and Fløtten 2001). However, a policy of segregation was also practised in Latvia (Priedīte 2005).
The Soviet educational system and the domination of the Russian language in the public sphere had an impact on the language skills of ethnic minorities. According to a 1989 USSR Census, 15% of Rus-
1 I use short form “Russian schools” for schools with Russian language of instruction. Also notions Estonian and Latvian schools refer to the language of instruction in school.
sians in Estonia and 22% of Russians in Latvia were fluent in the titular language (Pavlenko 2008).
However, since the late 1980s, the language situation has changed. The official language is Estonian in Estonia and Latvian in Latvia, while Russian is defined as a foreign language. The knowledge of the official language is rising, especially among the younger generation. Between 1989 and 2000, the per- centage of population speaking the titular language rose from 62% to 82% in Latvia and from 67% to 80% in Estonia (Hogan-Brun 2007).
Mixed marriages are still more common in Latvia than in Estonia. In 2009, about 21% of Latvians had a spouse from a different ethnicity than Latvian (Central Statistical Bureau of Latvia 2010). This figure does not show directly the share of Latvian-Russian couples, although it is likely that Russians, as the largest ethnic minority, constitutes a large proportion of these spouses. By contrast, the intermarriage rate in Estonia has stayed very low, with only 4% of marriages being between Estonians and Russians in 2000 (Statistics Estonia 2010).
Ethnic segmentation was a characteristic of the work sphere during the Soviet era and is also present in the contemporary Estonian and Latvian labour market. In general, the labour market position of the Russian-speaking minority became more vulnerable after each country regained its independence. In both countries, the unemployment rate is higher among non-natives than among ethnic Latvians or Estonians. In addition, returns from education in terms of wages are significantly higher for natives compared to members of the minority (Pavelson and Luuk 2002; Leping and Toomet 2008; Hazans 2010). One important reason for such a tendency are insufficient official language skills. However, the ethnic wage gap in Latvia is modest compared to Estonia, and the gap between majority and minority unemployment rate is smaller in Latvia (Hazans 2010).
A large share of the Estonian and Latvian population does not have any citizenship. In 2009, about 16% of the Latvian and 8% of the Estonian population was without citizenship (Central Statistical Bu- reau of Latvia 2010; Statistics Estonia 2010). In Latvia, children born after August 1991 have a right of citizenship. In Estonia, children born after 1992 are granted citizenship if their parents apply for it.
Thus, it is likely that some Russian-speaking respondents in the PISA study do not have citizenship or that they might be citizens of Russia or other countries. However, there are no legal restrictions for children without citizenship to participate in the educational system.
2.2 Estonian and Latvian educational systems
In both Estonia and Latvia, basic education begins at the age of seven and lasts nine years. There are no tuition fees in public basic schools. According to OECD (2010), the Estonian and Latvian school systems are characterised by rather low levels of differentiation in selecting and grouping students in basic schools. Thus, the learning environment in classrooms tends to be heterogeneous. However, some basic schools in Estonia select students based on their abilities. In Latvia, it is generally not permitted to organise any admission tests when a student is admitted to a public school, except in the case of gymnasiums. After the completion of basic education (lower secondary), students can choose
to continue in the general secondary track or acquire some type of vocational education.2 This deci- sion is typically made at the age of 15 or 16. In both countries, many students prefer to continue in the general secondary track which offers the best opportunities for access to higher education (Trapenci- ere 2008; Saar and Lindemann 2008). In 2008/2009, about 64% of students studying at the upper secondary level were enrolled in general secondary schools in Latvia and about 66% in Estonia (Cen- tral Statistical Bureau of Latvia 2010; Statistics Estonia 2010).
The division of schools based on the language of instruction (Russian and local language) is a prac- tice from the Soviet period, when the Estonian and Latvian educational system were a part of the So- viet educational system. Studying in Russian as the language of instruction was also an option at the level of higher education. Therefore, it was possible to attain the highest education without having the knowledge of local language. Currently, the language of studies in public higher education institutions is mainly the official language of the country (i.e., Estonian or Latvian), while it is possible to study in Russian at private universities.
2.3 Linguistically divided basic and secondary schools
During the last two decades there have been many changes regarding Russian primary and secon- dary schools in Estonia and Latvia. In general, basic schools are divided into (1) Estonian/Latvian schools, (2) Russian schools, and (3) mixed schools (two-stream). Mixed or two-stream schools mean that some students study in classes with the majority language of instruction (typically students from ethnic majority) and others in classes with Russian as the language of instruction. In Estonia, Estonian schools constituted 83% of all schools, and 4% of schools were mixed in 2006 (Statistics Estonia 2010). In Latvia during this same year, 67% of all students were enrolled in Latvian schools, 24% in Russian schools, and about 9% of students attended mixed schools. The small share of students is enrolled in other ethnic minority schools, where teaching takes place partly in Latvian, but where the emphasis is placed on the particular ethnic minority culture and history (Kehris and Landes 2007).
The importance of the official language in Russian schools has increased. In Latvia, all Russian basic schools had introduced one of five possible models of bilingual education curricula by the year 2002.
At the upper secondary level, all Russian schools should have at least 60% of studies in Latvian since school year 2006/2007. The implementation of this reform became the subject of heated debates in Latvia, with a resulting growth in inter-ethnic tensions (Hogan-Brun 2007). In Estonia, the transition to bilingual teaching in upper secondary schools is still ongoing. Students starting the 10th grade in 2011 or later must study 60% of school subjects in Estonian. In recent years, special programmes for lan- guage immersion are becoming increasingly more widespread in Russian basic schools. Neverthe- less, the influence of language immersion should be minor in the case of PISA 2006 participants.
2 In Latvia, it is possible to attain vocational education or vocational secondary education. The latter provides access to higher education. In Estonia, the graduates of vocational schools (on the basis of basic school) have access to higher education if they choose to take the state exams.
In both countries, the proportion of students enrolled in Russian schools has decreased during the last 20 years. The general number of Russian-speaking students has dropped and several Russian schools have closed (Hogan-Brun et al. 2007). Some Russian-speaking students prefer majority schools. In Latvia, for instance, about 16% of students in Latvian schools are ethnic minority children (Kehris and Landes 2007). Schools with Estonian or Latvian as the language of instruction are particu- larly valued among Russian-speaking parents, who seek opportunities to help their children to become bilingual because the quality of teaching the official language in Russian schools is considered to be insufficient (Hogan-Brun et al. 2007; Zepa et al. 2008). In Latvia, studies show that an important factor influencing the school choice is the language skills of parents. The higher the level of knowledge in Latvian, the greater the possibility that parents will choose Latvian school (Priedīte 2005).
Standardised state exams are conducted at the end of upper secondary education in both countries.
Majority schools have fared somewhat better in these exams (Zepa 2010; NEQS 2010).
3 Theoretical considerations
The situation of ethnic minorities in Estonia and Latvia differs in many aspects from that of ethnic mi- norities in Western European countries and the U.S. However, theoretical approaches developed in these countries also contribute to explaining the educational performance of ethnic groups in the Baltic States.
Boudon (1974) uses the concept of primary and secondary effects to explain the influence of social background on educational performance and choices. While secondary effects indicate the influence of social background on educational choices, primary effects show the influence of social background on the academic performance of students. Primary effects could result from, for example, cultural, ge- netic, or economic factors that differ between social classes (Van de Werfhorst and van Tubergen 2007). It is widely accepted that performance differences between children are related to socialisation and parental involvement during childhood. An opportunity to invest in good schools influences per- formance differences as well (Erikson and Jonsson 1996; Jonsson and Rudolphi 2011). In many coun- tries, the socio-economic background is an important reason for the overall weaker performance of immigrant students, but, for several ethnic groups, the performance disadvantage remains even after controlling for parental characteristics (Levels and Dronkers 2008).
Heath and Brinbaum (2007) argue that the parental lack of fluency in the language of the majority population may make it difficult for children to succeed with respect to their schoolwork. This may lead to lower achievements in test scores than would be expected considering the socio-economic position of the parents. There is some evidence that language difficulties might contribute to the educational achievement of second-generation students (e.g. Schnepf 2007). However, the extent to which lan- guage difficulties affect the educational outcomes of second-generation students is an unresolved is- sue (Heath et al. 2008).
Literature often points out that ethnic groups might differ in terms of orientation toward schooling and achievement motives (Kao and Thompson 2003). The immigrant parents’ optimism about the future prospects of their children is decisive (Kao and Tienda 1998). In addition, the migration experience might have an effect on aspirations. Parents who experienced downward mobility due to migration may expect the next generation to regain this lost social status through education (Platt 2005). On the other hand, Jonsson and Rudolphi (2011) argue that one plausible reason for some ethnic minorities’
lower school performance in Sweden is low educational aspirations, which become visible in irregular school attendance and little focus on learning. In addition, attitudes toward schooling might be shaped by the ethnic community forces, depending on how minorities are treated in their new society and how they perceive this treatment. If minorities do not trust the educational system and feel that it threatens their minority identity, they might, as the most extreme response, develop an oppositional culture to mainstream schooling (Ogbu and Simons 1998).
Sørensen and Hallinan (1977) call attention to the organisational characteristics of schools that create differences in learning opportunities. These characteristics include curriculum, instruction materials, teaching techniques, interaction style, and student involvement. In addition, learning is influenced by ability and effort. The ability of students is not a fixed trait, but can be modified by contextual factors.
Students who have fewer opportunities to learn over their school career are likely to have a lower abil- ity than students with more opportunities. Learning opportunities that the school provides also influ- ences efforts, such as the students’ motivation and need for achievement (Sørensen and Hallinan 1977; Hallinan 2005). In addition, the school composition may influence the achievement of students.
Students create the school’s social environment from the advantages and disadvantages they bring from home to school. Several studies show that the school composition in terms of average socio- economic status of parents and the segmentation of ethnic groups has an effect on the educational achievement of students (Bankston and Caldas 1996; Portes and Hao 2004).
These theoretical considerations are also helpful for explaining the situation of ethnic minorities in Es- tonia and Latvia. One explanation for the lower school performance of ethnic minorities is their lan- guage skills. Students who speak their native language at home might have difficulty understanding the linguistic context of tasks in school (Esser 2006). Unfortunately, the PISA 2006 survey does not directly measure language skills. Thus, it is not possible to make conclusions about the importance of language skills. However, these skills may negatively impact educational performance if the language of instruction in schools differs from the language spoken at home. Therefore, I suppose that Russian- speaking students who attend Estonian or Latvian schools are likely to achieve lower test scores in mathematics in both countries. By contrast, Russian-speaking students who are enrolled in schools with Russian as the language of instruction should not experience any difficulties due to their language skills.
Several characteristics on the individual level may contribute to the differing educational achievement of ethnic minorities and the majority. However, it is likely that native and Russian-speaking students do not differ significantly in terms of parental educational level or cultural resources. Thus, minority stu-
dents should not receive less help with schoolwork from their parents. However, since the beginning of 1990s, the Russian-speaking minority has been in a more disadvantaged position in the labour mar- ket. Thus, Russian-speaking families may have fewer financial resources to support their children dur- ing their educational career. Although the vast majority of 15-year-old students are studying in public schools in Estonia and Latvia, Russian-speaking families might still possess fewer resources for cov- ering other costs related with learning (e.g., books). Therefore, the social background may have some negative effect on the achievement of Russian-speaking students, but it is unlikely that the social background is the reason for the achievement gap between majority and minority students.
There is not much research about ethnic differences in educational aspirations and learning motivation in Estonia and Latvia. The Russian-speaking population in Estonia indicates a bit more often than Es- tonian-speakers that they wish for at least higher education for their children (Saar 2008). Russian- speakers with higher education who have experienced downward mobility due to the lack of language skills may especially encourage their children to attain a high level of educational achievement if they perceive that opportunities in the educational system are equal. However, I do not expect occupational aspirations and the motivation to learn to be reasons for the achievement gap between majority and Russian-speaking students.
The characteristics of schools might also contribute to the different achievement of ethnic groups. In general, it seems that the opportunity to learn does not differ significantly in schools with majority and Russian as languages of instruction. In both countries, the unified national curriculum is adopted (Golubeva 2010). However, in Estonia, the transition to a new curriculum in mathematics in the sec- ond half of the 1990s was difficult for Russian schools. In the years 1963–1991, the practice of teach- ing mathematics differed in schools with Estonian and Russian as languages of instruction as the lat- ter relied on Soviet textbooks and methods (there was no such difference in Latvia). Thus, Russian teachers had difficulties in adjusting to the new ways of teaching and textbooks (Monakov and Šev- tšenko 2003). In both countries, the renewal of textbooks was slower in Russian schools than in other schools due to time-consuming translations. Thus, I expect that there might be some achievement dif- ferences between schools with Russian and those with the majority language as language of instruc- tion, especially in Estonia.
The selection of students in schools and the resources available to them influences the learning envi- ronment. According to PISA 2006 data, Russian schools are not significantly less selective than major- ity schools regarding the importance of students’ abilities for admission (analysis not presented here).
In addition, rural schools might have fewer resources for granting educational success to their stu- dents. However, Russian schools are often located in urban areas in Estonia and Latvia. Thus, I sup- pose that selectivity of school and school location influence the achievement of students, but are not the reason for achievement differences between schools with Russian and those with the majority lan- guage as language of instruction.
The ethnic composition of schools is not very heterogeneous in Estonia and Latvia. In Russian schools, most students are ethnic Russians or Russian-speakers from other ethnic groups, while there
is somewhat more heterogeneity in the majority schools. The socio-economic composition of schools might be a bit lower in Russian schools, especially in Estonia, where the labour market position of mi- nority and majority groups differs more compared to Latvia (Hazans 2010). In addition, Russian- speaking parents with higher resources seem to prefer schools with the majority language of instruc- tion in Estonia.3 Therefore, I suppose that the socio-economic composition of school explains the dif- ferent achievement of students in Russian and majority schools, especially in Estonia.
4 Data and variables
The OECD Programme for International Student Assessment (PISA) focuses on student competen- cies in reading, mathematics, and science. PISA examines the student’s ability to use their knowledge and skills to meet real-life challenges. The third PISA survey (2006) was conducted in 57 countries (including Estonia and Latvia). The average age of participating students is 15. PISA samples students randomly in two stages: schools are first sampled in the country and then students are sampled in the participating schools (OECD 2009). In addition, the PISA survey also includes parent and school questionnaires (for the school principal).
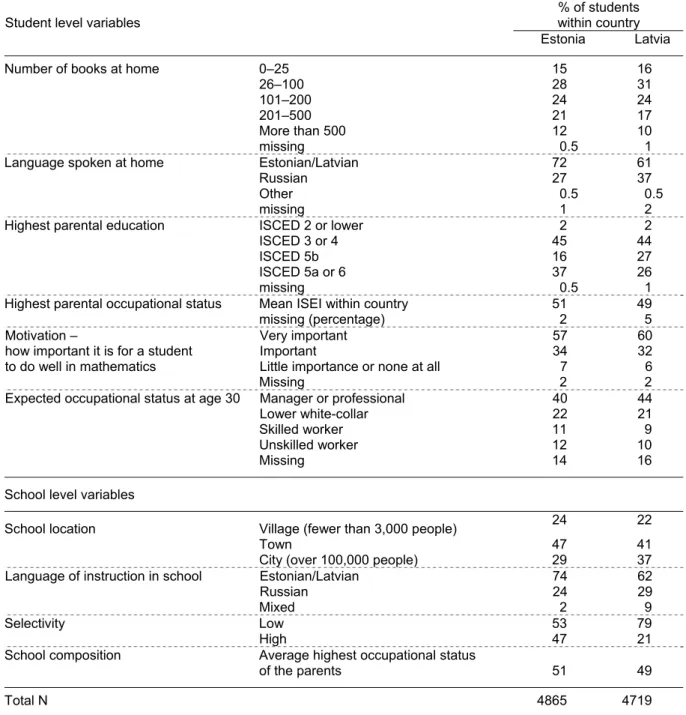
The sample size in Estonia was 4,865 students (127 Estonian, 38 Russian, and 4 mixed schools). The Latvian sample included 4,719 students (114 Latvian, 46 Russian, and 16 mixed schools). The major- ity of sampled students were studying in basic schools – 98% in Estonia and 96% in Latvia.
Almost all Russian-speaking students in the sample were born in the host country – 97.2% in Estonia and 98.5% in Latvia. About 40% of Russian-speaking students in Estonia and 20% in Latvia are sec- ond-generation immigrants. During the Soviet era their integration into the host society was not neces- sary. Thus, the differences between second- or third-generation young Russian-speakers should be largely irrelevant in these countries.
The dependent variable is mathematical performance. Because assessing each student with the whole item battery in the test would have been too time-consuming, the PISA study had only certain subsamples of students respond to each item. In order to compare the ability of students, PISA scaled the cognitive data based on the Item Response Theory. Such modelling estimates the ability of every student using the number of correct answers and the difficulties of the items. The PISA dataset con- tains five plausible values for each student, representing his or her ability in mathematics. These scores are standardised to an international mean of 500 and a standard deviation of 100 (OECD 2009).
3 PISA 2006 data shows that, in Estonia, the parental occupational position is higher for Russian-speakers in Estonian schools than in Russian schools, while no such difference exists in Latvia (analysis not presented here).
Independent variables include student and school level variables. At the student level, gender and grade act as control variables. I use the following family background variables in my analysis:
• The language spoken at home specifies whether the student speaks the majority language (Esto- nian or Latvian), Russian, or another language at home.4
• The highest parental educational level is measured according to the ISCED scale (The Interna- tional Standard Classification of Education), which I divided into 4 levels: (1) ISCED 2 or lower, basic education; (2) ISCED 3 and 4, secondary and post-secondary education;5 (3) ISCED 5b, practically oriented tertiary education; and (4) ISCED 5a and 6, tertiary education.
• PISA measures the highest parental occupational status according to the ISEI scale (The Interna- tional Socio-Economic Index of occupational status).
• The number of books in the home, which refers to cultural resources available at home.
PISA measures the students’ occupational aspirations with an open-ended question, which recorded their expected occupational status at the age 30. I divided the occupational aspirations into five groups: (1) managers or professionals, (2) lower white-collar, (3) skilled worker, (4) unskilled worker, and (5) missing. The relationship between occupational aspirations and educational performance may be bi-directional. I expect that higher aspirations lead students to place more importance on school performance, but higher performance may also encourage higher aspirations. Motivation in mathemat- ics was measured with this question: “In general, how important do you think it is for you to do well in mathematics?” I divided the answers into four categories: (1) very important, (2) important, (3) little importance or none at all, and (4) missing.
At the school level, I include the following variables describing school context:
• Language of instruction in school is the test language in the PISA study. I divide schools into Es- tonian/Latvian, Russian, and mixed schools.
• School location specifies whether the school is located in a village with fewer than 3,000 inhabi- tants, in a town (up to 100,000 inhabitants), or in a city with more than 100,000 inhabitants.
• I divide the measure of the selection of students into two categories: (1) high – the student’s aca- demic record (including placement tests) is a prerequisite or high priority when the student is ad- mitted to school, (2) low – the academic record or placement test is not high priority. This question is about general practice and is evaluated by the school principal.
• I specify the socio-economic composition of the school as the average highest occupational status (ISEI) of parents in school.
Appendix (Table A1) presents an overview of the distribution of independent variables.
4 Students were asked what language they speak at home most of the time, with an option to select only one language. Thus, it is impossible to separate bilingual families. Language skills were not measured.
5 PISA coding of parental education does not allow separating vocational and general track of secondary edu- cation in Estonia and Latvia (both coded as ISCED 3A).
5 Method
At first, I provide an overview of the average mathematical performance in schools with different lan- guages of instruction. I compute means, standard errors, and standard deviations using five plausible values and weight data with student and replicate weights (SPSS macros provided by OECD 2009).
For a multilevel analysis, I deleted all missing data at the student level. In both countries, the variable describing the highest parental occupational status had the most missing values (1.7% in Estonia and 4.5% in Latvia). The final sample size for Estonia is 4,709 students and 169 schools, while respective numbers for Latvia are 4,385 students and 172 schools. After deleting missing cases, I normalised the weights for the multilevel analysis (OECD 2009) and centred all continuous variables on the grand mean. This makes the interpretation of the intercept easier, which is the expected value of the out- come variable, when all explanatory variables have the value zero (Hox 2002). I carried out the multi- level analysis using the HLM programme, and treated variables characterising students as level 1 and variables for schools as level 2.
As a first step in the multilevel analysis, I analyze a model without explanatory variables. This inter- cept-only model is useful because it provides an estimate of intra-class correlation, which is defined as the population variance between level 2 units divided by the total variance (Hox 2002). Next, I add student level variables describing social background, language spoken at home, motivation, and oc- cupational aspirations in the model (Model 1). I compare this model with the intercept-only model and calculate the amount of variance due to introducing explanatory variables. After that, I include the lan- guage of instruction (Model 2). Next, I control for the location and selectivity (Model 3). In the last model, I add the socio-economic composition of the school (Model 4). In these four models, I assume the regression intercept to vary across the groups, but regression slopes are fixed. Nevertheless, I es- timated models with school level characteristics with varying random slopes, which gave basically the same results. Therefore, I prefer the simpler version of models. I test the improvement of the models with the likelihood-ratio test, which is based on the difference between deviance statistics of two mod- els (Raudenbush and Bryk 2002). In addition, I test the interaction between the language of instruction in school and the language spoken at home. I estimate separate models for Estonian-language and Latvian-language schools in order to determine whether speaking Russian at home influences the achievement in these schools.6
6 There are only a few Estonian-speakers and Latvian-speakers in Russian-language schools. It is likely that some of these students are from mixed families. Due to the low number of such cases and the theoretical fo- cus of the paper, I did not estimate separate models for Russian-language schools.
6 Results
6.1 Descriptive overview
In Estonia, the overall mean score in mathematics is 515 points, which is a result above the OECD average (OECD 2007a). Despite good overall results, there are large differences between students who speak Estonian or Russian at home. Table 1 shows that Estonian-speaking students achieved an average of 524 points, while Russian-speakers achieved a significantly lower average score of 491 points. Students who speak some other language at home (only a few cases) also achieve lower scores compared to Estonian-speakers. There are significant achievement differences between stu- dents studying in schools with Estonian and Russian as the language of instruction, 523 and 486 points respectively. In Estonia, only 2% of sampled students are studying in mixed schools. The achievement in these mixed schools is lower compared to Estonian schools.
A number of Russian-speaking children also study in schools with Estonian as the language of instruc- tion. This seems to pay off in terms of mathematical performance (Table 1). Although Russian- speakers studying in Estonian schools achieve on average a somewhat lower score in mathematics (513 points), it does not differ significantly from Estonian-speakers (524 points). However, these stu- dents perform significantly better than their Russian-speaking peers in Russian schools, who attained only 488 points in average. Table 1 indicates that the educational performance of Russian-speakers does not differ according to the immigration generations. Although first generation immigrants seem to achieve lower scores, the Estonian PISA study included a very small number of foreign-born Russian- speakers.
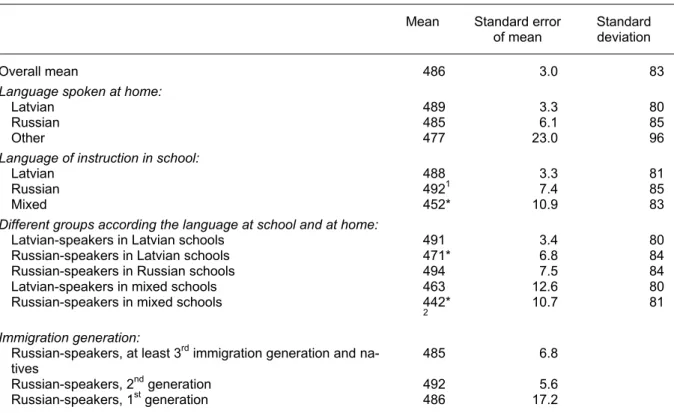
The average mathematical performance in Latvia is 486 points, which is below the OECD average (OECD 2007a). Table 2 indicates that the average performance of students who speak Russian at home does not differ from students who speak Latvian at home, with 485 and 489 points respectively.
Only a very small number of sampled students speak some other language at home, and their aver- age achievement does not differ significantly from that of others. In addition, students in schools with Latvian and Russian as the language of instruction have approximately the same average mathemati- cal performance. According to the Latvian PISA report, the achievement gap between Russian and Latvian schools was lower in 2006 than it was in 2003 as the students’ performance in Russian schools had improved (Geske et al. 2007). Students who are attending mixed schools have signifi- cantly lower average score in mathematics, but mixed schools are more common in rural areas.
There are significant performance differences between students within Latvian schools (Table 2). Stu- dents speaking Russian at home achieve on average 471 points in these schools, while the average mathematical performance of Latvian-speakers amounts to 491 points. Russian-speakers attending mixed schools have the lowest performance, while Latvian-speakers in the same schools perform somewhat better. Table 2 also shows that, in Latvia, similarly as in Estonia, the immigration generation is not crucial regarding the achievements of students.
Table 1 Average mathematical performance in Estonia
Mean Standard error
of mean Standard deviation
Overall mean 515 2.7 80
Language spoken at home:
Estonian 524 3.1 78
Russian 491* 5.4 80
Other 451* 20.5 90
Language of instruction in school:
Estonian 523 3.0 79
Russian 486* 6.2 80
Mixed 491* 6.8 68
Different groups according the language at school and at home:
Estonian-speakers in Estonian schools 524 3.1 79
Russian-speakers in Estonian schools 5131 6.1 77 Russian-speakers in Russian schools 488* 6.3 80
Immigration generation:
Russian-speakers, at least 3rd generation and natives 491 5.7 Russian-speakers, 2nd generation 497 5.8 Russian-speakers, 1st generation 475 17.1
* Average test score of the group differs significantly compared to Estonian-speakers and/or students studying in Estonian schools.
1 Russian-speakers perform significantly better in Estonian schools than in Russian schools.
Source: author’s own calculations based on PISA 2006.
Table 2 Average mathematical performance in Latvia
Mean Standard error
of mean
Standard deviation
Overall mean 486 3.0 83
Language spoken at home:
Latvian 489 3.3 80
Russian 485 6.1 85
Other 477 23.0 96
Language of instruction in school:
Latvian 488 3.3 81
Russian 4921 7.4 85
Mixed 452* 10.9 83
Different groups according the language at school and at home:
Latvian-speakers in Latvian schools 491 3.4 80 Russian-speakers in Latvian schools 471* 6.8 84 Russian-speakers in Russian schools 494 7.5 84 Latvian-speakers in mixed schools 463 12.6 80 Russian-speakers in mixed schools 442*
2 10.7 81
Immigration generation:
Russian-speakers, at least 3rd immigration generation and na-
tives 485 6.8
Russian-speakers, 2nd generation 492 5.6 Russian-speakers, 1st generation 486 17.2
* Average test score of the group differs significantly compared to Latvian-speakers and/or students studying in Latvian schools.
1 Students who study in Russian schools perform significantly better than students in mixed schools.
2 Russian-speakers perform significantly better in Russian schools than in mixed schools.
Source: author’s own calculations based on PISA 2006.
6.2 Multilevel models
In a first step of multilevel modelling, I estimated the intercept-only models. The intra-class correlation indicates that about 25.7% of variance in the mathematical performance is at the school level in Esto- nia and 22.2% in Latvia. Therefore, it seems that students in different schools achieve somewhat dif- ferent scores. However, the total variance between schools in Estonia and Latvia is much lower com- pared with Hungary, the Czech Republic, and Slovakia (OECD 2007b). In these countries, the selec- tion between different educational tracks occurs at a younger age than 15 (e.g. Kogan 2008). In con- trast, compared to Sweden, Finland, and Denmark, the between-school variance in mathematical per- formance is a bit higher in Estonia and Latvia (OECD 2007b).
6.2.1 The case of Estonia
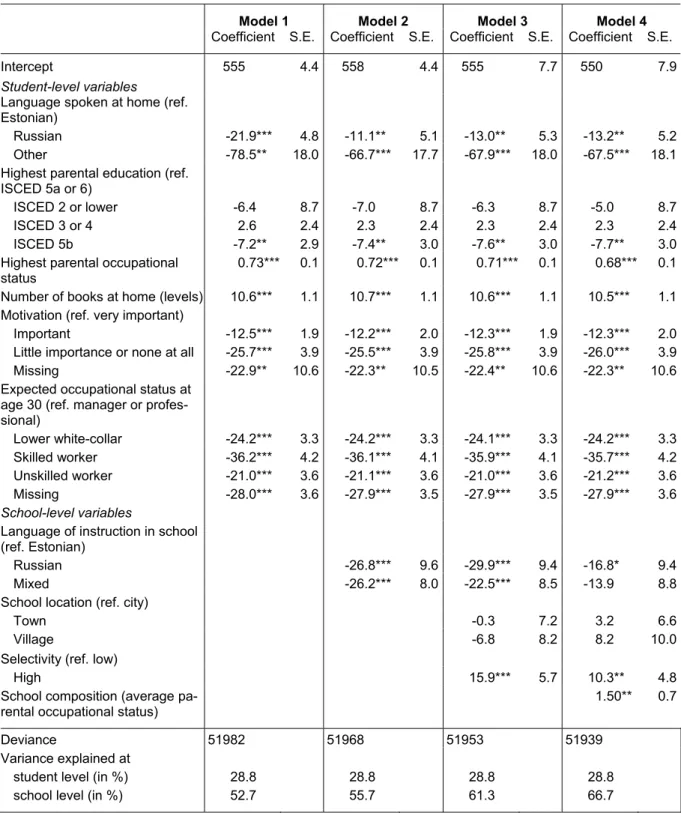
Table 3 presents further multilevel models for Estonia, where student and school level variables are included. The difference of deviance statistics in the intercept-only model and in Model 1 indicates that adding student level variables improves the model fit significantly. Table 3 also calculates the amount of variance explained by introducing student level variables in comparison with the intercept-only model. It appears that almost 29% of variance is explained at the student level by social background and measures of motivation and aspirations. Not surprisingly, these variables also explain almost 53%
of variance at school level. For example, the language spoken at home differs significantly across schools. In other words, this shows that the individual level explanatory variables are divided rather selectively across groups, i.e., the composition of groups is rather unequal (Hox 2002). Similar to the results of descriptive analysis, Model 1 shows that Russian-speaking students achieve lower test scores compared to Estonian-speakers, even if both possess a similar social background. In addition, motivation and occupational aspirations do not explain the disadvantage of Russian-speakers.
I add school-level variables with steps into analysis (each step improved the model fit and increased the variance explained at school level). First, Model 2 includes the language of instruction in school. It appears that students in Russian schools and mixed schools achieve significantly lower test scores compared to Estonian schools. Therefore, the language of instruction at school has an effect on the achievement despite a similar social background, motivation, or occupational aspirations.
Model 3 adds the selectivity of schools and school location. The negative effect of studying in Russian schools does not decrease. Thus, the way schools select their students is not the reason for the lower achievement in these schools. Students in Russian schools still achieve on average about 30 points less than students in schools with the majority language as the language of instruction. However, the measure of selectivity captures only practices in the school, while the school has an option to choose only among students who apply for access. In general, students clearly achieve better results in more selective schools. Although OECD (2010) claims that the classrooms in Estonia are heterogeneous, the difference between more and less selective schools is apparent in the analysis, even where stu- dents have a similar parental background. Thus, the advantage of more selective schools might be re-
lated with the learning environment and teaching practices. The location of the school does not influ- ence the achievement in mathematics.
Finally, Model 4 adds the school composition in terms of the average highest occupational status of the parents. It has a strong effect on mathematical performance. In particular, the school composition significantly reduces the negative effect of studying in a Russian school. Therefore, the low achieve- ment of students in these schools can at least partly be explained by the socio-economic composition of schools, which influences the achievement of students despite their individual social background.
Table 3 The influence of student and school level variables on mathematical performance in Estonia, coefficients and standard errors from multilevel models
Model 1 Model 2 Model 3 Model 4
Coefficient S.E. Coefficient S.E. Coefficient S.E. Coefficient S.E.
Intercept 555 4.4 558 4.4 555 7.7 550 7.9 Student-level variables
Language spoken at home (ref.
Estonian)
Russian -21.9*** 4.8 -11.1** 5.1 -13.0** 5.3 -13.2** 5.2 Other -78.5** 18.0 -66.7*** 17.7 -67.9*** 18.0 -67.5*** 18.1 Highest parental education (ref.
ISCED 5a or 6)
ISCED 2 or lower -6.4 8.7 -7.0 8.7 -6.3 8.7 -5.0 8.7 ISCED 3 or 4 2.6 2.4 2.3 2.4 2.3 2.4 2.3 2.4 ISCED 5b -7.2** 2.9 -7.4** 3.0 -7.6** 3.0 -7.7** 3.0 Highest parental occupational
status 0.73*** 0.1 0.72*** 0.1 0.71*** 0.1 0.68*** 0.1 Number of books at home (levels) 10.6*** 1.1 10.7*** 1.1 10.6*** 1.1 10.5*** 1.1 Motivation (ref. very important)
Important -12.5*** 1.9 -12.2*** 2.0 -12.3*** 1.9 -12.3*** 2.0 Little importance or none at all -25.7*** 3.9 -25.5*** 3.9 -25.8*** 3.9 -26.0*** 3.9 Missing -22.9** 10.6 -22.3** 10.5 -22.4** 10.6 -22.3** 10.6 Expected occupational status at
age 30 (ref. manager or profes- sional)
Lower white-collar -24.2*** 3.3 -24.2*** 3.3 -24.1*** 3.3 -24.2*** 3.3 Skilled worker -36.2*** 4.2 -36.1*** 4.1 -35.9*** 4.1 -35.7*** 4.2 Unskilled worker -21.0*** 3.6 -21.1*** 3.6 -21.0*** 3.6 -21.2*** 3.6 Missing -28.0*** 3.6 -27.9*** 3.5 -27.9*** 3.5 -27.9*** 3.6 School-level variables
Language of instruction in school (ref. Estonian)
Russian -26.8*** 9.6 -29.9*** 9.4 -16.8* 9.4 Mixed -26.2*** 8.0 -22.5*** 8.5 -13.9 8.8 School location (ref. city)
Town -0.3 7.2 3.2 6.6
Village -6.8 8.2 8.2 10.0
Selectivity (ref. low)
High 15.9*** 5.7 10.3** 4.8
School composition (average pa-
rental occupational status) 1.50** 0.7
Deviance 51982 51968 51953 51939
Variance explained at
student level (in %) 28.8 28.8 28.8 28.8 school level (in %) 52.7 55.7 61.3 66.7
Note: controlling for gender and grade, * p<0.10, ** p<0.05, *** p<0.01.
Source: own calculations based on PISA 2006.
6.2.2 The case of Latvia
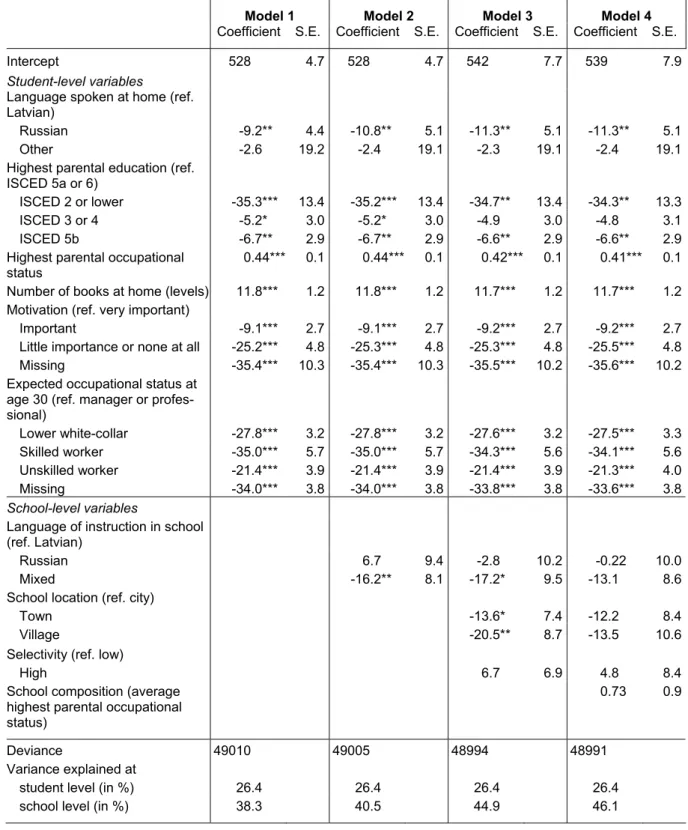
Table 4 presents multi-level models with student and school level variables for Latvia. Model 1 in- cludes all student level characteristics, which explain approximately 26% of variance at student level.
In addition, these student level variables also explain approximately 38% of variance at the school level that refers to varying compositions of schools. Therefore, in Latvia, similarly to Estonia, schools differ significantly regarding students’ social background, language spoken at home, motivation, and aspirations. However, contrary to descriptive analysis, multilevel analysis indicates that students who speak Latvian in their home achieve somewhat better test scores in mathematics compared to stu- dents whose language at home is Russian (Model 1). Thus, concerning similar parental background, occupational aspirations, and motivation, there is a small achievement gap (approximately 9 points) between Russian-speakers and Latvian-speakers).
School level variables appear with steps in the models (each step improved model fit and increased variance explained at school level). I add the language of instruction in school into Model 2. It appears that students in Russian schools perform similarly to students in Latvian schools. Descriptive statistics already indicated that the achievement in Latvian and Russian schools is similar, and taking into ac- count social background, aspirations, and motivation does not change this outcome. In contrast, stu- dents in mixed schools achieve somewhat lower test scores compared to those in Latvian schools.
These effects do not change after including the school location and selectivity into Model 3. The school location accounts significantly for explaining different performance of students, while the selec- tion of students does not have any effect. Thus, regarding similar parental background, there is no ad- ditional benefit to studying in a more selective school in Latvia. In addition, students studying in vil- lages or towns have lower performance than students studying in larger cities.7 Despite controlling for the location of school, students attending mixed schools still perform somewhat lower compared to students in Latvian schools.
The measure of school composition in terms of the average highest occupational status of the parents appears in Model 4. It does not have significant influence on the mathematical performance, but it re- duces the negative effect of studying in mixed school. Thus, the lower test scores in mixed schools are partly explained by the lower socio-economic composition of these schools.
7 Latvian PISA data indicates that the average test score of students in Riga and other urban areas is much higher compared to students from rural areas. However, these regional disparities are largely conditioned by the family background, i.e., students in urban areas have parents with more resources (Geske et al. 2006).
Table 4 The influence of student and school level variables on mathematical performance in Latvia, coefficients and standard errors from multilevel models
Model 1 Model 2 Model 3 Model 4
Coefficient S.E. Coefficient S.E. Coefficient S.E. Coefficient S.E.
Intercept 528 4.7 528 4.7 542 7.7 539 7.9 Student-level variables
Language spoken at home (ref.
Latvian)
Russian -9.2** 4.4 -10.8** 5.1 -11.3** 5.1 -11.3** 5.1 Other -2.6 19.2 -2.4 19.1 -2.3 19.1 -2.4 19.1 Highest parental education (ref.
ISCED 5a or 6)
ISCED 2 or lower -35.3*** 13.4 -35.2*** 13.4 -34.7** 13.4 -34.3** 13.3 ISCED 3 or 4 -5.2* 3.0 -5.2* 3.0 -4.9 3.0 -4.8 3.1 ISCED 5b -6.7** 2.9 -6.7** 2.9 -6.6** 2.9 -6.6** 2.9 Highest parental occupational
status 0.44*** 0.1 0.44*** 0.1 0.42*** 0.1 0.41*** 0.1 Number of books at home (levels) 11.8*** 1.2 11.8*** 1.2 11.7*** 1.2 11.7*** 1.2 Motivation (ref. very important)
Important -9.1*** 2.7 -9.1*** 2.7 -9.2*** 2.7 -9.2*** 2.7 Little importance or none at all -25.2*** 4.8 -25.3*** 4.8 -25.3*** 4.8 -25.5*** 4.8 Missing -35.4*** 10.3 -35.4*** 10.3 -35.5*** 10.2 -35.6*** 10.2 Expected occupational status at
age 30 (ref. manager or profes- sional)
Lower white-collar -27.8*** 3.2 -27.8*** 3.2 -27.6*** 3.2 -27.5*** 3.3 Skilled worker -35.0*** 5.7 -35.0*** 5.7 -34.3*** 5.6 -34.1*** 5.6 Unskilled worker -21.4*** 3.9 -21.4*** 3.9 -21.4*** 3.9 -21.3*** 4.0 Missing -34.0*** 3.8 -34.0*** 3.8 -33.8*** 3.8 -33.6*** 3.8 School-level variables
Language of instruction in school (ref. Latvian)
Russian 6.7 9.4 -2.8 10.2 -0.22 10.0 Mixed -16.2** 8.1 -17.2* 9.5 -13.1 8.6 School location (ref. city)
Town -13.6* 7.4 -12.2 8.4
Village -20.5** 8.7 -13.5 10.6 Selectivity (ref. low)
High 6.7 6.9 4.8 8.4
School composition (average highest parental occupational status)
0.73 0.9
Deviance 49010 49005 48994 48991
Variance explained at
student level (in %) 26.4 26.4 26.4 26.4 school level (in %) 38.3 40.5 44.9 46.1
Note: controlling for gender and grade, * p<0.10, ** p<0.05, *** p<0.01.
Source: author’s own calculations based on PISA 2006.
6.2.3 Russian-speakers in majority language schools
In both countries, students who speak Russian at home achieve lower test scores compared to native language speakers, despite similar individual level characteristics and school context (Table 3 and 4).
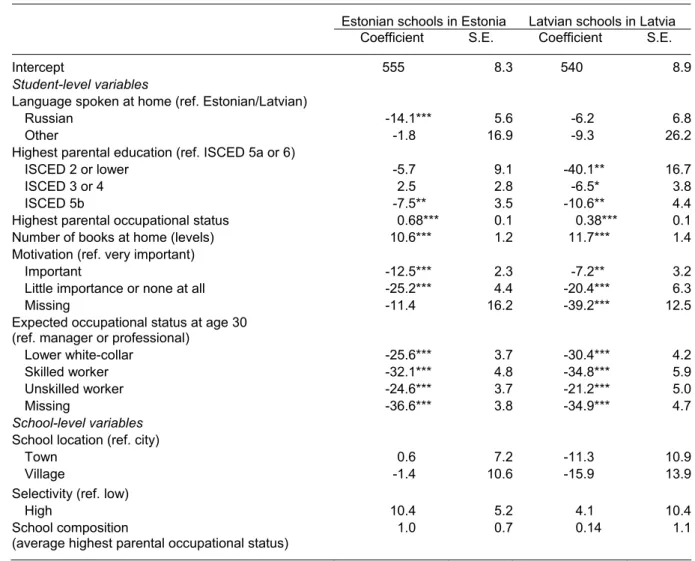
I added the interaction between the language spoken at home and the language of instruction in school into Model 4 for testing how Russian-speakers manage in majority language schools. The re- sults were significant for Estonia, but not for Latvia (models not presented here). In Latvia, it also seems that Russian-speakers in mixed schools perform worse than Latvian-speakers, but that the number of mixed schools in the sample is too small to calculate the reliable estimates.
Table 5 presents separate models for Estonian and Latvian schools. It appears that Russian-speakers achieve significantly lower test scores in Estonian schools compared to Estonian-speakers, even when both share similar parental backgrounds, motivation, aspirations, and school characteristics. The gap between groups is about 14 points. The reason for this difference might be difficulties with the lan- guage, but unfortunately the PISA 2006 study does not include the measure of language skills. In Lat- via, there is no significant difference between the performance of Russian-speakers and Latvian- speakers in Latvian schools. Compared to Estonia, Russian-speaking students in Latvia are more likely to have one parent who is a majority language speaker due to Latvia’s higher ethnic intermar- riage rate.
Table 5 The mathematical performance in majority language schools in Estonia and Latvia, coefficients and standard errors from multilevel models
Estonian schools in Estonia Latvian schools in Latvia Coefficient S.E. Coefficient S.E.
Intercept 555 8.3 540 8.9
Student-level variables
Language spoken at home (ref. Estonian/Latvian)
Russian -14.1*** 5.6 -6.2 6.8
Other -1.8 16.9 -9.3 26.2
Highest parental education (ref. ISCED 5a or 6)
ISCED 2 or lower -5.7 9.1 -40.1** 16.7 ISCED 3 or 4 2.5 2.8 -6.5* 3.8 ISCED 5b -7.5** 3.5 -10.6** 4.4 Highest parental occupational status 0.68*** 0.1 0.38*** 0.1 Number of books at home (levels) 10.6*** 1.2 11.7*** 1.4 Motivation (ref. very important)
Important -12.5*** 2.3 -7.2** 3.2 Little importance or none at all -25.2*** 4.4 -20.4*** 6.3
Missing -11.4 16.2 -39.2*** 12.5
Expected occupational status at age 30 (ref. manager or professional)
Lower white-collar -25.6*** 3.7 -30.4*** 4.2 Skilled worker -32.1*** 4.8 -34.8*** 5.9 Unskilled worker -24.6*** 3.7 -21.2*** 5.0 Missing -36.6*** 3.8 -34.9*** 4.7 School-level variables
School location (ref. city)
Town 0.6 7.2 -11.3 10.9
Village -1.4 10.6 -15.9 13.9
Selectivity (ref. low)
High 10.4 5.2 4.1 10.4
School composition
(average highest parental occupational status)
1.0 0.7 0.14 1.1
Note: controlling for gender and grade, * p<0.10, ** p<0.05, *** p<0.01.
Source: author’s own calculations based on PISA 2006.
7 Conclusion
This paper compared two post-socialist countries – Estonia and Latvia. In general, societal develop- ments and educational systems in Estonia and Latvia have many similar characteristics. In both coun- tries, there exists a large Russian-speaking minority group. Many of them are post-war immigrants or the descendants of such immigrants. During the Soviet era, the clear lines of separation of ethnic communities were visible in these societies, such as the labour market segmentation and the division of the educational system based on language. After Estonia and Latvia regained their independence, uncertainty increased for the Russian-speaking community due to difficulties related with the citizen- ship status and the proficiency in the official language. The need for a stronger integration of society
was one incentive for the school reforms in Estonia and Latvia, which aimed to make Russian schools more bilingual.
Ethnic differences in the educational performance and outcomes are apparent in various societies. It is often emphasised that educational achievement is connected with language skills. Esser (2006) points out that immigrant children usually have to cope with the tasks that are embedded in a linguistic con- text or related to a cultural context closely associated with the language and previous cultural knowl- edge. In contrast, the influence of language skills should be relatively minor in the linguistically divided educational systems, where ethnic minority students have an opportunity to study at least partly in their native language. The results of this paper show that linguistically divided educational systems in Estonia and Latvia produce decidedly different outcomes. In Latvia, students in Russian and Latvian schools achieve similar test scores in mathematics. In contrast, students in Russian schools in Estonia have lower mathematical performance than students in majority language schools.
In Estonia and Latvia, immigrants were not negatively selected in terms of education. The analysis in- dicates that, contrary to findings in several Western European countries, the individual parental back- ground is not the reason for the minority group disadvantage in Estonia. In addition, motivation and aspirations are not the cause of Russian-speakers’ lower achievement in Estonia, although these characteristics have a significant influence on the educational performance. In Latvia, similarly, paren- tal background, motivation, and aspirations seem not to be the factors that would promote especially the Russian-speakers’ performance; instead, they are rather important for all students.
The question remains: How does one explain the achievement gap between students studying in schools with different languages of instruction in Estonia, while there is no such trend in Latvia? More- over, cross-sectional PISA data includes the measurement of performance only at one time point, which complicates concluding whether and how learning in a Russian school directly causes lower educational performance. However, Russian-speaking students who were enrolled in Russian schools in 2006 should not have experienced difficulties due to language skills. In addition, the results show that the gap between Estonian and Russian schools is not directly conditioned by how schools select students regarding the importance of academic ability. Still, students in more selective schools achieve better results, especially in Estonia. Unfortunately, this measure captures the selection proc- ess only partially because parents and students also select the school.
Findings indicate that the lower performance of students in Russian schools is to some extent ex- plained by the socio-economic composition of these schools in Estonia. This has an effect on the achievement despite the individual social background. It has been argued that the socio-economic composition of schools aggregates the influence of school peers on a school experience of students and their academic gains (Portes and Hao 2004). Therefore, it seems that the downward mobility of the Russian-speaking community in Estonia has also had some influence on the social environment of Russian schools. In Latvia, by contrast, the socio-economic composition of schools and their selection practises do not have a direct influence on students’ educational achievement in the case of similar location and type of school.
Besides the composition of schools, differences in the educational performance might be conditioned by organisational characteristics that influence learning opportunities in schools. The curricula differ- ences in mathematics are expected to be minor between Russian and majority language schools in both countries. In Estonia, however, Monakov and Ševtšenko (2003) mention the difficulties in Rus- sian schools related with the transition to a new curriculum in mathematics. An additional explanation might be the teaching methods or focus. The international OECD’s TALIS study in Estonia shows that teachers in schools with Russian as the language of instruction believe more strongly in providing cor- rect solutions to students and they emphasise more the necessity of studying facts than teachers in Estonian schools (Loogma et al. 2009). In addition, the international TIMSS 2003 study shows that the gap in educational performance between eight graders in Russian and Estonian schools is wider in reasoning and analysis, while differences are not significant in terms of factual knowledge and con- ceptual understanding (Mere et al. 2006). Unfortunately, the comparative evidence is not available for Latvia.
An additional question is how educational reforms have influenced the level of trust minorities have in schools in both countries. In Latvia, the transition to bilingual teaching in Russian basic schools started in 2002, while the reform is still ongoing in Estonia. It has been argued that the way the minority com- munity perceives their treatment in society influences their trust in the educational system and their certainty about the maintenance of their minority group identity (Ogbu and Simons 1998). Community forces may influence the certainty of Russian-speaking students in Estonia and Latvia. For example, the Russian community has pointed out that the transition to bilingual teaching in Russian schools may be a threat to their identity (Hogan-Brun 2007). However, recent educational reforms mean that schools in Estonia and Latvia are changing and it is crucial to see whether ethnic differences in educa- tional performance are persistent over a longer time period.
The number of Russian-speaking students in Estonian or Latvian schools is growing (Hogan-Brun et al. 2007; Kehris and Landes 2007). Results indicate that Russian-speakers studying in the majority language in Estonia perform significantly lower than other students, while no such clear disadvantage is visible in Latvia. One reason might be the language skills of students or even parents, which means that parents are able to offer only limited help with schoolwork. However, in Latvia, minority parents who choose Latvian schools often have some proficiency in Latvian (Priedīte 2005). Unfortunately, not much is known about the language skills of Russian-speaking parents in Estonia.
A comparison of Estonia and Latvia reveals that an opportunity for students to study in their own na- tive language does not reduce ethnic differences in the educational performance in these countries.
Latvia’s case shows that minority students manage well in Latvian schools and also in Russian schools. In Estonia, on the contrary, Russian-speaking students studying in Russian schools or Esto- nian schools achieve lower test scores compared to their Estonian-speaking peers. The integration context of the country might be an important factor that influences educational performance. Com- pared to Estonia, the distance between the majority and Russian-speaking minority is smaller in Latvia in terms of socio-economic position, social interaction, geographical distribution, and interethnic mar-