Andrea Schäfer Ingrid Tucci Karin Gottschall
Top Down or Bottom Up?
A Cross-National Study of Vertical Occupational Sex Segregation in Twelve European Countries
ZeS-Working Paper No. 04/2011
WORKING PAPERS
Zentrum für Sozialpolitik Universität Bremen Postfach 33 04 40 28334 Bremen Phone: 0421 / 218-58500 Fax: 0421 / 218-58622
E-mail: srose@zes.uni-bremen.de Editor: Dr. Christian Peters
http://www.zes.uni-bremen.de Design: cappovision, Frau Wild ZeS-Arbeitspapiere ISSN 1436-7203
Andrea Schäfer University of Bremen
Centre for Social Policy Research (ZeS) a.schaefer@zes.uni-bremen.de Dr. Ingrid Tucci
DIW Berlin
Socio-Economic Panel Study (SOEP) itucci@diw.de
Prof. Dr. Karin Gottschall University of Bremen
Centre for Social Policy Research (ZeS) k.gottschall@zes.uni-bremen.de Andrea Schäfer
Ingrid Tucci Karin Gottschall
Top Down or Bottom Up?
A Cross-National Study of Vertical Occupational Sex Segregation in Twelve European Countries
ZeS-Working Paper No. 04/2011
Starting with a comparative assessment of different wel- fare regimes and political economies from the perspec- tive of gender awareness and “pro-women” policies, this paper identifies the determinants of cross-national varia- tion in women’s chances of being in a high-status occupa- tion in twelve West European countries. Special emphasis is given to size and structure of the service sector, includ- ing share of women in public employment and structural factors such as trade union density and employment pro- tection. The first level of comparison between men and women concentrates on gender representation in the higher echelons of the job hierarchy, while in the second section we extend the scope of analysis, comparing wom- en in high-status occupations and low-wage employment in order to allow for a more nuanced study of gender and class interaction. The first analysis is based on European Social Survey data for the years 2002, 2004, 2006, and 2008, capturing recent trends in occupational dynamics.
Results indicate that in general a large service sector and a high trade union density enhance women’s chances of being in a high-status occupations while more specifically a large public sector helps to reduce channeling women in low-wage employment. Thus, equality at the top can well be paired with inequality at the bottom, as postindustrial countries with a highly polarized occupational hierarchy such as the UK show.
Keywords: occupational sex segregation, gender equality, public sector employment, cross-national comparison
JEL classification: P5 comparative economic systems; D6 - Welfare Economics; J2 - Demand and Supply of Labor
AB ST r Ac T
Acknowledgements
The authors thank Fredrik Engelstad, Wim van Oorschot,
and four anonymous reviewers for valuable comments on
earlier versions of this paper. The authors are responsible
for all remaining mistakes.
1. Introduction 9 2. State of Research and Hypotheses 12
3. Data, Countries, Variables, and Method 18
4. Underrepresentation of Women in High-Status Occupations and National
Variation 25
5. Effects of National Characteristics on the Degree of Polarization of Women in
Low-Status and High-Status Occupations 31
6. Discussion 34
References 37
co n Te n T
Over the last several decades, women in Western countries have taken on ever in- creasing roles in the workforce. Triggered by the growth of the service economy and the expansion of the welfare state, wom- en’s participation in higher education and the labor market has increased. Evidence of women’s growing labor market integra- tion include rising maternal employment rates and more continuous work biogra- phies, women’s inroads into professions such as law and medicine, and into the upper echelons of corporate management (European Commission 2009). Neverthe- less, Western welfare capitalism is char- acterized by a persistent and highly gen- dered division of labor that places women at a distinct disadvantage. Women still shoulder most of the burden of household and care work, and they also face more inequality and risks to their integration into the workforce and to their position in the occupational structure. Despite the educational gains that have been made in recent decades and the trend towards more stable employment biographies, women are still underrepresented in high- status occupations and subject to a sub- stantial gender pay gap across industries and occupations (European Commission 2009a). Obviously, the persistent gender (and social) gap in earnings (Rubery et al.
2005) and in access to higher positions is at odds with widely accepted gender equality norms and meritocratic beliefs (see Esping-Andersen 2009: 55). Persist- ing gender inequality is an ongoing sub-
ject of public debate on the national and international level, not least because the lack of gender equality in the labor mar- kets of leading industrial countries poses a threat to productivity growth and com- petitiveness in ever more globalized and knowledge-intense economies (Serrano and Mósesdóttir 2003; Walby et al. 2007).
Both strands of debate raise questions about how to explain gender inequality and how to address it politically. Answers are not easily found, in large part because gender inequalities in the labor market vary substantially across Western Europe- an countries. So far, these cross-national differences have been attributed to wel- fare state variation, with social-democrat- ic welfare states being more successful in improving women’s economic position.
Eminent scholars in comparative and feminist welfare state research have ar- gued that only universal and highly redis- tributive welfare regimes are capable of creating “women-friendly states” (Hernes 1988: 188) or “women-friendly policies”
(Esping-Andersen et al. 2002: 70pp; 2009:
91), reducing gender inequalities on the labor market and within the family. How- ever, some assumptions concerning this
“women-friendly” approach have recently been called into question, particularly the idea that countries with highly developed welfare states and generous social policy packages—such as those in Scandinavia which seek to reconcile work and care—
are more favorable to women’s social equality than the liberal welfare states (Es-
1. Introduction
also have affected female participation in the labor market. Third, while it makes sense to focus on women’s chances of reaching the top of the occupational lad- der, especially in light of recent female educational gains, in times of labor mar- ket deregulation it seems necessary to take a broader perspective on the occu- pational hierarchy to fully evaluate gender equality. Equality at the top might, after all, be paired with inequality at the bot- tom, and more generally, the composition of the job hierarchy might have different effects on gender equality. Indeed, dur- ing the last decade, a twofold dynamic of upward and downward evaluation of labor has emerged in some countries, affecting women more than men. In Germany, for example, women have made inroads into some high-status professions, but their share and numbers have also increased substantially in the expanding low-wage service sectors (Kalina and Weinkopf 2006; Bosch and Lehndorff 2005).
Against the backdrop of these recent developments, the next chapter examines current levels of sex segregation in the la- bor market, comparing the positioning of men and women within the job hierarchy in both the public and private sectors of different European countries. 2 We start
2 This contribution concentrates on gender segregation in the labor market only, although we recognize that the gendered division of labor between paid and unpaid work and the uneven participation of women and men in paid work are two interrelated aspects of gender inequality.
Two basic dimensions of gender segregation in the labour market have been established in the literature: The first one deals with the measure- ment of inequality between men and women in terms of their positioning in the job hierarchy tévez-Abé et al. 2001; Estévez-Abé 2001,
2005, 2006, 2009). This research argues in favor of liberal market economies that seek to minimize government support and state regulation while maximizing individual choice, risk, and responsibility, emphasizing equal rights in the market which in turn might lead to better repre- sentation of women in upper-level posi- tions. But as pointed out by Plantenga et al. (2009) gender equality should be as- sessed as multidimensional 1 : some coun- tries such as the UK might perform badly on equal pay but better with respect to the distribution of socio-economic power be- tween men and women, for example.
While a rich body of research, includ- ing the aforementioned studies, offers insightful and persuasive analyses of vari- ations in occupational sex segregation, there are still some shortcomings. First, many studies analyzing women’s access to high-status positions focus on the pri- vate sector. Thus, they do not capture the complex expansion process of the service sector under welfare capitalism and in particular the role of the state as an em- ployer, affecting the extent and standards of female employment as well as the pat- terns of gender segregation (Bettio and Verashchagina 2009). Furthermore, most studies are based on cross-sectional data from the late 1990s and early 2000. How- ever, continuous and rapid changes in labor markets and family structures may
1 The European Union Gender Equality Index developed by Plantenga et al. (2009) considers four dimensions of gender equality: equal sharing of decision-making power, time, money, and paid work.
by focusing on gender representation in top positions and women’s chances of being in a high-status occupations. The second level of comparison concentrates on women only, but extending the scope of analysis to the distribution of women between high-status and low-status oc- cupations in different welfare economies.
Here, the following questions are ad- dressed: To what extent are women rep- resented in high-status occupations? How are women distributed in the hierarchy of jobs? We believe that focusing on the development of the service sector - in par- ticular the role of the state as an employer and the extent of the low-wage sector in different regimes - can improve our un- derstanding of what accounts for national differences in the underrepresentation of women in high-status occupations. By ex- tending the view to the intra-gender oc- cupational distribution, i.e., the relation of the share of women in low-status occupa- tions to the share of women in high-status occupations, the investigation also allows for a more comprehensive and nuanced analysis of gender and class effects across countries.
In the next section, we lay out our ar- gument in greater detail and review the literature on the cross-national analysis of women’s access to high-status occu- pations, proposing testable hypotheses.
After explaining research design and methods a further section presents our
(vertical segregation), while the second dimension refers to the distribution of men and women across industries or branches (horizontal segregation) (Blackburn et al. 2001; Blackburn 2009; Charles and Grusky 2004).
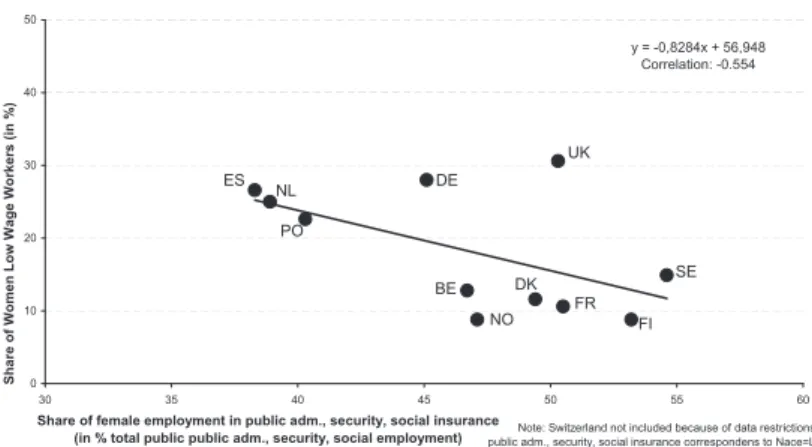
empirical results based on multilevel anal- yses of women’s access to high-status oc- cupations using pooled data from the Eu- ropean Social Surveys (2002, 2004, 2006 and 2008). We first test whether women are better represented in high-status oc- cupations in liberal market economies (LMEs) than in coordinated economies (CMEs). Second, we investigate how the public/private mix in the service sector as well as social protection and collective coordination affect women’s chances of entering high-status occupations. A fur- ther section refers to the comparison of women’s distribution in low- and high- status occupations. Here we analyze the correlation between the percentage of full-time female workers in low-wage jobs and both the percentage of women in the public sector and trade union density in the selected countries. Finally, we discuss the role of public sector size for differ- ences between the countries and address the impact of occupational polarization on gender equality, taking into account fac- tors that affect women’s representation in the lower and upper end of the occupa- tional hierarchy.
The growing research interest in wom- en’s access to high-status occupations has been spurred by the increasing female labor market participation in most Euro- pean countries, which have seen rising employment rates and a rise in full-time employment during the last two decades. 3 However, although more women are pur- suing careers, their underrepresentation in some occupations and concentration in others remains very widespread. Eu- ropean cross-country statistics show that the percentage of employed women who would need to change occupations in or- der to bring about an even distribution of men and women among occupations is quite high: 59 percent in Finland, 54 percent in France, Germany, Sweden, and Norway, and 51 percent in the UK (Eu- ropean Commission 2009b: 93). Further- more, findings showing a continuously rising percentage of women in manage- ment (Eurostat, Database on Women and Men in Decision Making (WMID)) do not give the full picture, since rising percent- ages of women in middle management in both the public and private sectors have not been accompanied by rising percent-
3 Labour force participation has risen on average by about 4 percent for European countries from 1992 to 2009 (Eurostat 2010), with the highest increase in Spain. The overall female full-time employment rate in Europe is on average 36 percent, with the Netherlands showing the lowest (21 percent) and Finland (45 percent) showing the highest rates in 2008 (UNECE Statistical Division Database 2010).
ages of women in top management in the private sector: a phenomenon well known as the glass ceiling effect. While coun- tries such as Portugal and Norway with a below-EU average (33 percent) share of women in top positions have made more progress in recent years than countries such as France, the UK, and Spain with above-average percentages, none of the national percentages match the overall representation of women in the respec- tive industries (data for 2009; Eurostat, Database on Women and Men in Decision Making (WMID)). 4
Thus, gender segregation both along the job hierarchy and along industries and/or manual and non-manual work re- mains a persistent feature of all Western industrialized countries (Anker 1998;
Charles and Grusky 2004). Research on the factors perpetuating the widespread sex segregation in labor markets has identified employer and institutional dis- crimination, self-evaluation, expected
4 The slow improvement of women’s access to leadership positions is seen even more clearly when looking at the share of women on the executive boards of the largest publicly quoted companies. In 2009, only 11 percent of execu- tive board members in the EU-27 were women (as compared to 9 percent in 2003). Scandinavian countries (Norway, Sweden, Finland and Denmark) as well as the UK, Netherlands, and Germany were at the top of the list with a share of women above the EU-27 average. Moreover, the Scandinavian countries and also the Netherlands, France, and Spain showed the highest increase between 2003 and 2009, although starting from different baseline values (UNECE Statistical Division Database 2010).
2. State of Research and Hypotheses
sanctions, labor force commitment, sta- tistical discrimination, and networks as potentially salient (Charles and Grusky 2004: 16, Table 1.1). From these results, some scholars conclude that universal norms of “gender essentialism” related to male dominance and authority play an important role in accounting for both the universal gender segregation between manual (male) and non-manual (female) occupations and the gender segregation within manual and non-manual occupa- tional hierarchies common to all countries (Charles 2003).
More specifically, research on dif- ferential work rewards indicates that the class ceiling effect, namely disadvan- tages in promotion to highest positions that cannot be explained by job-relevant characteristics of the employee, is gender specific while racial inequalities (among male workers) seem to follow a different pattern (Cotter et al. 2001). On the mi- cro level, this gender bias is reflected in different male and female employment biographies, while, at the same time, individual-level factors such as educa- tional attainment, age, and family obli- gations seem to account for differences in labor market integration and careers in both women and men (Häusermann and Schwander 2009; on professions see Leuze and Rusconi 2009; Charles et al 2001; Brewster and Rindfuss 2000). 5 These findings indicate that to understand sex segregation, both macro (institution- al) and micro (individual) factors have to be taken into account.
5 On recent employment trends for men and women (see ILO 2010).
Notwithstanding the aforementioned similarities in sex segregation across countries, there are persistent differences among industrialized countries in the de- gree and nature of occupational sex seg- regation resulting from varying structural features of the labor market, political and social policies, religious and value sys- tems, educational systems and organiza- tional structures. A convincing argument based on a comprehensive OECD-wide study on sex segregation in terms of the gender divide between manual and non- manual jobs (defined as horizontal seg- regation) holds that the main reason for this type of segregation is the level of post-industrial restructuring of the labor market, in particular the expansion of the service sector and the level of economic rationalization. 6 In this view, progres- sive tertiarization opens up new employ- ment opportunities for women as tasks designated as “female” multiply (Charles 1992; Charles and Grusky 2004). Indeed, countries with highly developed post-in- dustrial economies—i.e, the Anglo-Saxon and continental European countries —are characterized by large service sectors in- cluding high shares of personal and social services, often dominated by a female workforce and characterized by part-time work, low wages and poor career oppor- tunities. This “pink-collar ghetto” contrib- utes to more pronounced sex segregation than in countries with a smaller service sector (Charles 2005). These findings
6 The term service sector applies here to non- manufacturing occupations and jobs including for-profit and public (state and non-profit) employ- ment.
are corroborated by a study by Mandel and Semyonov (2006), who demonstrate, again based on a comparison among OECD countries, that a large public sector and a massive influx of women into occu- pations coined as “female” perpetuate the traditional gender division of labor and lead to increased horizontal occupational sex segregation.
So far, this argument helped to under- stand the overall high level of gender seg- regation along manual and non-manual jobs in post-industrialized countries and welfare economies (as compared to less industrialized countries), but it leaves open the question of vertical segregation, defined as the distribution of women and men along the job hierarchy. According to Charles (2003), the level of post-industrial restructuring also affects vertical occupa- tional sex segregation since tertiarization not only creates a pink-collar ghetto but also increases the number of top posi- tions in service industries, which are more open to women than higher ranks in manufacturing. 7 Charles’s findings indi- cate that vertical sex segregation is more pronounced in the manual sector than in the non-manual sector, and that women have made more inroads into professional occupations than into skilled manual oc- cupations. Thus, desegregation seems to be greater in professional and managerial occupations (England 2005). Against this backdrop, we hypothesize that women in
7 Charles argues that economic rationalisation
“also generates new opportunities for smaller numbers of elite, career-committed women in the managerial sector, which grows in response to the problems with coordinating and supervising the additional low-level workers” (Charles 2005: 304).
countries with a large service sector have higher chances of being in high-status oc- cupations (Hypothesis 1a).
However, not only the size but also the structure of the service sector has to be taken into account, as the composition of the service sector and careers in the ser- vice industry vary across countries and impact on the overall gender structure of occupations (Fligstein 2001; Webb 2009).
In contrast to the production sector, ser- vice sectors in Western welfare states tend to be very heterogeneous, consisting of both commercial services/industries and public services, the size of which usu- ally varies by welfare regime. By offering extensive educational, health, and care services, the state acts as an important provider of social services and as a major employer of women, thereby promoting their integration into the labor market. 8 As comparative and country-specific re- search shows, public employment tends to enhance female careers. In a recent study, Mandel and Shalev claim that the public sector offers women more (semi-) professional jobs than private firms in the service sector (2009). This is in line with Kolberg’s earlier analysis of Scandinavian countries (1991), which demonstrates that women in Denmark have a higher chance of being in management in the public sec- tor than in the private sector. Looking at
8 The impact of state employment on women, however, does not only depend on the level of state employment as such, but also on its sectoral structure. While public employment in social services tends to be feminized, employment in infrastructure services such as railways, water, and energy and in state-owned enterprises tends to be male-dominated.
the earnings differentials between men and women in the public and private sec- tors based on Luxemburg Income Study data, Gornick and Jacobs (1998) find that the share of workers in managerial posi- tions is higher for both men and women in the public sector than in the private sec- tor; and that women employed in the pub- lic sector have a better chance of holding such positions compared to women in the private sector. However, women’s inroads into the whole range of public sector positions could also be explained or accompanied by a “downgrading of both the status of public sector employ- ment and its associated job security”
(Rubery, Smith and Fagan 1999: 218). In- deed, there is evidence that, for instance, higher positions in the public sector are associated with less prestige and income than comparable positions in the private sector (Tepe 2009; Tepe and Kroos 2010).
Nevertheless, findings suggesting that the percentage of women in upper-level posi- tions is higher in the public sector than in the private sector (whether services or production) seem plausible as the state has long served as a model employer, not only with respect to working conditions and job security but also with respect to the institutionalization of training, career tracks, and gender equality (Tepe et al.
2010). Additionally, comparative welfare state analysis shows that public or public- ly funded service provision varies across welfare regimes and this in turn impacts on the level of public employment. An analysis of women’s chances of assuming high-status occupations should therefore not be limited to the private sector but should extend to the public sector. Dif-
ferentiating the service sector argument presented above, we expect that women in countries with a large share of women in the public sector have better chances of being in high-status occupations (Hy- pothesis 1b).
The service sector argument present- ed above is broad stroke in the sense that it refers to more general secular macro- economic dynamics such as tertiarization and welfare state expansion. At the same time, research more sensitive to national differences and focusing more specifi- cally on the determinants of women's ac- cess to managerial occupations 9 is still scarce, not least due to the difficulties of finding indicators that are compara- ble across many countries. Neverthe- less, existing research indicates that the national context matters: More specifi- cally, several cross-national studies have confirmed that women’s opportunities to access managerial positions differ de- pending on the national institutional con- text (Charles 1992; Davidson and Burke 2004; Mandel and Semyonov 2006). An institutional feature of special interest is social protection regulation, as countries obviously differ in the degree of employ- ment protection provided and enforced by the government. A prominent politi- cal economy argument following the Va- rieties of Capitalism (VOC) approach put forward by Estévez-Abé (2001; 2005;
2006) is that countries with strong em-
9 In several studies, individual, organizational and cultural-ideological barriers are identified as rea- sons for a severe underrepresentation of women in managerial occupations at the national level (Holst et al 2009; Holst and Busch 2010; Powell and Graves 2003; Blum, Fields and Goodman 1994).
ployment protection do not actually fa- cilitate women’s access to management, at least in the private sector. 10 Drawing on a rational choice perspective, Estévez- Abé argues that strong employment pro- tection regulations promote firm-specific skills demanding high investments on the side of the employer. According to this argument, hiring women means risk- ing that their work will be interrupted due to reproductive or care-related re- sponsibilities. As a result, employers are more likely to choose male workers, who in turn tend to be promoted to higher po- sitions since firing men would mean that firms would lose the skills investments they had made in these workers. The em- pirics testing this relationship between employment protection and women’s ac- cess to high-status positions indicate that the share of women in management posi- tions is higher in liberal market econo- mies characterized by low employment protection than in coordinated market economies where employment protec- tion is high (Estévez-Abé 2001; 2005). 11
10 The VOC approach developed by Hall and Sos- kice (2001) and refined from a gender perspective by Estévez-Abé and colleagues (1999, 2001, 2005) identifies gendered consequences of key institu- tions, such as the production system, modes of skill formation, and social protection that sustain distinctive models of capitalism. Though not initially developed to explain cross-national differ- ences in gender relations (Soskice 2005) the work of Estévez- Abé, Iverson, and Soskice (2001) can be credited with broadening the explanatory scope of VOC by differentiating the all-encompassing cat- egory of coordinated market economies to include mixed cases, uncovering differences between continental and Scandinavian coordinated market economies (Shire and Gottschall 2007).
11 Additionally, Estévez-Abé (2005) argues that
However, the notion that liberal mar- ket economies are more favorable to women’s careers might be biased, since the analysis is restricted to the private sector, thus not taking into account the concentration and work conditions of women in the public sector, which is especially important in countries with a strong welfare state. Public sector em- ployment might offer better work con- ditions due to better representation and influence of unions. Drawing on findings that report better chances for advance- ment of women in the public sector as compared to the private sector (Kohlberg 1991; Mandel and Shalev 2009), we might assume that women have higher chances of being in a high-status occupa- tion in countries with a high trade union density (Hypothesis 2a) and in countries with strong employment protection (Hy- pothesis 2b). In this case, a large public sector absorbing a high share of the fe- male workforce and serving as a model employer should outweigh the disadvan- tages women face in recruitment and ca-
generous maternity and parental leave schemes are unable to counteract this gender bias, since they tend to induce an exit from employment. In line with this, Mandel and Semyonov (2006) find in a comparative study that high scores on the Welfare State Intervention Index are correlated with lower odds of women attaining managerial positions. Their results indicate that women are less likely to have managerial positions in Den- mark, the Slovak Republic, and the Netherlands, but more likely in Canada, the United States, and Switzerland. However, Kelley (2007), in a more comprehensive analysis drawing on a compari- son of 39 nations and taking into account hours worked, comes to the conclusion that welfare state policies on maternity neither hinder nor help women in holding such positions.
reer promotion in the private sector.
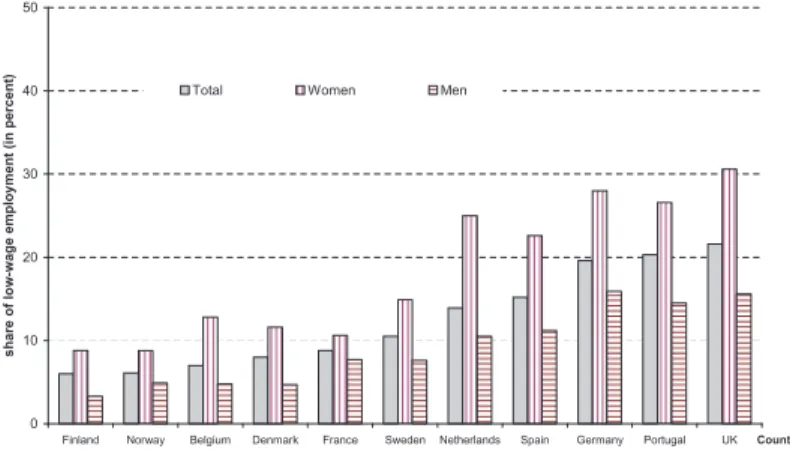
Representation of women in senior positions and top management can be seen as an important indicator of pro- gress in gender equality. Nevertheless, to fully evaluate gender equality in the labor market, we need to take a broader perspective encompassing the entire oc- cupational hierarchy. Equality at the top might well be paired with inequality at the bottom, and more generally the com- position of the job hierarchy might have different effects on gender equality. The issue of equality raises the question of the occupational distribution of women, that is, what effect labor market structure might have on women’s risks of ending up in low-status occupations. As Mason and Salverda (2010) - referring to Denmark, France, Germany, the Netherlands, the UK and the US - indicate, the probability of a worker being in low-wage employ- ment is greater for women than for men.
There are, however, remarkable between- countries variations in the quantitative importance of these effects. Further, Ap- plebaum (2010) showed how strong the share of low-wage work across countries varies with the same industry and activ- ity. If high-skilled women have a greater chance of being in a high-status occupa- tion in liberal economies than in coor- dinated economies, low-skilled women might benefit from institutional patterns such as generous maternity and parental leave schemes, and the strong employ- ment protection prevalent in coordinated market economies. Indeed, there is evi- dence that welfare state regulations affect women differently depending on their social class (Mandel and Shalev 2009,
Christofi des et al 2010). In this vein, Charles and Grusky (2004) emphasize the interrelation of class and gender. They ar- gue that the expansion of the service sec- tor is associated with a “polarization” of women’s occupational distribution, since many women are trapped in jobs requir- ing few to no qualifications and offering dismal career prospects, while a smaller group of highly qualified women are able to climb the ladder in the expanding ser- vice industries. Therefore, we assume that in countries with a large service sector, the percentage of women in high-status occupations is higher, but that their per- centage in low-status occupations is also higher. At the same time, if the public sector is large and absorbs considerable numbers of women, they will be concen- trated in the middle of the occupational hierarchy. Gornick and Jacobs (1998) show, for example, that the earnings ad- vantage of working in the public sector is higher for those situated at the lower end of the earnings distribution. Thus, we expect that in countries with a large percentage of women in the public sec- tor, the percentage of women in low-wage employment will be lower (Hypothesis 3a). Since strong unions contribute to fa- vorable earnings and working conditions we assume that welfare states with a high trade union density will be characterized by a low percentage of women in low- wage employment (Hypothesis 3b).
As shown above, the multifaceted re- lationship between gender and national labor market institutions is impossible to understand by means of one or two broad, macro-level concepts; it requires the consideration of a complex set of in- dividual-level and macro-level factors. To that end, data from different sources are combined to test the first four hypotheses (1a-2b). The individual-level data are avail- able through the European Social Survey (ESS). The data were gathered through face-to-face interviews with one individual aged 15 and over per private household providing information at the individual level about his or her occupation. The first round of this biannual survey was conduct- ed in 2002 and the data from the fourth round were released recently. To test the stated hypotheses we use all four waves of the European Social Surveys (2002, 2004, 2006 and 2008) (Jowell and Team 2004;
Jowell and Team 2007; Team, Fitzgerald et al. 2008; Team 2010). These surveys contain a core module of individual-level questions on occupational position and level of responsibility, respondent’s socio- demographic background, and firm infor- mation for people living in Europe in each round. The items that are investigated in this paper are part of the core module and therefore it is possible to combine data from different rounds.
It was possible to construct a com- bined dataset for 12 European countries (of the 31 European countries in 2008) for all four years (N=48 cases), of which 10
were members of the EU before 2004 12 : Belgium (BE), Denmark (DK), Finland (FI), France (FR), Germany (DE), the Netherlands (NL), Portugal (PT), Spain (ES), Sweden (SE) and the United King- dom (UK). Additionally, Switzerland (CH) and Norway (NO) are included 13. Since the data for Ireland, Greece, Austria and Luxembourg were incomplete, these countries were excluded from the analy- sis.
These individual level data are merged with data measuring national labor market institutions and other country characteris- tics. National level data are taken from two different sources for all four years (Euro- stat and OECD).
The source for the aggregated data on low-wage to prove the last two hypoth- eses (3a and 3b) is Eurostat's Structure of Earnings Survey (SES) for the year 2006. 14
12 New EU member states are not included as their labor market structures are still influenced by the former state socialist regime and EU regula- tions on anti-discrimination and gender equality in the workplace (e.g., 84/635/EWG, 2002/73/EG) have only been adopted recently. Further, only countries who participated in all four waves of the European Social Surveys are taken into account.
13 See Table A1a in Appendix for share of re- spondents in each country.
14 The SES 2006 covers enterprises with at least 10 employees and in all economic activities except agriculture, fishing, public administration, private households and extra-territorial organisations (NACE Rev. 1.1 classification: sections C to O) and all persons employed—with an employment contract—, except, for example, self-employment;
Board of Directors members; directors/manag- ers paid by way of profit share or by fee. Earnings
3. Data, Countries, Variables, and Method
Further, we used data on women in man- agement from the European Commission database on Women and Men in Decision Making (see Table A2a an A2b for details).
The individual and national data em- ployed here are not without limitations:
ESS survey sample size varies over time and country. Thus, in some countries the same respondents are observed over all rounds and in others the sampling varies from round to round. This might have an effect on sample size of high-status occu- pations. Further, national data introduces problems such as common interpretation, use of crosswalks from national classifica- tions and culture of job titles, status and work organization. However, we have de- tailed information on occupational status and labor market structure, which allows us to investigate the effects of national factors on labor market status. Given the representative sample, we are in a posi- tion to conduct a more detailed empirical analysis also from a gender perspective.
Rationale for Selection of Countries
The choice of countries represents all types of market economies (Estévez- Abé 2005): Belgium, Germany, the Neth- erlands and Switzerland represent the continental coordinated market econo- mies (CMEs); Norway, Denmark, Finland and Sweden represent the Scandinavian CMEs; France, Portugal, and Spain are mixed cases; and the UK represents the liberal market economies (LMEs). Fur- ther, Belgium, France, Sweden, Germany,
cover full-time workers.
the UK, and Switzerland are included to represent advanced post-industrial coun- tries; and Portugal as a less advanced post-industrial economy, as suggested by Charles and Grusky (2004). However, countries are also chosen in order to en- sure a between-countries variation of female labor market integration, i.e., in- cluding countries such as the Scandina- vian coordinated market economies with a high share of women in the labor mar- ket and countries as well as liberal market economies with a relatively low share of women in labor market (see footnote 30).
Measuring High-Status Occupations
Occupations of full-time and part-time respondents are defined on the basis of the International Standard Classification of Occupations (ISCO88). 15 High-status occupations are therefore defined as managers, senior officials, legislators, directors or chief executives (ISCO88 11, 12, 13) 16 irrespective of the sector the in- dividual is working in, since we consider both the public and the private sector
15 Corresponding question: What is/was the name or title of your main job? In your main job, what kind of work do/did you do most of the time? What training or qualifications are/were needed for the job?
16 The indicator for high occupational status is adequate, since the share of those with a leader- ship position (about 80 percent) and the number of employees (42 on average) is high (see Appendix/
Table A1b). It is important to note that occupational classification schemes such as the ISCO 88 suffer from a gender bias in over-reporting male-dom- inated occupations while failing to differentiate female-dominated occupations to an equal degree (see Tijdens 1996; Hakim 1996).
here. At the individual level within each country, the indicator variable is 1 for those whose self-assessed occupational status corresponds with the aforemen- tioned ISCO88 categories and 0 for all other employed respondents.
Measuring Low-Wage Employment
In order to show the degree of polari- zation of women's position the labor mar- ket (ratio of female in high-status to female in low-status employment) in the second section of the study, the share of female low-wage full-time workers is measured as follows: A woman in full-time employ- ment is defined as a low-wage earner when her annual gross earnings are less than two-thirds of annual full-time median gross earnings (Eurostat, SES 2006). This approach avoids the difficulties of defin- ing an absolute level of low-wage that is difficult to compare across countries and is in line with the definition used at the OECD and EU level as well as in many other national studies. For all countries in our sample, it holds true that employ-
ment in high-status occupation relates to high mean gross annual earnings and employment with low-wages corresponds to occupations such as service and craft workers or elementary occupations (Casa- li and Gonzalez 2010: 3). Thus, we use low-wage employment as an equivalent to low-status employment.
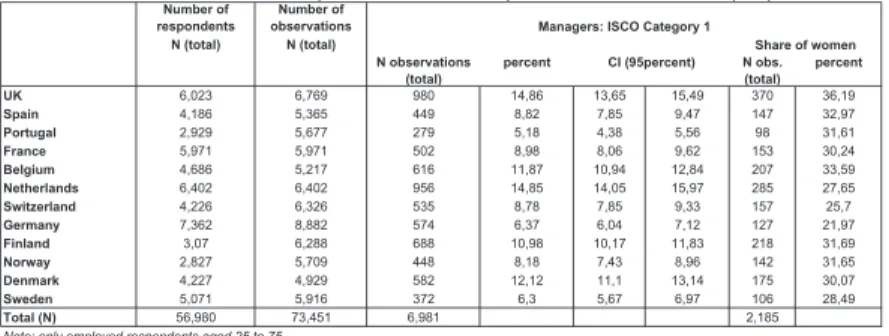
For the first analysis we use pooled data because there are few women in high-status occupations, as the low num- bers of female respondents over the four years indicate (Table 1). The pooling of the four rounds creates a dataset includ- ing information about 56,980 individuals living in 12 EU countries, of which 29,169 are women. The number of respondents by country and survey year combina- tions is summarized in Table 1. Only re- spondents aged 25–75 who are employed full-time or part-time are included since people younger or older would yield se- lectivity problems in terms of completion of education and labor force participation.
Since we only lost about 9 percent of the observations each year due to missing information on the dependent variable,
Table 1: Number of Observations and Respondents across 12 European Countries for 2002-2008 (ESS) Number of
respondents Number of observations N (total) N (total)
N observations
(total) percent N obs.
(total) percent
UK 6,023 6,769 980 14,86 13,65 15,49 370 36,19
Spain 4,186 5,365 449 8,82 7,85 9,47 147 32,97
Portugal 2,929 5,677 279 5,18 4,38 5,56 98 31,61
France 5,971 5,971 502 8,98 8,06 9,62 153 30,24
Belgium 4,686 5,217 616 11,87 10,94 12,84 207 33,59
Netherlands 6,402 6,402 956 14,85 14,05 15,97 285 27,65
Switzerland 4,226 6,326 535 8,78 7,85 9,33 157 25,7
Germany 7,362 8,882 574 6,37 6,04 7,12 127 21,97
Finland 3,07 6,288 688 10,98 10,17 11,83 218 31,69
Norway 2,827 5,709 448 8,18 7,43 8,96 142 31,65
Denmark 4,227 4,929 582 12,12 11,1 13,14 175 30,07
Sweden 5,071 5,916 372 6,3 5,67 6,97 106 28,49
Total (N) 56,980 73,451 6,981 2,185
Note: only employed respondents aged 25 to 75
Source: European Social Surveys (2002, 2004, 2006, 2008), percentages are weighted with design weights; authors' calculations.
Managers: ISCO Category 1
Share of women CI (95percent)
we decided not to impute or substitute missing values. 17 Furthermore, about 15 percent of responses on the dependent variable are lost due to selection criteria (age, employment, missing independent variables). Overall, the pooled data set contains 6,981 observations from 5,588 respondents in high-status occupations, of which 2,185 observations correspond to 1,743 women in high-status occupa- tions.
The share of employees in high- status occupations in our sample varies widely between countries, from about 15 percent in the Netherlands to about 5 percent in Portugal. Interestingly, those figures correspond to the share of wom- en as members of boards in the largest publicly quoted companies published by the European Commission (see Database on Women and Men in Decision Mak- ing (WMID), 2010), even if the concepts used are different. However, the share of women in high-status occupations ranges on average from 22 percent in Germany to 36 percent in the UK. Germany, Portugal, Spain, France, Norway, and Sweden have rather low shares of people in high-status occupations, whereas the UK, Belgium, the Netherlands, Finland, and Denmark have higher shares.
17 Women were responsible for about two-thirds of the missing information on the dependent variable. Most of the respondents with missing information on the dependent variable (about 86 percent) state that they are not employed.
Individual and Macro-Level Measures of National Variations in Women’s Underrepresentation in High-Status Occupations
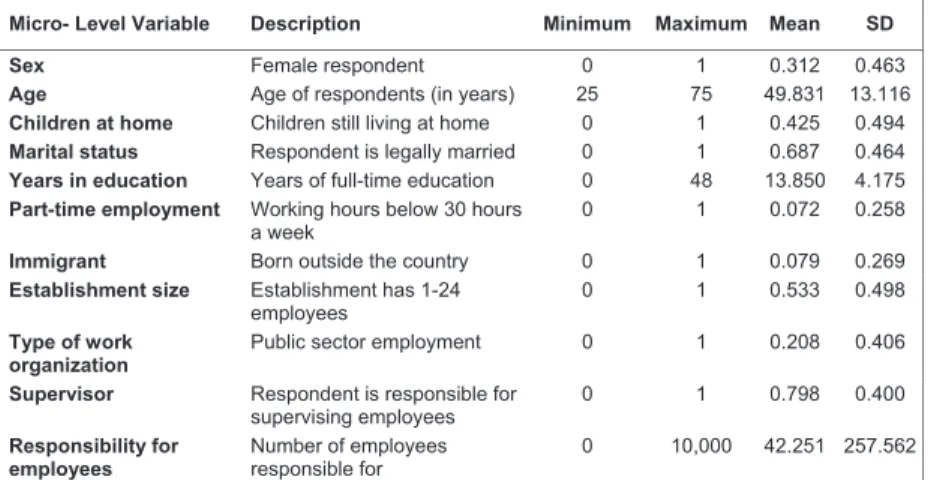
The explanatory variables included in the estimations represent individual and firm-specific (Xi) as well as country- specific (Zj) characteristics. Based on the theoretical arguments and findings from the literature, the following variables are used as indicators at the individual level. 18
Age (measured in years) as an indica- tor for the point in time of the life cycle is calculated for each wave of the survey.
To examine the possibility of a curvilinear relationship, we also include a quadratic variable for age in our models. Several studies have shown an association be- tween age and level of occupational sta- tus (see Holst et al. 2010 for Germany).
Increasing age suggests increasing expe- rience at company level; employees with a long company history are more often promoted. Therefore, we assume that old- er workers are more likely to be in high- status occupations than younger workers and that this holds true for both men and women.
Moreover, we include an indicator for immigrants, those born outside the coun- try of interest. 19 Despite affirmative action policies and laws to stop discrimination against minorities, migrants are more dis-
18 The Appendix (Table A1b) lists means and standard deviations for all (micro) individual-level independent variables for respondents in higher- status occupations.
19 Corresponding question: Were you born in [country]?
advantaged in the labor market (Zegers de Beijl 2002). Consequently, immigrants are less likely to be in high-status occupa- tions than other workers. This holds espe- cially true for female migrants who face a double burden.
To capture the extent of additional resources and possible pooling within the household, we include an indicator of whether the respondent is currently living in a legal partnership or not. 20 However, we do recognize that feminist research in- dicates that resources are not simply split equally in many households. But this indi- cator also suggests possible caretaking or further responsibilities within the house- hold. As the literature suggests, men in high status-occupations are more likely to be legally married, but this is not the case for women in high-status occupations.
Previous education and current re- sponsibilities are important for an indi- vidual’s human capital and labor market continuity. This would especially be the case for women who have increased their human capital by taking part in higher education or on-the-job training and with- draw from own children. Two indicators relating to this are available, even if the extent and form of the influence of these factors on women being in employment varies markedly between countries and are also based on demand-side indica-
20 Corresponding question: Could I ask about your current legal marital status? Which of the descrip- tions on this card applies to you? We generated three categories: married, now without a partner (separated, divorced or widowed), and never mar- ried. The last two are single but with different legal statuses.
tors 21: they show whether women are highly-educated 22 and whether they currently have a child at home. Thus, in general employees with a higher educa- tion are more likely to hold a high-status occupation, but women with children are less likely to hold such a high-status oc- cupation.
Due to data limitations, we are not able to include indicators on employment or training experience 23 but only on the volume of working hours, such as part- time employment (below 30 hours per week). Working hours impact substan- tially on the promotion of employees and their chances of being in a high-status occupation, but their quality and extent varies markedly between countries (see O’Reilly and Fagan 1998). In general, we hypothesize that part-time workers have a lower chance of being in a high-status occupation than those working full-time and this might well be true for both men and women.
Several studies also suggest substan- tial variation in the chance of employ- ees being promoted with the size of the company, with employees having better
21 The model of employed women and securing employment is also based on national variations in labour demand.
22 Corresponding question: How many years of full-time education have you completed? And for 2004-2008: About how many years of education have you completed, whether full-time or part- time? Please report these in full-time equivalents and include compulsory years of schooling.
23 An indicator on training experience may show how the individual is valued as an important resource within the company, as well as that the individual possesses company specific skills, which increases one’s human capital values.
opportunities in large than in small com- panies (Holst et al. 2009). Women can however expect to have a better chance of climbing the career ladder in smaller companies than in larger ones. Thus, we include the establishment size measured by the number of employees. 24
Since employment conditions vary substantially between the private and the public sector, we also differentiate between inividual public and private- sector employment. 25 Leuze and Rusconi (2009), for example, suggest substantial differences in integration, promotion and training of professionals in private and public companies in Germany.
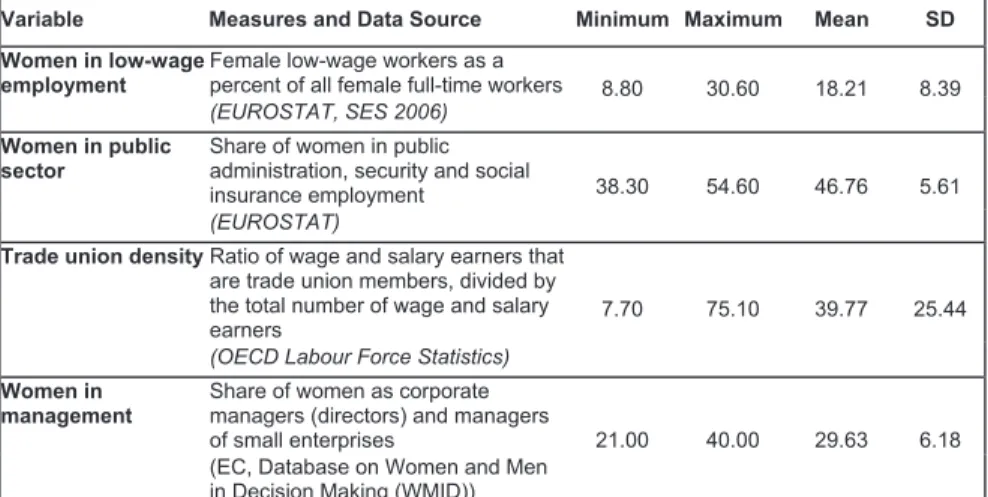
In order to comprehensively assess a variety of theoretically relevant macro- level gender influences, we collected data from a range of international sources dis- cussed below. Descriptive statistics for all macro-level independent variables are list- ed in the Appendix (Table A2a and A2b).
Data limitations nevertheless remain: har- monized macro-level gender measures available over time, which also represent theoretical concerns of interest, are ex- ceedingly difficult to obtain. Thus, the data we included in our sample are aimed at comprehensively addressing the theo-
24 Corresponding question: Including yourself, about how many people are/were employed at the place where you usually work/worked? We dif- ferentiate small firms (1-24 employees) from large firms (25 and more employees).
25 Private sector is defined by the type of organi- zation in which the respondent works (Which of the types of organisation on this card do/did you work for?) and the sector in which the respondent works (What does/did the firm/organization you work/
worked for mainly make or do?). Information on the type of organization is only available for 2008.
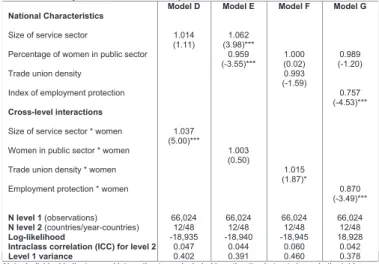
retical concern, given limitations in data availability. A structural characteristic of the national labor market that may influ- ence women’s improved access to higher occupations is considered using the per- centage of women in the public sector 26 and the service sector size (Eurostat). The level of regulatory protection and collec- tive coordination of working conditions is captured by an OECD synthetic indicator of the strictness of regulation on dismiss- als and the use of temporary contracts, ranging from 0 as least stringent to 6 as most restrictive. Collective coordination is measured by trade union density, which corresponds to the ratio of wage and sal- ary earners who are trade union members divided by the total number of wage and salary earners (OECD 2009). Correlations of national macro-level characteristics are listed in the Appendix (Table A3). The highest correlation is found for the share of women in the service sector and trade union density (0.674***).
Estimation Method
The dataset contains information at the individual level (level 1) for men and women and at the national level (level 2) for each country. The dependent variable
“high-status occupation” is measured at
26 To our knowledge, no data on the share of women in the whole public sector are available for all the countries included in the analysis. We could only include data on the percentage of women in public administration, security, and social insur- ance (Eurostat 2009). The share of employees in ‘public administration, security, and social insurance’ (NACE=L) in total service sector varies between eight percent in Switzerland and Finland to 14 percent in France in 2008.
the individual level and takes the value 1 for respondents who hold a high-status occupation and 0 otherwise. The inde- pendent variables reside at the individual and national level. Thus, we ran multilevel analyses to test our hypotheses. 27 This technique accounts for the fact that indi- viduals are clustered hierarchically within countries, which may cause underestima- tion of standard errors (Snijders and Bosk- er, 1999). 28 We use two levels of analy- sis: individuals are level-one units and country-year combinations are level-two units. Using ordinary regression would violate the assumption of independent error terms. People within one country share unobserved characteristics. Thus, we introduce a country-specific constant ui in the error term. For our models, the constant is modeled explicitly. Following the assumption that there is no covaria- tion between ui and any independent vari- ables, the estimation is unbiased and ef- ficient. Using this kind of model, we are able to differentiate between individual and country-specific variance.
We estimate logit models referring to
27 The second analysis is based on bivariat descriptives.
28 Given the hierarchical structure of the data, it is not possible to use Ordinary Least Square (OLS) regression analysis. Moreover, such a dataset vio- lates the assumption of independent explanatory variables because the national level variables are the same for all people within the same country.
The use of multilevel regression analysis allows in- vestigation of effects at different levels of analysis and at the same time. Multilevel models explain micro-level outcomes by showing that the param- eters at the micro level are a function of the macro level and that this relationship can be expressed in terms of the macro-level variables.
our binary dependent variable, whether respondents are working in high-status occupations. If i indicates the level-one unit (individual) and j the level-two unit (country-year), the random intercept model for our binary data is written as:
Logit (Yij) = a + bXij + c0Zj + c1XijZj + U0j + U1jXij + Eij
where Yij indicates a binary variable with 0=no high-status occupation and 1=
high-status occupation, Xij are the varia- bles at individual level (age, married) and Zj the variables at country level (service sector, women in public sector). The term c1XijZj in the fixed part is the interaction effect between the level-one variable X and the level-two variable Z. The regres- sion coefficient c1 expresses how much the national context variable (Z) modifies the effect of the individual achievement (X) on occupational position (Y). This ex- presses how national context affects rela- tions between individual-level variables (see DiPrete and Forristal, 1994).
in mind that not only the labor market participation rate of women but also the share of employees in high-status occupa- tion varies markedly between countries, the results might point to a quite diverse picture of the hierarchical occupational structure between countries. The Scan- dinavian countries of Norway, Sweden, Denmark and Finland as well as Switzer- land and the Netherlands have a labor force participation rate of women of over 73 percent, whereas the participation rate of women in other countries was lower in 2008. 30 Further, in some countries, such as the Scandinavian ones, the share of
30 See OECD (2009a: 254) and OECD statistics (http://stats.oecd.org/Index.
aspx?DataSetCode=GID accessed August 2011).
4. Underrepresentation of Women in High-Status Occupations and National Variation
Figure 1: Average Share of Women in High-Status Occupations and Confidence Interval across 12 European Countries for 2002-2008
Note: only employed respondents aged 25 to 75
Source: European Social Surveys (2002, 2004, 2006, 2008), weighted with design weights; authors' calculations
Looking at the representation of wom- en at the top of the job hierarchy, our re- sults confirm a continuous trend of high underrepresentation of women in top posi- tions in the private and public sector for all twelve countries. Figure 1 shows the mean share and confidence interval (grey) of women in high-status occupations over all four years with values ranging from the UK with the highest shares of women in high- status occupations to Germany with the lowest shares of women in top positions. 29
In the Netherlands and the Scandina- vian countries of Norway, Finland, Den- mark, and Sweden, a good share of wom- en hold a high-status occupation. Bearing 29 Those differences proved to be significantly different.
employees at the margins (high-status and low-status) might be small and in oth- ers it might be larger. The ratio of high- status and low-status employment varies extensively between countries as the sec- tion on polarization shows.
What is of interest here are the na- tional differences. We examine the ex- tent to which the variance of the share of women in high-status occupations can be attributed to the country level. Therefore, we will first show whether there is sub- stantial variation between countries for all respondents in high-status occupations (Table 2, model A). Second, the influence of individual characteristics is regressed on all respondents in high-status occu- pations, including interaction terms for women (Table 2, models B and C). Finally, national institutional characteristics and cross-level interaction terms will be add- ed to the model (Table 3, models D to G).
For each of our models, we report odds ratios (OR), statistical significance (p- value), absolute value of z, intraclass cor- relation (ICC), levels 1 variance, and the log-likelihood as an indicator of model fit.
After selection of missing values on the independent variables, the total sam- ple for estimation contains 66,024 obser- vations, of which 6,432 are respondents in high-status occupations, among which 2,004 observations are for women. 31
First, the empty model (Table 2, mod- el A) shows to what extent there is sig- nificant between-country variation in the
31 We lost about 12 percent of our observations for men and 14 percent of our observations for women on the dependent variable for the whole time period.
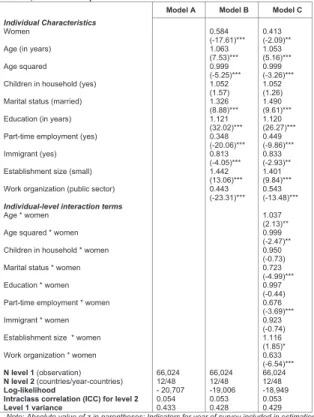
chance of being in a high-status occupa- tion for men and women, which confirms our results from Figure 1. According to model A, the intraclass correlation 32 at country level is 0.054 (median odds ratio is 1.511). This means that there is not only variation in high-status occupations be- tween individuals, but also between coun- tries, although at a low level; this justifies our comparative approach.
Since we are interested in gender dif- ferences in high-status occupations, we further estimated the effects of country clusters 33 as well as their interaction with gender (not shown in the table) without individual-level characteristics. In con- tinental coordinated market economies, such as Germany, Belgium, the Neth- erlands, and Switzerland, women seem to have lower chances of having a high- status occupation than in liberal market economies. Testing continental CMEs against all other countries confirms this result; women have significantly higher
32 The parameter estimated using the different variance component that can describe the relative importance of the two levels is the intraclass cor- relation coefficient (ICC). Normally, it is calculated as follows: rho = sigma_u / (sigma_u + sigma_e) and can be understood as the proportion of the total variance contributed by the country-level vari- ance component and is (analogously) equivalent to the intracluster correlation (ICC). It shows the between-country variance as a percentage of the total variance. However, the parameter is calculated using the ado ‘xtmrho’ which follows the procedure by Snijders and Bosker (1999) ICC
= are level variance / (sum of are level variances + (c(pi)^2)/3) (published by Lars E. Kroll).
33 Scandinavian CMEs: Norway, Finland, Den- mark, Sweden; LMEs: UK; mixed cases: Portugal, Spain, France; continental CMEs: Germany, Belgium, Netherlands, Switzerland (Chow-test for women - chi2 (4): 1061,53, p-value: 0.000).
Table 2: Individual-Level Determinants of Being in a High-Status Occupation across 12 European Countries for 2002-2008 (Multi-Level Random Intercept Model, Odds Ratios)
Model A Model B Model C
Individual Characteristics
Women 0.584 0.413
(-17.61)*** (-2.09)**
Age (in years) 1.063 1.053 (7.53)*** (5.16)***
Age squared 0.999 0.999
(-5.25)*** (-3.26)***
Children in household (yes) 1.052 1.052 (1.57) (1.26) Marital status (married) 1.326 1.490
(8.88)*** (9.61)***
Education (in years) 1.121 1.120 (32.02)*** (26.27)***
Part-time employment (yes) 0.348 0.449 (-20.06)*** (-9.86)***
Immigrant (yes) 0.813 0.833 (-4.05)*** (-2.93)**
Establishment size (small) 1.442 1.401 (13.06)*** (9.84)***
Work organization (public sector) 0.443 0.543 (-23.31)*** (-13.48)***
Individual-level interaction terms
Age * women 1.037
(2.13)**
Age squared * women 0.999
(-2.47)**
Children in household * women 0.950
(-0.73) Marital status * women 0.723
(-4.99)***
Education * women 0.997
(-0.44) Part-time employment * women 0.676
(-3.69)***
Immigrant * women 0.923
(-0.74) Establishment size * women 1.116
(1.85)*
Work organization * women 0.633
(-6.54)***
N level 1 (observation) 66,024 66,024 66,024
N level 2 (countries/year-countries) 12/48 12/48 12/48
Log-likelihood - 20,707 -19,006 -18,949
Intraclass correlation (ICC) for level 2 0.054 0.053 0.053
Level 1 variance 0.433 0.428 0.429
Note: Absolute value of z in parentheses; Indicators for year of survey included in estimation but not shown in table. Only employed respondents aged 25-75 without missing individual characteristics. * p < 0.10, ** p < 0.05, *** p < 0.01
Source: European Social Surveys (2002, 2004, 2006, 2008), authors' calculations.
chances of being in a high-status occupa- tion in LMEs such as the UK, in Scandina- vian CMEs such as Norway, Finland, Den- mark, and Sweden, and in mixed cases such as Portugal, Spain, and France.
In model B, the chance of being in a high-status occupation for men and wom- en was regressed on all individual-level characteristics. Comparison of models A and B shows that the ICC and both the country-level and individual-level vari- ances decrease slightly after the inclusion of individual characteristics. Apparently,
the individual-level characteristics in our model account for variation in higher oc- cupations between countries. 34 In other words, a share of the variance between countries can be explained by compo- sition effects, due to the fact that each country is composed of different types of individuals. Some of whom are more likely to experience promotion. In ac-
34 The highest correlation of independent individual variables is -0.347*** for children in household and age.