Miocene restriction of the Paci fi c-North Atlantic through fl ow strengthened Atlantic overturning circulation
Valeriia Kirillova
1, Anne H. Osborne
1, Tjördis Störling
1& Martin Frank
1Export of warm and salty waters from the Caribbean to the North Atlantic is an essential component of the Atlantic Meridional Overturning Circulation (AMOC). However, there was also an active AMOC during the Miocene, despite evidence for an open Central American Seaway (CAS) that would have allowed low-salinity Paci fi c waters to enter the Caribbean. To address this apparent contradiction and to constrain the timing of CAS closure we present the fi rst continuous Nd isotope record of intermediate waters in the Florida Strait over the past 12.5 million years. Our results indicate that there was no direct intermediate water mass export from the Caribbean to the Florida Strait between 11.5 and 9.5 Ma, at the same time as a strengthened AMOC. After 9 Ma a strong AMOC was maintained due to a major step in CAS closure and the consequent cessation of low-salinity Paci fi c waters entering the Caribbean.
https://doi.org/10.1038/s41467-019-12034-7
OPEN
1GEOMAR Helmholtz Centre for Ocean Research Kiel, Kiel, Germany. Correspondence and requests for materials should be addressed to A.H.O. (email:aosborne@geomar.de)
1234567890():,;
O f the 30 ± 1.5 Sverdrup (Sv, 1 × 10⁶m
3s
−1) of water transported via the Florida Current today, 13 Sv continue to flow northwards as the Gulf Stream
1, thus constituting a major contribution to the Atlantic Meridional Overturning Circulation (AMOC), which has a mean deep volume transport of 18 ± 2.5 Sv at 24°N
2. Most model experiments suggest that an open Central American Seaway (CAS) allowed low-salinity waters from the equatorial Pacific to enter the Atlantic at mid-latitudes resulting in an overall weaker AMOC (e.g.
3–6), and a possible link between CAS closure and changes in North Atlantic Deep Water production has been widely discussed (e.g.
7–10). The timing of CAS closure is thus of crucial importance but available recon- structions are controversial, with much of the controversy hin- ging on the definition of closure
11. On the basis of geochemical and geochronological data and paleomagnetic reconstructions, recent studies have argued that the CAS essentially disappeared completely as early as 15 Ma
12–14, although allowing that tran- sient and shallow seaways may have persisted until 10 Ma
14. This, however, contradicts biostratigraphic evidence for a gradual shoaling from 15 Ma onwards, with the seaway still 1000-m deep at 12 Ma
15. The appearance of a significant and permanent sur- face water salinity difference between the eastern equatorial Pacific and the Caribbean after ~4.7 to 4 Ma
16–20points towards a later CAS closure, although changes in sea-surface properties could alternatively be explained by a switch from predominantly El Niño-like to predominantly La Niña-like conditions
21,22. What constitutes ‘closure’ is also under debate where the fossil record is concerned. If shallow seaways with sufficiently high currents, similar to the Indonesian throughflow
23, were present in the Pliocene CAS, this may have prevented migration of species between North and South America
20 and could explain the divergence of marine molecular DNA on either side of the CAS after 3 Ma
20and the fossil evidence for the Great American Biotic Interchange
24from 2.6 Ma onwards
25. If the currents in the CAS were not strong, or if the seaways were transient, then this could
explain why a recent study combining fossil and molecular data found waves of terrestrial organism dispersal at ~20 and 6 Ma and divergence of Atlantic and Pacific marine organisms at ~23 and
~7 Ma
26.
In the light of the ambiguous evidence for the timing of CAS closure, it is pertinent to examine the progressive restriction of water mass exchange via the CAS in more detail and to compare these results with model predictions of the consequences of variations in Pacific water export to the Caribbean and the Atlantic. The radiogenic Nd isotope composition of past seawater has been used extensively to reconstruct changes in the mixing and provenance of water masses (cf. ref.
27). The longest record of the Gulf Stream ε
Ndevolution from 850 m water depth in the northwest Atlantic extends back to 8.5 Ma and shows a shift towards less radiogenic compositions between 8.5 and 5 Ma, which was interpreted as a reduction in the advection of intermediate-depth Pacific water to the western North Atlantic
28, a conclusion supported by model results
29. For deep waters, sedimentary ε
Ndrecords from the Caribbean extending back to 18 Ma show that the irreversible shift away from Pacific-like compositions already occurred earlier, at 10.7 Ma
10. However, in apparent contrast to most model predictions (ref.
5and references therein), episodes of increased Pacific through-flow in the Middle to Late Miocene Caribbean (between ~12.5 and 10 Ma) were shown to have coincided with increased AMOC strength
10.
In this contribution, we specifically compare the evolution of the export of intermediate-depth Pacific waters to the western North Atlantic to records of AMOC strength
30–32. We present a continuous new 12.5 Myr seawater ε
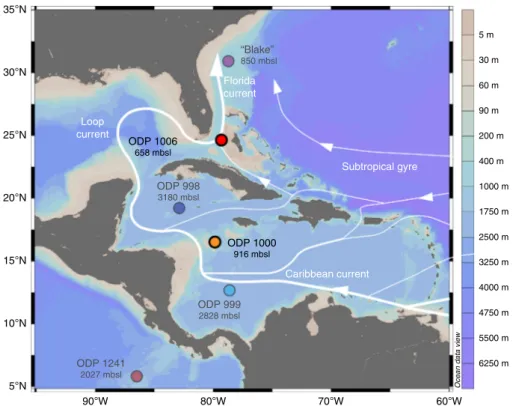
Ndrecord obtained from sedimentary foraminifera coatings of Ocean Drilling Program (ODP) Site 1006 (658 m water depth) located on the leeward slope of the Great Bahama Bank (GBB) (Fig. 1), which together with Site 1000 in the central Caribbean (916 m water depth) for the first time constrains the timing of CAS closure to intermediate-depth Pacific waters and also allows reconstruction
ODP 999 2828 mbsl
90°W 80°W 70°W 60°W
5°N 10°N 15°N 20°N 25°N 30°N 35°N
Ocean data view
6250 m 5500 m 4750 m 4000 m 3250 m 2500 m 1750 m 1000 m 400 m 200 m 90 m 60 m 30 m 5 m
ODP 1241 2027 mbsl
ODP 1000 916 mbsl
“Blake”
850 mbsl Florida current Loop
current
Caribbean current Subtropical gyre ODP 1006
658 mbsl
ODP 998 3180 mbsl
Fig. 1Study area and sample sites. Locations and water depths of Ocean Drilling Program (ODP) Sites from which the new data were obtained (1000 and 1006) and of other sites referred to in this study (ODP 998, 999 and 1241, Blake crust). The main ocean currents affecting the sites are shown in white35,36,61. Map produced using Ocean Data View62
of the origin of western North Atlantic (Gulf Stream) waters during the Miocene–Pliocene.
Results
Seawater and detrital Nd-isotope signatures. Comparison of surface sediment and water samples from the vicinity of ODP Site 1006 confirms that uncleaned planktonic foraminifera reliably recorded the local bottom water ε
Ndsignal
33(Supplementary Figs. 1 and 2). The oldest part of the new seawater record of Site 1006 reveals highly radiogenic ε
Nd(t)values of up to −4.6 prior to 11.5 Ma dropping sharply to −8.1 at 10.8 Ma (Fig. 2). Seawater ε
Nd(t)values then became slightly more radiogenic again between 9.5 and 8 Ma (−6.6 to 7.3 ε
Nd(t)) before decreasing to −8.8 ε
Nd(t)by 6.8 Ma. Thereafter, the ε
Ndsignatures at Site 1006 fluctuated between −8.4 and −6.2 until 3.1 Ma to finally become less radiogenic, approaching core-top values of ~−9 to −10 from 0.85 Ma onwards. The ε
Nd(t)signature of the detrital fraction at Site 1006, with the exception of a single sample at 7.5 Ma, varied between −5.6 and −8.5 from 12.5 to 4 Ma and became less radiogenic thereafter (−8.6 to −10.7 ε
Nd(t)) (Supplementary Fig. 3).
New Miocene data were also produced to extend the existing foraminiferal and detrital ε
Nd(t)records of Site 1000
34and now allow direct comparison of the long-term changes at the two intermediate-depth sites (Fig. 2, Supplementary Fig. 3). The early part of the Site 1000 seawater record is significantly more radiogenic than that of ODP 1006 with ε
Nd(t)values reaching
−2.6 to −3.1 between 13.6 and 12.1 Ma (Fig. 2). This is followed by an ε
Nd(t)decrease to −7.8 between 12.1 Ma and 8.4 Ma and a slight increase to −6.6 between 7.3 and 6.8 Ma. Unlike the Site 1006 record, the detrital fraction of Site 1000 sediments shows a distinct step-change from ε
Nd(t)values between −2.2 and −7.6
prior to 9.4 Ma to between −8.3 and −10.5 after 8.4 Ma (Supplementary Fig. 3).
Discussion
Prior to 12.1 Ma, seawater ε
Nd(t)at Sites 1006 and 1000, as well as at deep Caribbean Sites 998 and 999
10, was within a range from
−4.6 to −2, reflecting a strong Pacific throughflow into the western North Atlantic (Fig. 2). Pacific waters could have been transported to Site 1006 either via the Florida Strait or, as shown in model simulations
6, through entrainment in the Atlantic gyre, or a combination of both. Some contribution of radiogenic Nd derived from partial dissolution of volcanic ashes may be expected in this tectonically highly active region but a previous study
10found no correlation between ε
Ndsignatures and volcanic ash mass accumulation rates at Caribbean Sites 999 and 998. An overall less radiogenic seawater ε
Nd(t)signal at Site 1006 com- pared to Sites 998, 999 and 1000 is consistent with decreasing ε
Ndsignatures with increasing distance from the CAS, given that the Pacific signal was continuously mixed with Atlantic waters with a less radiogenic ε
Ndsignature
28,35,36. Likewise, any particulate material from the Pacific transported across the CAS would more likely have been deposited in the vicinity of Site 1000 than at Site 1006, which explains why the detrital fraction at Site 1000 was on average ~2.5 ε
Ndunits more radiogenic than at Site 1006 prior to 9 Ma (Supplementary Fig. 3). Partial dissolution of volcanic particles along the path of the recirculated gyre waters or a marked change in the Southern Atlantic end-member composi- tion would be further possible sources of radiogenic Nd, but there is no evidence to support this (see Supplementary Discussion).
After 12.1 Ma, seawater ε
Nd(t)at Caribbean Site 1000 became progressively less radiogenic by more than 3 ε
Ndunits to reach
−7.8 by 8.4 Ma. This decrease is similar to the overall trend at two deep Caribbean Sites, which together with increasing sediment accumulation rates was attributed to a decrease in the inflow of more radiogenic and corrosive Pacific waters entering the basin via the closing CAS
10. Our new data show that the composition of the intermediate-depth Caribbean was strongly impacted by CAS closure in the Late Miocene, as reflected by a marked drop to less radiogenic detrital ε
Ndsignatures after 9 Ma. The ε
Nd(t)and
87Sr
/86
Sr signatures of the detrital material (Fig. 3) suggest that the main source of the material delivered to Site 1000 between 14 and 9 Ma was the Mexican volcanic belt. After 9 Ma, the supply of
Nd(t)
Age (Ma) –13
–11 –9 –7 –5 –3 –1 1
0 2 4 6 8 10 12 14
Site1006 Site1000 Site 999 Site 998 Blake crust
Restricted Pacific- western N. Atlantic throughflow Change in Caribbean
detrital composition
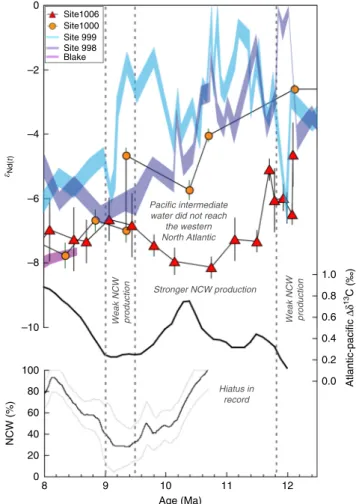
Fig. 2Seawater Nd isotope records. SeawaterεNdrecords (εNd=[(143Nd/
144Nd(sample)/(143Nd/144Nd(CHUR)−1] × 104, whereby CHUR stands for the Chondritic Uniform Reservoir (143Nd/144Nd=0.512638)63of Ocean Drilling Program (ODP) Site 1006 (uncleaned foraminifera, this study), Site 1000 (uncleaned foraminifera, this study and ref.34), Sites 998 and 999 (fish teeth and uncleaned foraminifera10,34, and of ferromanganese crust Blake (BM 1963.897))28. Samples have been corrected toεNd(t)to take into account the ingrowth of143Nd. All previously published data of the Blake crust and ODP Sites 998 and 999 are presented as thick lines that include the 2σexternal reproducibility of the analyses. For clarity, the error bars for the new data are excluded in thisfigure, but are shown in Supplementary Fig. 3. The Blake record only starts at 8.5 Ma. The vertical lines indicate the periods of time when Caribbean and Florida Strait seawaterεNdsignatures diverged between 11.5 and 9.5 Ma and converged again between 9.5 and 9 Ma. The detrital composition at ODP Site 1000 changed after 9 Ma (Supplementary Fig. 3)
–15 –10 –5 0 5 10 15 20
0.700 0.705 0.710 0.715 0.720
Lesser Antilles Mexican volcanic belt Andean
arc
87Sr/86Sr Nd(t)
Orinoco sediments ODP 1006, 9–13 Ma ODP 1000, 9–14 Ma
ODP 999, 2–5 Ma ODP 1241, 2–5 Ma ODP 1000, 2–9 Ma ODP 1006, 0–9 Ma
Central American
volcanic arc
Fig. 3Detrital fraction Nd and Sr isotope compositions. Comparison of Nd and Sr isotope compositions of the detrital fraction of Ocean Drilling Program Sites 1006, 1000, 999 and eastern equatorial Pacific Site 1241 (this study and ref.34) and potential sources (data obtained via the GEOROC databasehttp://georoc.mpch-mainz.gwdg.de/georoc/)
Orinoco sediments played the most important role, despite evi- dence that uplift and mountain building in the Northern Andes from ~12 Ma actually re-routed the drainage system in northern South America away from the Caribbean and towards the tropical Atlantic
37. The shift in detrital material composition at Site 1000 therefore indicates a major change in the overall Caribbean subsurface circulation pattern.
We find that an initial decrease in seawater ε
Ndat Site 1006 occurred earlier than at the Caribbean Sites and reached −8.1 at 10.8 Ma. This marked divergence from the Site 1000 record suggests that there was a change in the regional hydrography between ~11.5 and 9.5 Ma and that Atlantic waters with a less radiogenic Nd isotope composition dominated the signal at Site 1006. Continuous sedimentation of the Santaren Drift since 12.4 Ma
38argues against tectonic uplift of a sill in close vicinity of Site 1006 being responsible for the divergence between the Car- ibbean and Florida Strait signals. The disconnection was more likely caused by a hydrographic barrier caused by the dominance of the circum-tropical current between the Pacific and Caribbean over the intra-Caribbean current connecting the Northern and Southern Caribbean, as was suggested on the basis of nannofossil assemblages
39. Whatever the exact cause of the disconnection was, the evidence from the seawater ε
Ndrecords clearly shows that there was no significant export of radiogenic intermediate- depth Pacific waters to the western North Atlantic during this time interval.
The convergence of the Caribbean and Florida Strait ε
Ndrecords between 9.5 and 8 Ma documents the full hydrographic reconnection of the two intermediate-depth Sites (Fig. 2). ODP Site 1000 is located in the Pedro Channel, which crosses the Northern Nicaraguan Rise
40. According to tectonic reconstruc- tions
41, the Nicaraguan Rise was fully accessible for northward flow only after 9 Ma, which likely explains the convergence of all seawater ε
Ndrecords between 9.5 and 8 Ma. Moreover, the essentially identical ε
Ndcompositions of a Blake Ridge record
28support an unrestricted export of Caribbean water into the wes- tern North Atlantic during this time interval (Fig. 2).
Between 8 and 6.8 Ma, the Florida Strait record again diverges somewhat from the Caribbean records (Fig. 2), which may also have been a result of a hydrographic barrier. However, during this period, the deep Caribbean seawater ε
Ndcomposition remained constant
10, and the detrital composition of Site 1000 had already shifted towards that of Orinoco sediments, suggesting that the influence of Pacific intermediate waters was at most minor and any observed changes originated from the Atlantic. On the basis of nannofossil assemblages, it was proposed that the north and south Caribbean basins were separated between 8.35 and 3.65 Ma
39, but the seawater ε
Ndrecords do not support this inter- pretation given that Sites 998 and 1000 were similar to the south Caribbean Site 999 record for the majority of this time interval
10,34.
The vast majority of modelling simulations find that an enhanced supply of low salinity Pacific waters to the North Atlantic reduces the production of Northern Component Water (NCW, pre-cursor of North Atlantic Deep Water (NADW)) and hence the strength of the AMOC (ref.
5and references therein).
However, Newkirk and Martin
10found apparently contradicting evidence that the interval of high Pacific water throughflow into the deep Caribbean between ca. 12.4 and 9.5 Ma corresponded to an increase in the production of NCW, as estimated from δ
13C gradients between the Atlantic and the Pacific
31. Lear et al.
32also found evidence for a proto-NADW between 12.5 and 10.5 Ma on the basis of cooler benthic Mg/Ca temperatures and higher δ
13C signatures. Our new record from Site 1006 now shows that this interval of high NCW production
30–32(Fig. 4) occurred at a time when there was little or no export of intermediate waters from the
Pacific to the western North Atlantic and thus, importantly, the low-salinity Pacific waters present in the Caribbean at that time
10could not be transferred to the high northern latitudes of the Atlantic (Fig. 5). Following the same reasoning, lower NCW production between 9.5 and 9 Ma may be attributed to the re- establishment of the Pacific-North Atlantic connection, either directly via the Florida Strait or indirectly via the Atlantic gyre (Figs. 4 and 5). These findings support model predictions that changes in the supply of Pacific waters to the North Atlantic affected the AMOC and highlights the importance of inter- mediate water mass exchange.
According to the results of an ε
Nd-enabled ocean–atmosphere general circulation model, the Atlantic became the dominant source of intermediate-depth Caribbean waters once the CAS had shoaled to between 500 and 200 m
6. Our new records constrain the timing of this significant change away from a Pacific supply to
~9 Ma, therefore providing support to studies that found a major step in CAS closure during the Late Miocene
12–14. However, the new data do not support a complete closure of the CAS by
Age (Ma)
NCW (%) Weak NCW production
–10 –8 –6 –4 –2 0
0.0 0.2 0.4 0.6 0.8 1.0
0 20 40 60 80 100
8 9 10 11 12
Atlantic-pacific Δδ13C (‰) Site1006
Site1000 Site 999 Site 998 Blake
Stronger NCW production Pacific intermediate water did not reach
the western North Atlantic
Weak NCW production
Hiatus in record Nd(t)
Fig. 4Comparison of seawater Nd isotope records with estimates of Northern Component Water production. SeawaterεNd(t)signatures of Caribbean and Western Atlantic sites (this study10,34) together with two different estimates of Northern Component Water (NCW) production based onδ13C gradients between the Atlantic and the Pacific (upper black curve, ref.32; lower three curves showing NCW production (thin black curve) and ±1 sigma uncertainty (thin grey lines), with a hiatus and unreliable estimates before 10.7 Ma omitted, ref.30) for the period between 12.5 and 8 Ma. Vertical dashed lines show episodes of weak NCW production when theεNd(t)records indicate strong Pacific-western North Atlantic throughflow
10 Ma
14and instead allow for a shallow seaway or seaways until at least 9 Ma and possibly much later.
Methods
Regional setting. ODP Site 1000 is today bathed by diluted Antarctic Intermediate Water (AAIW)42that can be traced by its salinity minimum as far as 20°N in the North Atlantic43. ODP Site 1006 is located in the Santaren Channel and receives a mixture of waters from the Caribbean and recirculated gyre waters44,45(Fig.1).
AAIW today largely preserves its AtlanticεNdsignature of−10.6 to−11 during transit across the Caribbean42. Consequently, intermediate-depth waters close to Site 1000 in the Central Caribbean have anεNdvalue of ~−10, whereas Site 1006 in
the Florida Strait shows anεNdvalue of−9 (ref.42) as a result of admixture of waters from the western North Atlantic subtropical gyre46,47. Similar Nd isotope compositions in the Florida Strait33and the Atlantic gyre47preclude any calcu- lation of the exact contributions from each source at Site 1006 but lowflow speeds in the deep Santaren Channel45would allow for mixing between the two. On the Pacific side of the Isthmus of Panama, theεNdsignatures of intermediate-depth eastern equatorial Pacific water masses are much more radiogenic (−4 to−1.6)48.
Age models. The age models for Site 1006 and for the Miocene part of Site 1000 are based on published biostratigraphy49,50.
Sample preparation. Sediment samples from ODP Sites 1000A and 1006A were obtained from the IODP Core Repository in Bremen. A further seven core-top samples from the GBB area were obtained from the Seafloor Samples Laboratory of the Woods Hole Oceanographic Institution (Supplementary Fig. 2). All samples were freeze-dried and weighed and an aliquot of 2.5 g of each sample was separated and ground using an agate pestle and mortar. The remaining sample aliquot was wet sieved, oven dried and separated into size fractions ready for microscope work.
Approximately 35 mg of mixed planktonic foraminifera were picked (mostly Globigerinoides ruber and Neogloboquadrina dutertrei) from the >350-μm size fraction for the extraction of the bottom water Nd isotope composition from the ferromanganese coatings of the uncleaned foraminifera51. The shells were crushed between two glass plates to open the chambers, and were then ultrasonicated with alternate rinses of distilled (MQ) water and ethanol to remove any detrital particles.
Afinal visual check for removal of particles was performed under the microscope before dissolution of the foraminifera samples in 0.5 M HNO3.
To extract the detrital fraction, the 2.5 g powdered aliquots were leached following the procedures fully described in refs.52,53. Samples were rinsed with distilled (MQ) water, followed by a decarbonation procedure using an acetic acid/
sodium acetate buffer (with a pH around 4). A hydroxylamine hydrochloride solution was used as a leaching agent for removing the Fe–Mn oxyhydroxide fraction, and was buffered with acetic acid/sodium hydroxide to reach the pH value of 4. This initial leach solution was removed and an additional 12 h of leaching with newly added leaching solution was carried out to completely remove any authigenic coatings. After a triple rinse with MQ water and oven drying, an aliquot of 0.05 g of the remaining detrital fraction underwent total dissolution via hotplate digestion using a mixture of HNO3, HF and HCl. Hydrogen peroxide and HClO4
were included in the procedure for the removal of organic material.
Further separation of Nd and Sr and purification of the sample solutions was carried out ion chromatographically. All samples were put through cation exchange columns (AG50W-X12 resin, mesh 200–400 µm)54to collect rare earth elements (REEs) and, in the case of the detrital samples, the Sr cut also was collected.
Thereafter, Nd was separated from the other REEs (Ln Spec resin columns, mesh 50–100 µm)55and Sr was separated from Rb and other interfering elements (Sr spec resin column, mesh 50–100 µm)56.
Nd and Sr isotope analysis. Isotope ratios were measured on a Nu Instruments Multiple Collector Inductively Coupled Plasma Mass Spectrometer (MC-ICPMS) at GEOMAR. The143Nd/144Nd results were mass bias corrected to a146Nd/144Nd ratio of 0.7219 and normalized to the accepted JNdi-1 standard143Nd/144Nd value of 0.512115 (ref.57). For downcore samples,εNd(t)values were calculated by cor- recting the measuredεNd(0)for ingrowth of143Nd using an Sm/Nd ratio of 0.139 for uncleaned foraminiferal calcite58and 0.109 for detrital material, based on the average upper crustal ratio59. The external reproducibility (2σ) was between 0.21 and 0.40εNdunits for the detrital samples. The external reproducibility (2σ) for the measurements of the foraminifera samples was higher (0.98εNdunits) due to smaller sample sizes that required a time resolved measurement method.
After correction for Kr and Rb interferences, Sr results were mass bias corrected to an86Sr/88Sr ratio of 0.1194 and normalized to the widely accepted87Sr/86Sr value of 0.710245 for the NIST SRM987 standard. The87Sr/86Sr results were corrected for ingrowth of87Sr using an87Rb/87Sr ratio of bulk earth of 0.09 (ref.60). The external reproducibility (2σ) was between 0.000019 and 0.000022.
a
b
c
Before 12 Ma and 9.5–9 Ma
~11.5–9.5 Ma
After 9 Ma
Pacific waters reach western North Atlantic
“Barrier” prevents Pacific waters reaching western North Atlantic
Atlantic waters dominant in caribbean and western North Atlantic ODP 1006
ODP 1006
ODP 1006
ODP 1000 ODP 1000 ODP 1000
Fig. 5Schematic representation of different circulation patterns as the Central American Seaway shoaled.aIntermediate-depth water from the Pacific reaches the western North Atlantic, either directly via the Florida Strait, or indirectly via entrainment in the Atlantic gyre. Site 1000 (orange circle) and Site 1006 (red circle) both have radiogenicεNdsignatures.
bA barrier (dashed grey line), either physical or hydrographical, prevents Pacific intermediate waters from reaching the western North Atlantic. Site 1000 has a more radiogenic signal than Site 1006.cThe Central American Seaway has shoaled sufficiently so that the Atlantic is the dominant source of intermediate waters to the Caribbean. The detrital signal at Site 1000 changes towards that of the Orinoco after 9 Ma
Total procedural blanks for Nd chemistry were≤360 pg and for Sr chemistry were≤4600 pg. In both cases, these blanks were below 1% of the total sample size and therefore considered insignificant.
Data availability
Data generated during this study are available in the PANGAEA database (https://doi.
org/10.1594/PANGAEA.904251).
Received: 18 December 2018 Accepted: 19 August 2019
References
1. Schmitz, W. J. & McCartney, M. S. On the North-Atlantic circulation.Rev.
Geophys.31, 29–49 (1993).
2. Lumpkin, R. & Speer, K. Global ocean meridional overturning.J. Phys.
Oceanogr.37, 2550–2562 (2007).
3. Mikolajewicz, U., Maierreimer, E., Crowley, T. J. & Kim, K. Y. Effect of Drake and Panamanian Gateways on the circulation of an ocean model.
Paleoceanography8, 409–426 (1993).
4. Schneider, B. & Schmittner, A. Simulating the impact of the Panamanian seaway closure on ocean circulation, marine productivity and nutrient cycling.
Earth Planet. Sci. Lett.246, 367–380 (2006).
5. Zhang, X. et al. Changes in equatorial Pacific thermocline depth in response to Panamanian seaway closure: insights from a multi-model study.Earth Planet.
Sci. Lett.317, 76–84 (2012).
6. Sepulchre, P. et al. Consequences of shoaling of the Central American Seaway determined from modelling Nd isotopes.Paleoceanography29, 176–189 (2014).
7. Haug, G. H. & Tiedemann, R. Effect of the formation of the Isthmus of Panama on Atlantic Ocean thermohaline circulation.Nature393, 673–676 (1998).
8. Frank, M., Reynolds, B. C. & O’Nions, R. K. Nd and Pb isotopes in Atlantic and Pacific water masses before and after closure of the Panama gateway.
Geology27, 1147–1150 (1999).
9. von Blanckenburg, F. & Nagler, T. F. Weathering versus circulation-controlled changes in radiogenic isotope tracer composition of the Labrador Sea and North Atlantic Deep Water.Paleoceanography16, 424–434 (2001).
10. Newkirk, D. R. & Martin, E. E. Circulation through the Central American Seaway during the Miocene carbonate crash.Geology37, 87–90 (2009).
11. Jaramillo, C. et al. Comment (1) on“Formation of the Isthmus of Panama”by O’Dea et al.Sci. Adv.3, e1602321 (2017).
12. Montes, C. et al. Evidence for middle Eocene and younger land emergence in central Panama: Implications for Isthmus closure.Geol. Soc. Am. Bull.124, 780–799 (2012).
13. Montes, C. et al. Arc-continent collision and orocline formation: closing of the Central American seaway.J. Geophys. Res. Solid Earth117, B04105 (2012).
14. Montes, C. et al. Middle Miocene closure of the Central American Seaway.
Science348, 226–229 (2015).
15. Duque-Caro, H. Neogene Stratigraphy, Paleoceanography and
Paleobiogeography in Northwest South-America and the Evolution of the Panama Seaway.Palaeogeogr. Palaeoclimatol. Palaeoecol.77, 203–234 (1990).
16. Keigwin, L. Isotopic Paleo-Oceanography of the Caribbean and East Pacific - role of Panama Uplift in Late Neogene time.Science217, 350–352 (1982).
17. Haug, G. H., Tiedemann, R., Zahn, R. & Ravelo, A. C. Role of Panama uplift on oceanic freshwater balance.Geology29, 207–210 (2001).
18. Steph, S. et al. Changes in Caribbean surface hydrography during the Pliocene shoaling of the Central American Seaway.Paleoceanography21, PA4221 (2006).
19. Groeneveld, J. et al. Foraminiferal Mg/Ca increase in the Caribbean during the pliocene: Western Atlantic Warm Pool formation, salinity influence, or diagenetic overprint?Geochem. Geophys. Geosyst.9, Q01P23 (2008).
20. O’Dea, A. et al. Formation of the Isthmus of Panama.Sci. Adv.2, e1600883 (2016).
21. Mestas-Nunez, A. M. & Molnar, P. A mechanism for freshening the Caribbean Sea in pre-Ice Age time.Paleoceanography29, 508–517 (2014).
22. Molnar, P. Comment (2) on“Formation of the Isthmus of Panama”by O’Dea et al.Sci. Adv.3, e1602320 (2017).
23. Sprintall, J., Wijffels, S. E., Molcard, R. & Jaya, I. Direct estimates of the Indonesian Throughflow entering the Indian Ocean: 2004-2006.J. Geophys.
Res. Oceans114, C07001 (2009).
24. Stehli, F. G. & Webb, S. D.The Great American Biotic Interchange. Topics in Geobiology. (Plenum Press, New York and London, 1985).
25. Woodburne, M. O. The Great American Biotic Interchange: dispersals, tectonics, climate, sea level and holding pens.J. Mamm. Evol.17, 245–264 (2010).
26. Bacon, C. D. et al. Biological evidence supports an early and complex emergence of the Isthmus of Panama.Proc. Natl Acad. Sci. USA112, 6110–6115 (2015).
27. Frank, M. Radiogenic isotopes: tracers of past ocean circulation and erosional input.Rev. Geophys.40(1), 1001 (2002).
28. Reynolds, B. C., Frank, M. & O’Nions, R. K. Nd- and Pb-isotope time series from Atlantic ferromanganese crusts: implications for changes in provenance and paleocirculation over the last 8 Myr.Earth Planet. Sci. Lett.173, 381–396 (1999).
29. Pfister, P. L., Stocker, T. F., Rempfer, J. & Ritz, S. P. Influence of the Central American Seaway and Drake Passage on ocean circulation and neodymium isotopes: a model study.Paleoceanography29, 1214–1237 (2014).
30. Poore, H. R., Samworth, R., White, N. J., Jones, S. M. & McCave, I. N.
Neogene overflow of Northern Component Water at the Greenland-Scotland Ridge.Geochem. Geophys. Geosyst.7, Q06010 (2006).
31. Wright, J. D. & Miller, K. G. Control of North Atlantic deep water circulation by the Greenland-Scotland ridge.Paleoceanography11, 157–170 (1996).
32. Lear, C. H., Rosenthal, Y. & Wright, J. D. The closing of a seaway: ocean water masses and global climate change.Earth Planet. Sci. Lett.210, 425–436 (2003).
33. Osborne, A. H., Haley, B., Hathorne, E. C., Flögel, S. & Frank, M. Neodymium isotopes and concentrations in Caribbean seawater: tracing water mass mixing and continental unput in a semi-enclosed ocean basin.Earth Planet. Sci. Lett.
406, 174–186 (2014).
34. Osborne, A. H. et al. The seawater neodymium and lead isotope record of the final stages of Central American Seaway closure.Paleoceanography29, 715–729 (2014).
35. Burton, K. W., Ling, H. F. & Onions, R. K. Closure of the Central American Isthmus and its effect on deep-water formation in the North Atlantic.Nature 386, 382–385 (1997).
36. O’Nions, R. K., Frank, M., von Blanckenburg, F. & Ling, H. F. Secular variation of Nd and Pb isotopes in ferromanganese crusts from the Atlantic, Indian and Pacific Oceans.Earth Planet. Sci. Lett.155, 15–28 (1998).
37. Hoorn, C. et al. Amazonia through time: Andean uplift, climate change, landscape evolution, and biodiversity.Science330, 927–931 (2010).
38. Anselmetti, F. S., Eberli, G. P. & Ding, Z. D. From the Great Bahama Bank into the Straits of Florida: a margin architecture controlled by sea-level fluctuations and ocean currents.Geol. Soc. Am. Bull.112, 829–844 (2000).
39. Kameo, K. & Sato, T. Biogeography of Neogene calcareous nannofossils in the Caribbean and the eastern equatorial Pacific -floral response to the emergence of the Isthmus of Panama.Mar. Micropaleontol.39, 201–218 (2000).
40. Mutti, M., Droxler, A. W. & Cunningham, A. D. Evolution of the Northern Nicaragua Rise during the Oligocene-Miocene: Drowning by environmental factors.Sediment. Geol.175, 237–258 (2005).
41. Droxler, A. W. et al. Caribbean constraints on circulation between Atlantic and Pacific Oceans over the past 40 million years. inTectonic Boundary Conditions For Climate Reconstructions(eds Crowley, T. J. & Burke, K. C.) (Oxford University Press, New York 1998).
42. Wüst, G.Stratification and Circulation in the Antillean-Caribbean Basins, Part 1, Spreading and Mixing of the Water Types with an Oceanographic Atlas.
(Columbia University Press, New York 1964).
43. Worthington, L. V.On the North Atlantic Circulation(John Hopkins University Press, Baltimore 1976).
44. Cherubin, L. M. High-resolution simulation of the circulation in the Bahamas and Turks and Caicos Archipelagos.Prog. Oceanogr.127, 21–46 (2014).
45. Leaman, K. D. et al. Transport, potential vorticity, and current temperature structure across Northwest Providence and Santaren Channels and the Florida Current off Cay-Sal Bank.J. Geophys. Res. Oceans100, 8561–8569 (1995).
46. Piepgras, D. J. & Wasserburg, G. J. Rare-earth element transport in the Western North-Atlantic inferred from Nd isotopic observations.Geochim.
Cosmochim. Acta51, 1257–1271 (1987).
47. Lambelet, M. et al. Neodymium isotopic composition and concentration in the western North Atlantic Ocean: results from the GEOTRACES GA02 section.
Geochim. Cosmochim. Acta177, 1–29 (2016).
48. Grasse, P., Stichel, T., Stumpf, R., Stramma, L. & Frank, M. The distribution of neodymium isotopes and concentrations in the Eastern Equatorial Pacific:
water mass advection versus particle exchange.Earth Planet. Sci. Lett.353, 198–207 (2012).
49. Kameo, K. & Bralower, T. J. Neogene calcareous nannofossil biostratigraphy of Sites 998, 999, and 1000, Caribbean Sea.Proc. ODP Sci. Results165, 3–17 (2000).
50. Kroon, D. et al. Coupled Early Pliocene-Middle Miocene bio-cyclostratigrahy of Site 1006 reveals orbitally induced cyclicity patterns of Great Bahama Bank carbonate production.Proc. ODP Sci. Results166, 155–166 (2000).
51. Roberts, N. L., Piotrowski, A. M., McManus, J. F. & Keigwin, L. D.
Synchronous deglacial overturning and water mass source changes.Science 327, 75–78 (2010).
52. Gutjahr, M. et al. Reliable extraction of a deepwater trace metal isotope signal from Fe-Mn oxyhydroxide coatings of marine sediments.Chem. Geol.242, 351–370 (2007).
53. Stumpf, R., Frank, M., Schonfeld, J. & Haley, B. A. Late Quaternary variability of Mediterranean Outflow Water from radiogenic Nd and Pb isotopes.Quat.
Sci. Rev.29, 2462–2472 (2010).
54. Barrat, J. A. et al. Determination of rare earth elements in sixteen silicate reference samples by ICP-MS after Tm addition and ion exchange separation.
Geostand. Newsl.20, 133–139 (1996).
55. Le Fevre, B. & Pin, C. A straightforward separation scheme for concomitant Lu-Hf and Sm-Nd isotope ratio and isotope dilution analysis.Anal. Chim.
Acta543, 209–221 (2005).
56. Horwitz, E. P., Chiarizia, R. & Dietz, M. L. A novel strontium-selective extraction chromatographic resin.Solvent Extr. Ion Exch.10, 313–336 (1992).
57. Tanaka, T. et al. JNdi-1: a neodymium isotopic reference in consistency with LaJolla neodymium.Chem. Geol.168, 279–281 (2000).
58. Osborne, A. H. et al. The potential of sedimentary foraminiferal rare earth element patterns to trace water masses in the past.Geochem. Geophys. Geosyst.
18, 1550–1568 (2017).
59. Taylor, S. R. & McLennan, S. M.The Continental Crust: Its Composition and Evolution(Blackwell Scientific Publications, Oxford, 1985).
60. Goldstein, S. L. & Hemming, S. R. Long-lived isotopic tracers in oceanography, paleoceanography, and ice-sheet dynamics. inTreatise on Geochemistry: The Oceans and Marine Geochemistry(eds Holland, H. D., Turekian, K. K. & Elderfield, H.) 453–489 (Elsevier, 2003).
61. Jouanno, J. et al. The mesoscale variability in the Caribbean Sea. Part I:
simulations and characteristics with an embedded model.Ocean Model.23, 82–101 (2008).
62. Schlitzer, R.Ocean Data Viewhttp://odv.awi.de/(2018).
63. Jacobsen, S. B. & Wasserburg, G. J. Sm-Nd isotopic evolution of chondrites.
Earth Planet. Sci. Lett.50, 139–155 (1980).
Acknowledgements
This work was funded through the M.Sc. Program for Polar and Marine Science POMOR/ Bundesministerium für Bildung und Forschung (BMBF) (V.K.) and German Science Foundation (DFG) project OS 499/2-1 (A.H.O.). Sample material used in the project was provided by the Ocean Drilling Program (ODP) and the Seafloor Samples Laboratory of the Woods Hole Oceanographic Institution. ODP is sponsored
by the U.S. National Science Foundation (NSF) and participating countries under management of Joint Oceanographic Institutions (JOI), Inc. We thank R. Samworth and N. Poore for providing additional data for Northern Component Water calculations.
Author contributions
A.H.O. and M.F. developed the project. V.K., A.H.O. and T.S. performed the isotope analyses. All authors contributed to the writing of the manuscript.
Additional information
Supplementary Informationaccompanies this paper athttps://doi.org/10.1038/s41467- 019-12034-7.
Competing interests:The authors declare no competing interests.
Reprints and permissioninformation is available online athttp://npg.nature.com/
reprintsandpermissions/.
Peer review information:Nature Communicationsthanks Chris Brierley, Howie Scher and other anonymous reviewer(s) for their contribution to the peer review of this work.
Peer reviewer reports are available.
Publisher’s note:Springer Nature remains neutral with regard to jurisdictional claims in published maps and institutional affiliations.
Open Access This article is licensed under a Creative Commons Attribution 4.0 International License, which permits use, sharing, adaptation, distribution and reproduction in any medium or format, as long as you give appropriate credit to the original author(s) and the source, provide a link to the Creative Commons license, and indicate if changes were made. The images or other third party material in this article are included in the article’s Creative Commons license, unless indicated otherwise in a credit line to the material. If material is not included in the article’s Creative Commons license and your intended use is not permitted by statutory regulation or exceeds the permitted use, you will need to obtain permission directly from the copyright holder. To view a copy of this license, visithttp://creativecommons.org/
licenses/by/4.0/.
© The Author(s) 2019