Analysis of agricultural value chains between South Africa and Germany:
Case studies of table grape, wine and rooibos
Final Report
July 2015
Acknowledgement
This study has been commissioned by Oxfam Germany in 2014.
It has been produced thanks to the help of experts and partners in Europe and South Africa who supported with information, materials, data and guidance.
The content of this study does not reflect the official opinion of Oxfam Germany.
Responsibility for the information and views expressed in this study lies entirely with the author(s).
Executive Summary
The German food market, the largest in Europe, has been heavily influenced and structured by retailers, and more particularly discounters, over the past decades. These have created very large price sensitive and low margin markets which have been further strengthened since the beginning of the economic crisis in 2008.
In the Southern hemisphere, South Africa has been a fast growing supplier of food products since the end of the international trade sanctions against apartheid in the 1990s which has enabled the country to re-open its export market and revive its agricultural sector.
However, this was accompanied by a strong deregulation of agricultural markets in South Africa which coincided with a growing development of trade in bulk and commoditisation in world food markets which triggered ever increasing pressures on prices and the restructuration of global value chains by large retailers and importers.
The key value chains between South Africa and Germany studied in this report – table grape, wine and rooibos tea – show the significant impacts these dynamics have had on supply chain disintegration and restructuring, and their ultimate negative impacts on farmers, workers and the environment in South Africa.
If these impacts can’t be attributable to German buyers only, the strong pressure on price generated over the past decade by the German retailers, especially discounters (and to a lesser extent by German importers) have fuelled and strengthened these consequences.
Reversely, the existing dynamics at stake in the South African agricultural sector (deregulation, industrialisation of agricultural production, concentration of market power, abuse of workers’
rights and discrimination, etc.) have enabled and encouraged the low price demand of German large retailers and importers.
This creates a mutually-reinforcing negative spiral which requires strong initiatives to be taken in order to create meaningful transformations in South African farmers’ and workers’ lives and truly sustainable agricultural production in the country.
Acronyms
CIRAD International Research Centre on Agriculture for Development
EC European Commission
EU European Union
FAO Food and Agriculture Organisation FOB Free on Board (incoterms)
ILO International Labour Organization ISO International Standard Organisation
IUF International Union of Food, Agricultural, Hotel, Restaurant, Catering, Tobacco and Allied Workers’ Associations
RSA Republic of South Africa
UNCTAD United Nations Conference for Trade and Development UNDP United Nations Development Program
UNEP United Nations Environment Program
UNIDO United Nations Industrial Development Organization USDA United States Department of Agriculture
Table of contents
Acknowledgement 2
Executive Summary 3
1. Methodology 6
2. The German food retail market 8
3. Table Grapes Case Study 13
a) The German fresh fruits market 13
b) Characteristics and evolution of the table grape market in Germany 15
c) Table grape value chains between South Africa and Germany 19
d) Situation and evolution of the table grape industry in South Africa 25
4. Wine Case Study 31
a) Characteristics and evolution of the German wine market 31
b) Wine value chains between South Africa and Germany 38
c) Situation and evolution of the wine industry in South Africa 46
5. Rooibos Case Study 52
a) Characteristics and evolution of the rooibos tea market in Germany 52
b) Rooibos tea value chains between South Africa and Germany 55
c) Situation and evolution of the rooibos industry in South Africa 58
6. Impact on farmers and workers in South Africa 61
a) The very difficult land reform and transition to farm co-ownership 61 b) The situation of rural workers in South Africa, and its evolution 63 c) Working and living conditions of farm workers in the grape and wine sectors 65
d) Degradation of the environment 70
e) Responsibility of German value chains regarding social and environmental impacts in South
Africa 71
7. Alternatives to conventional trade and their impact on the ground 72
a) Regulatory codes and certification schemes 72
b) Focus on the impact of Fairtrade certification 74
1. Methodology
Perimeter and approach
The objective of this study is to bring together different strands of evidence (both qualitative and quantitative) to analyse the global value chains of key South African products sold in Germany, their evolution since 2000, and the potential impacts on farmers and workers.
The main areas of research were:
- The pricing trends in the German market since 2000 - The value chains between Germany and South Africa
- The impacts of German value chains on farmers and workers in South Africa Incoterms: prices and costs along the chain
Prices and costs along the value chains have been respectively tracked and estimated for the following incoterms stages:
Limitations
The world market being increasingly globalised, buyers can more easily shift between origins and between suppliers while keeping consistent quality products, and exporters can more easily distribute their sales and risks between clients and consumer countries.
In this context, the German market only accounts for 6% to 7% of the world commodity trade, and the links between pricing trends in Germany and the incomes of farmers and workers are indirect.
However, long-term trends in global value chains can be identified and related to localised impacts on farmers and workers in exporting countries.
In order to analyse these global value chains, the main limitation addressed in this study is the reliability of price and cost data along the chains. To reduce uncertainties as much as possible:
- prices have been tracked from retail up to the import and export stage,
- costs have been estimated from the production stage down to the import stage.
The reliability and transparency of data has been considered too low beyond these boundaries, preventing from analysing prices and costs all along the chain.
EXW (Ex-Works) Seller makes the goods available for the buyer to transport it to the
port of origin (= farmgate stage + sorting, washing & packing)
FOB (Free On Board) Seller is responsible for delivery of the goods loaded on board the ship (risk is transferred as soon as the goods are inside the ship)
CIF (Cost Insurance and Freight) Seller covers cost of freight, duty unpaid, to the port of destination
FOT (Free On Truck) Seller delivers the goods, duty paid, unloaded inside the terminal of the port of destination
Customs Customs
Unit Value of exported products
In order to address the lack of transparency on prices and costs along the chain, the concept of ‘unit value of products exported’ was used in this study to investigate the transmission of price pressure down the chain on farmers and workers.
The unit value of products exported from South Africa and imported in Germany have been estimated based on Comtrade data.
The main reason for this approach is the greater reliability of data on flows of specific products in the UN Comtrade database compared to the other sources of information publically available, including Eurostat.
Import prices
Unit prices of import have been calculated for each country dividing the import value by the import volumes both recorded by the UN Comtrade database (used by the World Trade Organisation).
The FAO database has not been used for calculating import prices because it doesn’t take into account re-exports among European countries (unlike the Eurostat and UN Comtrade databases).
Retail prices
Retail prices of products in consumer countries have been sourced from Eurostat and the German National Office of Statistics (DEStatis).
It is one of the key components of the Consumer Price Index and the Retail Price Index, both calculated weekly by this Office (prices are recorded weekly for a typical selection of products - referred to as the ‘basket of goods’ - using a large sample of shops and other outlets. Each week, price collectors record about 200 prices for each good of the basket).
Nominal prices and real prices
Real prices have been calculated by adjusting for inflation the nominal prices at the different stages of the chain (export, import and retail). Inflation rates are based on the Consumer Price Index (CPI) in each country; they have been sourced from:
- Eurostat for Germany, the UK, Italy, Greece, the EU (27) and the Euro-zone
- ECLA/CEPAL (Economic Commission for Latin America) for Latin American countries - The South African statistics Institute
Volume units
Volumes are expressed and measured either in tonnes, kilogrammes, litres or standardized boxes of 4.5kg for table grape (the unit for transactions between fruit companies and their retail customers).
2. The German food retail market
Germany is by far the biggest market for food and beverages in the European Union. According to Euromonitor International, grocery retailing reached sales of 186.8 billion Euros in 20121.
Over the past ten years, Germany is one of the very few European countries where households have continuously increased their household expenditure spent on food, a tendency which accelerated since the economic crisis in 2008 (see below).
Compound annual growth (% CGAR) in the share of final consumption expenditure of households of food and non-alcoholic beverages
Source: Eurostat data (2004-12) analysed in ‘The economic impact of modern retail on choice and innovation in the EU food sector’, European Commission, September 2014
In comparison with other major European retail food markets, Germans are very price-sensitive consumers who also expect high quality products. Food prices on the German market are quite low for a country that has high average income, while the increasing consumer demand for healthier and more premium products has driven growth in the German grocery sector over recent years2. As a result, the key characteristics of the German market are: consolidation, market saturation, strong competition and low prices3.
In this context, discounters have been a prominent feature of the German retail market for the past 30 years.
1Euromonitor International, Retailing in Germany, 2013
2Euromonitor International, 2013, op. cit.
3USDA Foreign Agricultural Services, The German Food Retail Market, 2012
Sales in Grocery Retailing by Category, billions of Euro
Source: BASIC, based on EHI data (1980-2000) and Euromonitor International data (2010-12)
As shown in the diagram above, the discounters’ market share rose from 12% in the 1980s to 33% and above since the early 2000s.
Their success was strongly driven by the development of private label food products focused on (low) price. While 20 years ago their offer was limited to important staples and a small range of other produce, today discounters have a wide portfolio of private label ranges which extend to virtually all consumer product areas.4
As a result, discounters have acquired a leading influence in the German food retail market, as shown by the breakdown of grocery retail value per distribution channel:
Grocery Retail Value by Channel 2012 (US$ billion 2013 prices) and expected Annual Growth Rate (2012-2017) Source: Euromonitor International
Nevertheless, after years of growth, this share is somehow stagnating, in particular because of the limited ability of discounters to open new stores. 5
In 2012, there is one discounter for every 5,231 people in the country, within a 10-15 minute drive of every German home6. The country has the highest share of discounters in world’s food retailing.
4Euromonitor International, Overview of the Fresh Fruit, Vegetable and Floral Industries: Germany, April 2014
5Planet Retail, European Grocery Retailing, May 2014
6Euromonitor International, Fresh Food in Germany, 2012
Because of the competition with discounters, traditional retail chains have strongly developed their private labels, creating whole ranges of products from low-priced to high quality premium products (in 2011, the market share of private label products was above 40%)7.
More globally, leading German retailers have also positioned themselves on all major distribution channel types: supermarkets, hypermarkets, and especially discounter stores (see below - Aldi being a specific case focused on discounter outlet only).
Retailer Name Outlet Type Food Sales
(€Mil/2012)
No. of Outlets
Edeka-Group Edeka (Supermarkets) Netto (Discounter)
32 710 11 738
7 717 4 160
Rewe-Group Rewe (Supermarkets)
Penny (Discounter)
16 643 6 701
2 820 2 266
Metro-Group Real (Hypermarkets) Metro (Cash & Carry)
6 703 4 315
331 123
Schwarz-Group Lidl (Discounter)
Kaufland (Hypermarkets)
13 284 10 800
3 375 625
Aldi-Group Aldi Süd (Discounter) Aldi Nord (Discounter)
11 829 9 102
1 810 2 515
Lekkerland Lekkerland (Wholesaler) 8 182 19
Tengelmann-Group Kaisers (Supermarkets) 2 052 710
Profiles of Leading German Retail Companies Source: USDA based on Euromonitor and Lebensmittelzeitung
The success of this strategy is demonstrated by the growing influence of German discounter stores and banners beyond the boundaries of the country over the past 20 years, their rate of expansion being strongest outside Germany.
7USDA Foreign Agricultural Services, 2012, op. cit.
Top 10 Discount Store Operators in Europe by Total Sales, 2007-2017 (forecast) Source: Planet Retail, European Grocery Retailing, May 2014
As shown in the diagram above, this trend is true for the two leaders, Lidl and Aldi, but also for the other German discounters (Netto and Penny).
In 2012, the international operations of Aldi represented 43% of its total turnover, and Lidl generated almost 60% of its turnover outside Germany8. The combined number of shoppers of Aldi and Lidl in the six main European retail markets outnumbers the cumulated shoppers of all other retailers across these countries9.
Germany, like many other markets in Europe, is also characterized by a growing concentration in the food retail sector;
Concentration ratio of the 5 biggest retail groups measured in terms of edible grocery market sales share 2004-12 Source: ‘The economic impact of modern retail on choice and innovation in the EU food sector’, European
Commission, September 2014
8 European Commission, The economic impact of modern retail on choice and innovation in the EU food sector, September 2014
9Nielsen, the Hard Discounter Report - An Overview of Aldi and Lidl in Europe, 2007
As described in the study published by the European Commission in September 2014 (see diagram above), the situation in Germany is quite similar to the rest of Europe where the retail market is also dominated by 4 to 6 major retailers, but the situation is more pronounced there; to illustrate, in 2012, the sales of the top 5 German retailers amounted to:
- 61% of the consumer spending on food, drink & tobacco (compared to 51% in 2004) - 90% of the edible grocery sales of all modern retail groups (compared to 77% in 2004) 10
In this context, the German Bundeskartellamt published in September 2014 an inquiry into buyer power in the food retail sector. This study showed that decisive action from public authorities is needed to prevent a further worsening of the competitive conditions in the sector.
It is based on a 3-years econometric analysis which demonstrated that “the large retail groups who make up 85% of the German market have a huge lead over their small and medium-sized competitors and can make use of their structural advantages in negotiations with manufacturers, even the large ones with well-known brands, who are exposed to the retailers' bargaining power”.11
The latest concentration move happened in October 2014 when Edeka announced its intention to acquire Tengelmann’s supermarket chain with around 16,000 employees and more than 700 supermarkets. The acquisition is intended to be completed by the end of summer 2015.12
KEY FINDINGS
- Germany is the biggest food and beverages market in Europe and still in gradual expansion
- Discounters strongly influence the German food market in terms of increasing competition, low and decreasing prices and private label penetration; their influence is now expanding in many other European countries.
- Germany is one of the most concentrated food retail markets in Europe: in 2012, the sales of the top 5 retailers amounted to 61% of the consumer spending on food, drink & tobacco and to 90% of the edible grocery sales of all modern retail groups in Germany.
10 European Commission, The economic impact of modern retail on choice and innovation in the EU food sector, September 2014
11 Bundeskartellamt, Gliederung der Sektoruntersuchung Lebensmitteleinzelhandel, September 2014
12 http://www.lexology.com/library/detail.aspx?g=79bfec5b-6852-4523-98c9-01d1f864d4e7
3. Table Grapes Case Study
a) The German fresh fruits market
Germany consumes more fruit than any other country within the European Union. Like many other European countries, the German fruit consumption per household is in a slight decline: it reached 81.5 kg per household per year in 2010, which is slightly below other EU countries.
Main fruits consumed in Germany by volume Source: USDA GAIN Report GM7041, 2010
As illustrated in the graph above, the main fruits consumed in Germany (including imports and domestically grown) are apples (22%), bananas (13%) and oranges (9%), followed by mandarins (5%) and grapes (4%).
In terms of supply, Germany is the 6th largest European fruit producer and the biggest European importer of fresh fruits and vegetables with annual volumes reaching 5.5 million tons of fresh produce. Apple is the only fruit consumed in big volumes that is produced in majority in the country. 13
A growing trend across all food retail outlets in Germany is the increase in the varieties of fruits available year-round rather than just in their traditional growing season14.
13Euromonitor International, Fresh Food in Germany, 2012, op. cit.
14Ibid.
Percent of Fresh Fruit Purchases by Retail Outlet in Germany Source: USDA, based on Fruchthandel Directory 2013
German consumers mostly buy fresh fruits in modern retail chains, almost 90%. Most notably, the discounters have reached a 54% market share in the fresh fruit sector in 2013 (compared to only 38% in 2008), which makes them the leading actors of the market (see diagram above).
Share of fresh produce sales in Germany by retailer group (2012) Source: BASIC, based on Euromonitor 2014
In terms of retail groups, the market of fresh produce is dominated by the top 5 retailers which, together, accounted for 67% of all fresh products purchased by German consumers in 2012 (compared to 61% of global food purchases for the same year) 15.
15Ibid. No estimations were found on the share of the top 5 German retailers in fresh product sales in modern retail outlets only (more globally, they amount to 90% of total edible grocery sales of modern retail groups)
b) Characteristics and evolution of the table grape market in Germany
German market for table grapes: the second largest in EuropeAlthough grapes have been historically cultivated in many regions throughout Germany, they are almost exclusively grown for wine production and it is only a few decades since German consumers have begun to regularly consume table grapes. Today, the German market for table grapes is the second largest in Europe after Italy.
German consumers preferably purchase big grapes (bunches over 400 grams) but the overall cosmetic appeal is the most important feature and grapes should have no visual defect16. White and seedless varieties both represent 70% of table grapes consumed in the country17. Generally speaking, table grapes are less and less bought in bulk and packed grapes are the favoured format.
Table grape is one of the most closely monitored food products regarding sanitary and safety issues. In particular, the EU regulations set strict Maximum Residue Limits (MRLs) for pesticide residuals in this product.
In order to maintain constant quality and to address these food safety issues, retailer groups, who are the biggest distribution channel for fresh fruits in Germany, impose strict safety and certification requirements to all importers and distributors who, in turn, impose it on table grape producers18:
- In terms of pesticides, German retail chains require that table grapes have residues much lower than the legally permitted MRLs, sometimes as low as 30% of the EU norms, as they are extremely concerned regarding the safety of the product they sell to consumers.
When retail chains find MRLs’ exceeding the EU permitted norms they stop buying immediately and the commercial relationship is lost. If they find MRLs lower than the EU permitted level but higher than their own standards, they impose a penalty on the supplier and exclude him from their list for periods up to several months.
- In terms of quality requirements, German retailers oblige their providers of fresh grapes to be Global GAP certified and require their private label suppliers to have BRC (British Retail Consortium) certification or equivalent. Suppliers shipping pre-packed products in small packaging must also comply with the ‘Green Dot’ system requirements and pay fees for packaging recycling.
In terms of prices to consumers, according to a survey conducted by USAID in 2012, the ranges are quite regular all throughout the year, even though table grape is imported from very different supplying countries depending on the season of the year.
The differences in table grapes retail prices appear to be predominantly linked to distribution channels and store formats (and to the type of grapes, seedless varieties being more expensive) and much less to seasonality and origins:
16 USAID, EMS Fresh and dried fruits in Germany, Agricultural Competitiveness and Enterprise Development project (ACED) May 2012
17Ibid.
18USDA, Product Brief Fresh Fruits, September 2014
- The survey conducted by USAID in 2012 found that the most common price for consumers found in supermarkets was 2.99 Euro/kg for pre-packed grapes in paper bags or plastic carry bags (the highest price within the supermarket being 3.99 Euro/kg for pre-packed grapes in 500 gram plastic punnets).
Additional price surveys conducted for this research in January and March 2015 indicated that prices could be higher for overseas origins, South African grapes reaching 3.8 Euro/kg on average.
- In comparison, in discounters’ stores, the observed average price for grapes could be as low as 1.99 Euro/kg on promotions19. Looking again at the case of South African grapes, the surveys conducted in January and March 2015 indicated prices of 2.99 Euro/kg.
- The prices in green markets (e.g. Viktualienmarkt in Munich) studied by USAID varied from 9.90 Euro/kg to 11.90 Euro/kg for the same varieties of grapes that were found in the supermarkets. These high prices do not, however, reflect the general market prices.20 - The price of organic table grapes in Germany is almost twice as high as the average price
for standard grapes. In 2012, when the average wholesale prices for most varieties of grapes reached 2.45€/kg, the census conducted by USAID found that the wholesale price for organic grapes was as high as 4€/kg21. This segment only accounts for 5% of the market and remains relatively stable22. The supply is mostly covered by Italian producers.
The trends of quality standardisation, regularity of supply, stable and affordable consumer prices all year round illustrate the dynamics of commoditisation of table grape over the past decade.
Table grape has indeed been progressively considered as a “bulk commodity” in order to make it available to consumers all year round in German supermarkets : it is now treated like an
“undifferentiated product” (like wheat, soy, coffee, cocoa or sugar) and characterized by price- sensitivity, anonymity and standardisation; dominant buyers can buy them quickly and at low cost using arms-length supply chains, and can substitute or mix them thanks to the universal grading system widely used in the sector23.
This results in an annual table grape supply cycle in Germany, which is as follows: the first winter supplier is Peru, followed by Brazil, Chile Argentina and South African arrivals. In early spring, grapes’ shipments start to arrive from India, Israel, Egypt and Morocco. Finally, the first European grapes arrive in June from Spain, followed by Italy and Greece.
The related breakdown of table grape suppliers by season is detailed in the diagrams below24:
19USAID, EMS Fresh and dried fruits in Germany, ACED project, May 2012 op. cit.
20Ibid.
21 Ibid.
22 Ibid.
23Food Inc., Corporate concentration from farm to consumer, 2005
24Comtrade data retrieved in March 2015 - Comtrade data indicate that global shares of table grapes origins imported in Germany have been quite stable over the past decade
Volume shares of fresh grapes supply countries in Germany in 2013, by season (high and low) Source: BASIC based on Comtrade data
European countries are the main providers of fresh grapes in Germany from June through November which is the high production season. Italy dominates table grape imports during this period, with a total market share of 62% in 2013 (see above). Other key EU suppliers are Greece and Spain with respective market shares of 17% and 14%.
From January to May, the low-season for the Northern hemisphere, Germany mainly imports table grapes from overseas. South Africa and Chile are the two most important suppliers of table grape, accounting for 45% of imported volumes during this period. Other suppliers are Brazil, Argentina, Egypt and Turkey.25
The commoditisation of table grapes is further reflected in the evolution of import prices in Germany and export prices in the main export countries.
Average monthly price per country of import in 2011 and MEP fluctuation for table grapes in Germany, euro/kg Source: USAID, based on Eurostat
The range of import prices of table grapes in Germany (see diagram above) appears to be quite stable all year round:
25USAID, EMS Fresh and dried fruits in Germany, ACED project, May 2012 op. cit.
- During the high season fruit production in Europe, grapes are imported by German importers/wholesalers at an average price of 1.4 Euros/kg26.
- During the Northern Hemisphere winter period, importers/wholesalers import table grapes from South Africa, Chile and Argentina at roughly 1.7 Euros/kg on average.
In order to protect European fresh fruit producers, the European Union applies a minimum entry price (MEP) for table grapes when the “season is open” in Europe.
However, in the case of table grapes, the MEP is equal to 0.546 Euros/Kg, which is far below the average prices of fresh grapes imported in Germany, regardless of origin27. Therefore, it doesn’t represent a trade barrier for overseas grapes during any part of the year.
In terms of export prices, during the high season, Italian shippers manage to propose lower prices than most other suppliers: they are 20% cheaper than Spanish or Greek suppliers. They work with open pricing contracts which enable them to realign the issued invoice with the actual market price. Thus, in summer time, the European table grapes market is uninteresting for overseas countries.
Moreover, there has been a gradual convergence of the export prices of fresh grapes over the past decade between exporting countries of the Northern and Southern hemispheres.
Unit Prices of fresh grapes exported by the main world suppliers Source: BASIC based on Comtrade data
As shown in the diagram above, export unit prices are now as low as 1.25 Euro/Kg on average in South Africa and Italy (the biggest European exporter) while they amount to 1.55 Euros/Kg in Greece and Chile (the biggest world exporter).
South Africa appears to be moving towards being one of the low-cost providers of fresh grapes to Germany. Given that the average export price in South Africa is getting as low as in Italy, and
26 USAID, EMS Fresh and dried fruits in Germany, ACED project, May 2012 op. cit.
27A product is said to be trading on the framework of an Asymmetric Trade Agreement when exported to EU and 0% of import duty is applied. In order to benefit from this, the price of imported goods needs to be equal to or higher than the stipulated price for that specific period of the year. If the price is lower it is automatically adjusted to the minimum entry price (MEP) by applying a corresponding import duty. (USAID ACED, 2012)
given the higher costs of transport involved to export, the price pressure is likely to be the strongest there, and related social and environmental impacts are quite likely to be the highest.
Hence, the following sections of this study focus on table grape value chains between South Africa and Germany to investigate these trends and their consequences.
c) Table grape value chains between South Africa and Germany
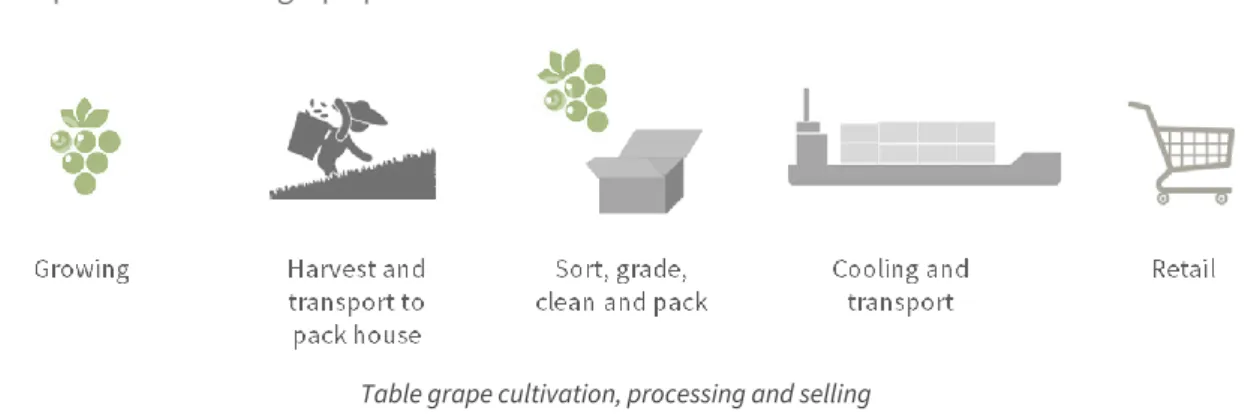
The process of table grape productionTable grape cultivation, processing and selling Source: BASIC
The global process of table grape cultivation, processing and selling can be described as follows28: - Grapes cultivation typically require a hot, dry climate with warm days, cool nights and low
humidity. The season must be long enough to allow both the fruit and the vine plant to mature. Grapes require water for production, the plant being little tolerant to water stress.
- Grapes are harvested when fully ripe, as they do not ripen after harvest. They should be picked only after they reach the optimum stage of acceptability in appearance, flavour and texture. Grapes can be kept for several weeks either by remaining on the vine after maturity, or when they are picked and stored in a very cool, dry, well-ventilated place.
Table grapes demand a significant level of manual labour, technical knowledge and experience for harvest, in particular because of the high quality requirements of retailers.
- Sorting of grapes is mainly done by workers, but can also be electronically managed (although expensive). The harvested bunches are graded according to the size of their berries and to their colours. The decayed, undersized, broken and discoloured berries are removed before grapes are packed. Grapes that are sent to foreign markets are packed in five-ply corrugated boxes, 500 × 300 mm in size to accommodate 5 kg of grapes.
- Cooling is the most critical phase of the postharvest. It reduces the rate of fruit respiration, retards the development of decay and most importantly minimizes water loss.
Grapes are cooled in forced-air rooms (at -1°C) and fumigated with sulphur dioxide (SO2) to reduce fungal decay. The cool chain is maintained all throughout the export, sea freight (or more rarely air freight), import and distribution phases until it reaches the end consumer.
28Republic of South Africa, Department of Agriculture, Forestry and Fisheries, Grapes production guidelines, 2012
The 3 main value chain patterns of South African table grapes imported in Germany29 Case # 1: retailer-importer driven chains
The majority of fresh grapes, almost 90%, is bought and consumed through retail chains (hypermarkets, supermarkets and discounters) which are mostly supplied by large importers and much more rarely source directly from abroad. Their typical margin is in the range of 15% to 25%.
Large importer Retailer Fruit Combine
Producer Retailer
Production Washing/ Packing Export Import Retail
Retail Import
Production Washing/ Packing Export
Large producer Large importer Retailer
Retail Import
Export Organisation Producer
Production Washing/ Packing Export
Main patterns of retailer-importer driven table grapes chains into Germany Source: BASIC
Generally, German retailers prefer buying from importers/wholesalers specialized in fresh fruits (see the above diagram). The main large importers involved in the grapes value chain are Atlanta Gruppe, Cobana Fruchtring, Dole and OGL Food Trade Lebensmittelvertrieb30.
Importers buy and sell their own capacity, assuming the full risks (unless on consignment). They are also responsible for clearing the produce through customs, packaging and assuring label/quality compliance of the produce. Their typical margins lie between 5% and 10%.31
The importers can be32:
- either part of “fruit combines” which are multinational companies that mutualize import and export operations on a worldwide basis to achieve economies of scale;
- or independent companies which buy table grapes from export organisations, or, more rarely, directly from large grape producers.
Export organisations are cooperatives or private organizations who collectively sell the grapes of individual producers. They organise the washing, sorting and packaging of the produce as well as labelling, bar-coding, etc.33
Most of the time, export organizations enter into collective agreements with freight forwarders in order to negotiate better prices and services (more regular transport, lower peak season prices).34
29USAID, EMS Fresh and dried fruits in Germany, ACED project, May 2012 op. cit.
30MAICh, Research for Strategic Plan and Development for the promotion of Greek Table Grapes, 2012
31Republic of South Africa, A profile of the South African Table Grape market value chain, 2012 op. cit.
32Republic of South Africa, Department of Agriculture, Forestry and Fisheries, A profile of the South African Table Grape market value chain, 2012
33Ibid.
34Ibid.
The transport of South African table grape has benefited from the unprecedented growth in the container liner sector over the past decade: The global container shipping industry has strongly expanded at the expense of traditional reefer operators. Containerisation has provided greater control over quality for larger producer/exporters, enabled smaller producers to access cool chains, and allowed supermarkets to centralise their sourcing and introduce direct procurement.35
Following the entrance of newly-established, low-cost Asian shipping lines, intense competition has been taking place and shipping actors have developed larger vessels and containers which can be transhipped from one mode of transport to another. As a result, international shipping is getting more and more concentrated through mergers and acquisitions and is moving away from the traditional port-to-port services towards door-to-door solutions36.
Case # 2: retailer driven chain
In this context, some German retailers have chosen to start buying directly fresh grapes from export organisations, but much more rarely than through importers37.
Retailer
Retail Import
Export Organisation Producer
Production Washing/ Packing Export
Main patterns of retailer-driven table grapes chains into Germany Source: BASIC
Large German supermarket chains such as Edeka, Aldi and Lidl, have their own import companies that handle imports of fresh fruit.
Export organizations seem to be the only actors to have long term contracts directly with retailers, but with the increasing importance of standards (Global Gap, etc.) and availability of the fruit, the planning of long term contractual relationship is expected to increase in the coming years.38
Agents are sometimes also contracted to establish contacts between export organizations and retailer. In such cases, they usually take between 2% and 3% commission.39
Case # 3: Non-retail chains
Wholesalers Other channels Retail Import
Wholesalers Other channels Retail Import
Production Washing/ Packing Export
Large producer Export Organisation Producer
Production Washing/ Packing Export
Main patterns of non-retail table grapes chains into Germany Source: BASIC
35 Barrientos S. and Visser M.,South African horticulture: opportunities and challenges for economic and social upgrading in value chains, September 2012
36 Confederation of South African Workers Union (CONSAWU), A Study on the Power Relations in the Fruit Supply Chain, October 2012
37USDA, Product Brief Fresh Fruits, 2014 op. cit.
38Ibid.
39Ibid.
The last value chain pattern ends up in green markets, individual shops, Hotels Restaurants and Catering (HoReCa). These are mostly supplied by average size wholesalers situated in 18 wholesale markets throughout Germany. These wholesalers are mostly supplied by export organisations and large producers in South Africa.
This channel appears to be in gradual decline as individual shops which are their main clients are under strong competition with the larger retailers.
Value breakdown of South African table grapes imported in Germany
Looking at the value breakdown along the table grape chain between Germany and South Africa, the strong influence achieved by importers and retailers – especially discounters – has translated into significant evolutions over the past 10 to 15 years, in particular for producers.
German Fresh Grapes Value Chain
Source: BASIC, based on DEStatis, Eurostat and Comtrade data
As shown in the above graphs, official statistics monitored by DEStatis and Comtrade show that:
- the average consumer price of fresh grapes has been slightly increasing since 2000 in real terms, even in discounters’ chains which are roughly 20% cheaper on average40,
- the CIF price of importers has also increased in line with the consumer price,
- in contrast, the FOB price earned by South African exporters has been significantly decreasing by more than 40% in real terms.
Further investigations show that this downward trend of grapes export price in South Africa, and the contrast with the evolution of the import price in Germany, is specific to these two countries.
40 note that the nominal consumer price of South African grapes in discounter and supermarket shops is often higher than the average price indicated in the diagram as they are mainly sold in winter during the off-season
FOB export prices to Germany of main world exporters of fresh grapes Source: BASIC, based on Comtrade data
As detailed in the above diagram, the Comtrade data shows that South Africa is one of the only suppliers which underwent a price decrease of exported grapes in real terms over the past decade in comparison with the other major origins supplying the German market.
While the main other suppliers of fresh grapes have witnessed a relative stability of their export unit prices, South Africa has seen a significant decrease and reached the lowest export price among major fresh grapes exporters.
This downward trend can be explained by a combination of factors:
- The decline of the Rand against the Euro over the past decade, which went from 0.11 euros for one rand in 2001 down to 0.08 euros for one rand in 2013
- The constant commercial pressures of European supermarkets, who use their dominant position to extract favourable terms on price and to pass risks on to their suppliers, especially through practices such as over-procurement and complaints over quality of South African grapes41. This trend has even developed further because of the economic recession42.
- The expansion of larger scale farms in South Africa which manage to achieve bigger economies of scale and take more advantage of production factors (land, water, workers…).
In conjunction with the commercial pressure of buyers and the increase of production costs, many smaller growers have gone out of business, their farms being taken over by larger growers. The result is a greater concentration in the number of grape growers producing the same output. This evolution has been facilitated by the deregulation of the sector in South Africa since the late 1990s43. This is further investigated in the following chapter.
Reversely, looking at the different destinations of fresh grapes exported from South Africa, the decrease of the FOB unit price mainly applies to South African table grapes sold to Germany.
41 Symington, Supermarket Buying Practices, Commonwealth Agri-Forum Platform, September 2010
42 Barrientos S. and Visser M.,South African horticulture: opportunities and challenges for economic and social upgrading in value chains, September 2012
43 Ibid
FOB export prices of fresh grapes in South Africa by destination Source: BASIC, based on Comtrade data
As illustrated in the above diagram, the Comtrade data indicate that the decline of South African grape export prices applies to all the major European importing countries, such as the Netherlands and the United Kingdom. However, it is clearly more pronounced in Germany, which shows the higher commercial pressure exerted by German buyers compared to other markets.
This analysis translates into the following average value breakdown for Germany:
Average Cost Breakdown for South African Table Grape imported in Germany
Source: BASIC, based on data from SATI (South African Table Grape Industry), 2014 and ad-hoc price surveys
South African table grape producers are squeezed between the price pressure of buyers and ever increasing production costs.
In contrast with the decline of the average prices of table grapes exported to Germany, South African grape producers have been facing sharp increase in production costs since the early 2000s.
According to the South African Table Grape Industry, since 2005, the costs of fertiliser have risen by 191%, fuel by 178%, packaging material by 152% and maintenance and repairs by 152%.
Between 2009 and 2013 alone, input costs have increased by 46 % in nominal terms44.
These rising costs have strongly impacted farm profitability (even though the Rand has steadily conceded value to the US$ and the Euro in recent years).45
Many growers also complain about the rising costs of implementing European supermarket requirements. With a few exceptions, suppliers have to meet the costs of changes in supermarket sourcing requirements, which include: rising quality standards, social auditing, new packaging formats (such as the move to punnets or zipped bags) and ‘BOGOF’ (buy one get one free) deals.
All these put additional cost pressures onto growers46. Interviews conducted in 2012 by academic researchers among South African grape farms indicated that47:
- GlobalGap and most supermarket audits cost 6,000 rands (470 euros) per farm per audit excluding auditor transport and food.
- British Retail Consortium costs 12,000 rands (940 euros) per pack house.
- Ethical audits cost about 8,000 rands (620 euros) per farm.
Grape cultivation and postharvest are also very labour intensive and the related costs substantially rose in recent years according to the South African Table Grape Industry: the proportion of production costs accounted for by labour increased from 35 % in 2000 to 47 % in 2009 and to 57 % in 201348.
This is linked to the introduction and gradual increase of the minimum wage for farmworkers determined within the agricultural sector since 2003. This has enabled a significant increase of rural workers’ incomes (which used to be very low until the early 2000s), but also led to numerous job losses in agriculture and strong casualization of labour, especially in the South African grape production49. This trend is further explored and analysed in the last chapter of this report.
Finally, climate events also regularly affect South African production. For example, in November 2008, the “worst flood in memory” caused an estimated damage of 200 million rands to grape farms in the ‘De Doorns’ area, and in January 2012, flash flooding again caused damage on about 20 farms and crop losses of up to 30% in the same region.50
d) Situation and evolution of the table grape industry in South Africa
44 South African Table Grape Industry (SATI) Booklet 2009, 2010 and 2014
45Republic of South Africa, Department of Agriculture, Forestry and Fisheries. Crops and Markets, 2011.
46 Barrientos and Visser, South African horticulture: opportunities and challenges for economic and social upgrading in value chains, 2012 op. cit.
47 Ibid.
48 South African Table Grape Industry (SATI) Booklet 2000, 2009, 2010 and 2014
49 Visser and Fesser, Farm Workers’ Living and Working Conditions in South Africa: key trends, emergent issues, and underlying and structural problems, International Labour Organisation (ILO), February 2015
50 Ibid.
The long history of table grape production and export in South Africa has been profoundly impacted by public deregulation over the past 20 years.
The first table grape variety (Muscat d’Alexander) was planted in the Hex River Valley, and was first exported to the UK in 1886. In 1892, the recently established Cape Fruit Syndicate export company had already exported 2100 cartons of 4.5 kg table grapes.51
The industry soon realised the importance of pre-cooling fruits. The first chambers were used in the Cape Town port in 1925 and the Perishable Products Export Control Board (PPECB) was established in 1926 to control the quality of the exported products. In 1937, the Deciduous Fruit Board was established to modernise farming with powers to fix prices and control marketing.52
In the early 1970s, the Deciduous Fruit Board abolished the control over fresh fruit. Ten years later, as South Africa's political status created growing public concerns overseas, consumer boycotts and divestments campaigns intensified. The decade was marked by strong inflation, decline in profit margins, stagnation of prices in export markets and growing overseas competition53. In 1986, the Deciduous Fruit Board decided to delegate its export marketing powers to the Universal Fruit Trade Co-operative (Unifruco).54
A deregulation era started in the 1990s because of two major shocks:
- The end of the sanctions against apartheid, the opening of the economy to world markets and the rapid liberalisation of export chains,
- the changes in agricultural policies, employment conditions of workers and access to water initiated by the ANC coming into power.
Between 1994 and 1997, the Deciduous Fruit Board started to issue a limited number of export licenses, whereas all fresh table grapes exported were marketed through Unifruco prior to 1994.
By the time deregulation was officially introduced in October 1997, Unifruco’s sales only accounted for 66% of the country’s export volumes and 51 exporter companies had been created55. By 2006, the number of table grape exporters had tripled to reach 161 and the market share of Unifruco’s spin off (called Capespan) was down to 17% of industry's export volumes56.
This opened a period of strong economic growth as well as uncertainties. Grape production rapidly developed in many regions and the table grape market started booming (the production for export almost tripled since the end of the 1990s). This created a new cycle of commodity speculation and agricultural "pioneer fronts” in table grapes, mirroring what had happened previously in the South African cotton sector (in the 1940s) and dried grapes sector (in the 1960s and 1970s).57
Grape production in South Africa: the move towards more industrialised production
51 Burger, 2002
52Symington, Creating Sustainable Competitive Advantage in the Marketing of South African Table Grapes to the United Kingdom in the Deregulated Era, University of Cape Town, Thesis, February 2008
53Ibid.
54 Tregurtha and Vink, 2002 - Fundira, 2003
55 CONSAWU, A Study on the Power Relations in the Fruit Supply Chain, October 2012 op. cit.
56Symington, Creating Sustainable Competitive Advantage in Marketing of South African Table Grapes, 2008 op. cit.
57 Blanchon, Vignes du Kalahari : des raisins dans les turbulences de la mondialisation, Cahiers d’Outre-Mer, 2008
Today, more than 80% of table grape production in South Africa occurs in the Western Cape region.
Other production areas include the Northern Cape, East ern Cape, Limpopo, Free State and Mpumalanga. Grape production for table grape and wine are from different plots.58
Map of South African table grape production
Source: South African Table Grape Industry, Statistics Booklet 2013-2014
The Hex river valley in the Western Cape is the largest production area at 5,185 ha, followed by the Orange River valley with an area of 4,896 ha, the Berg river valley at 3,706 ha, the Northern Province at 1,205 ha and Olifants River at 1,192 ha. South Africa is ranked as the second largest producer of table grapes and is the fourth largest exporter in the Southern Hemisphere. 59
Grape production in South Africa is primarily aimed at the export market and the local market is not substantial (less than 10% of volumes). Because of long trading relationships with Europe, the EU is the major importer absorbing 75% of volumes. Netherlands is the leading destination (from where grapes are re-exported in the EU), followed by the United Kingdom and Germany. 60
58 Republic of South Africa, Department of Agriculture, Forestry and Fisheries, Grapes production guidelines, 2012
59 South African Table Grape Industry, Statistics Booklet 2013-2014
60 Republic of South Africa, Department of Agriculture, Forestry and Fisheries, Grapes production guidelines, 2012
Regional weekly intake of South African table grape production Source: South African Table Grape Industry, Statistics Booklet 2013-2014
In comparison with other exporting countries, South Africa has one of the longest supply season starting from late October until May. Harvest starts in week 43 in the Northern Cape region, followed the Orange River region and finally the Hex river valley region (see diagram above). The first grape crop is supplied to markets by November (see diagram above).
The "boom" of table grapes is often presented as a symbol of successful integration into
"globalization" and a maximisation of the return on investment for the scarce water resources of the country. Even if this cultivation consumes significant amounts of water (around 1,200 m3 / t), it has gross yield which are 7 times higher than in wine, alcohol and grape juice productions. As a result, its value is much higher than all other possible crops in the region, with an estimated average gross income of 18,000 Euros (255,000 Rands) per hectare61 compared to 3,500 Euros (50,000 Rands) per hectare in vine production62.
However, table grape is a very risky market as the prices drop rapidly each year after short peak times, as demonstrated in the Orange valley where the sales are then often made at a loss after week 51 (end of December).
In addition, the investments required to engage in table grape production are proportionate to the expected benefits. For example, in the Orange valley, it takes currently about 35,000 Euros/Ha (500,000 R/Ha) for installation (purchase of land, water permits, soil preparation, installation of irrigation and necessary cold chains for export)
Therefore, only farmers who have already significant land and financial capacity can embark on this new production; it is indeed necessary to be able to support not only the initial investment, but also climatic hazards and price fluctuations on the market. 63
61Blanchon, Vignes du Kalahari : des raisins dans les turbulences de la mondialisation, 2008 op. cit.
62 Vinpro, 2014 record crop: the impact on primary wine grape producers’ financial sustainability, 2015
63Blanchon, Vignes du Kalahari : des raisins dans les turbulences de la mondialisation, 2008 op. it.
These dynamics have dramatically changed the economic conditions of production and, as early ripening has become the decisive factor in grape, they have induced major changes64.
They have triggered strong competition for access to irrigation water permits and access to land, notably in the “Veld”, the rocky low-value land traditionally used for sheep grazing, because this is where grapes ripen much earlier thanks to the dryness of the climate.
As a result, rural landscapes have been profoundly transformed in several regions as vine monoculture became preponderant at the expense of other crops (it represents, for example, 58%
of all irrigated area in the Orange valley).
Towards greater consolidation of the South African grape industry
As detailed earlier, the deregulation of the table grape sector within South Africa has increased the vulnerability of growers to commercial risks, and increased the competition between them to access the northern markets. South African growers have thus been caught in a 'pincer movement' between65:
- on the one side, rising production costs, employment legislation (a range of labour legislation has been enacted since the ANC came into power in 1993), and requirements demanded by supermarkets (in particular the German ones)
- on the other side increased competition and declining real prices on the international markets, in particular in Germany.
As a result, the total number of table grape producers has been significantly reduced in recent years, from 543 in 2008 to 326 in 2013, a decline of 40%66. Smaller farms are increasingly being absorbed by larger farmers in pursuit of economies of scale, and the average farm size is increasing.
As a result, grapes production area and volumes are still on the rise.67
This demonstrates the dynamics of “horizontal integration” in table grape cultivation which has been taking place in the South African table grape industry over the past twenty years. 68 The deregulation has also strongly impacted the export stage of the South African grape industry.
As described earlier, it has enabled the entry of a large number of export market agents:
multinational companies (like Dole and Katope), South African-owned (-based) export agencies, foreign importing companies with branches in South Africa (like the American-based Vanguard and the Dutch-based Van Doorn) and South African-based producers who export their own product.69 As competition intensified because of the proliferation of exporting firms looking for market share, the export sector became polarised between two camps: the top 20 export companies retain over 80% of the export volumes while the remaining 120 or more small exporters make up the balance of export volumes. 70
64Ibid.
65 CONSAWU, A Study on the Power Relations in the Fruit Supply Chain, October 2012 op. cit.
66 South African Table Grape Industry, Statistics Booklet 2013-2014 op. cit.
67Republic of South Africa, A profile of the South African Table Grape market value chain, 2012 op. cit.
68 CONSAWU, A Study on the Power Relations in the Fruit Supply Chain, October 2012 op. cit.
69 Symington, Creating Sustainable Competitive Advantage in Marketing of South African Table Grapes, 2008 op. cit.
70Ibid. Most of the major export houses accredited to the industry's exporters' association, the FPEF, which has played a major role in stabilizing and unifying the export sector since the deregulation.
The leading exporters, especially multinationals, have been able to use their access to cheap international finance, preferential shipping rates and international marketing information to challenge the traditional vertical chains in the South African table grape sector. 71
A notable sign of this profound change was the dissolution of the Capespan Grapes Trust in 2005, which was a historical model of vertical integration in South Africa (formerly called Unifruco), although it remains to date the biggest single export company of grapes in the country72
Since deregulation, the multinational exporters have also developed financial offerings for producers in the form of production loans, advance payments and minimum guaranteed prices to capture greater volumes of grapes and secure access to supermarket chains (also offering post- season rebates and loss leader for a while if necessary). This enabled them to exert control over the whole South Africa grape chain through their strategic position as exporters.
In the meanwhile, smaller exporters have hard times to compete with these large companies and their vulnerable position has cascading adverse effects on the producers working with them. 73 In this context, although table grape producers are well-organised when it comes to technical information and lobbying for access to markets, there is little if any collective action to increase their bargaining power; thus, fragmented growers have been facing a more powerful group of private exporters in South Africa and supermarket buyers in Europe as well as in South Africa.
In reaction, a recent move of vertical integration has been revived. Firstly, a number of producer have integrated forward in exporter companies to build an all year round business, (many emanated from the Capespan Grapes Trust after it was dissolved in 2005).
In turn, the bigger private agents have started to integrate backwards in the value chain by acquiring production units in order to secure the product for themselves. Finally, grape producers doing their own exports are on the rise, like Hoekstra Farms, Suiderland Plase and the more recently established River Fruits.
KEY FINDINGS
- Germany is the second largest consumer market for table grape in Europe; quality standardisation, stable and affordable prices for consumers all year round and retailers’ demand for regularity of supply, have jointly led to the commoditisation of this sector. Large importers and retailers, especially discounters, are the dominant actors of value chains, fostering strong price competition and strict requirements on providers of table grapes.
- South Africa is becoming one of the low-cost providers of fresh grapes to Germany. Its average export price is getting as low as in Italy, and given its higher costs of transport, the price pressure on producers is getting strong. At the same time, the costs of production keep rising, the German buyers are passing on compliance costs, and growers end up being squeezed in the middle.
- The deregulation initiated by the South African government since the late 1990s has accelerated further the fragmentation and consolidation of grape growers who are increasingly integrated in the global value chains of more powerful groups of private exporters in South Africa and supermarket buyers in Europe.
71 CONSAWU, A Study on the Power Relations in the Fruit Supply Chain, October 2012 op. cit.
72 Ibid.
73 Symington, Creating Sustainable Competitive Advantage in Marketing of South African Table Grapes, 2008 op. cit.
4. Wine Case Study
a) Characteristics and evolution of the German wine market
The changing context of world wine consumptionWorld Wine consumption volume Source: OIV, 2014
After years of incremental growth, the world wine market has been hit by the financial and subsequent economic crisis which took place in 2007. Following two years of decrease, the world consumption of wine has globally stagnated since 2010 and even decreased further in 2012 due to the low level of world production (see diagram above).74
World Wine consumption by continent Source: OIV, 2014
In geographical terms, roughly half of the world consumption still takes place in Europe and almost a quarter in Northern America (see map above). Consumption is still highly concentrated: the 5 biggest consumer countries consume roughly half of the world production.75
74 International Organization of Vine and Wine (OIV), The wine market: evolution and trends, May 2014
75 Bouzdine-chameeva & Zhang, 2013
The decline in wine consumption is more pronounced in Europe, the biggest consumer market.
EU-28 wine consumption trend (in thousand HL) Source: OIV, 2014
As shown in the diagram above, the wine consumption per capita is in sharp decline in historical wine producing countries (Italy, Spain, France, etc.), in particular because of changing lifestyles and tastes, anti-alcohol drinking campaigns, and health concerns.
Meanwhile, consumption is stable or slightly increasing in Northern Europe countries such as Germany, UK and Scandinavia, and increasingly oriented towards branded wines or varietal wines (e.g. Merlot, Cabernet Sauvignon, Grenache, Pinot, etc.) rather than Protected Denomination of Origin (PDO) or Protected Geographic Indication (PGI) wines.76
In contrast, world exports and imports of wine have significantly increased since 2000 (albeit for short decreases in 2008, 2009 and 2012).
World Wine trade in Euros and Litres Source: OIV, 2014
As shown in the above graphs, world traded wine is on the rise - especially in recent years - in terms of global value generated (blue curve on top) as well as traded volumes (red curve underneath).
The unit value of traded wine has remained quite stable since the early 2000s (it amounted to 2.28 € per Litre in 2000 and reached 2.62 € per Litre in 2013 – cf. blue histogram at the bottom).77
76 USDA, Wine Annual Report and Statistics, 2015
77 OIV, The wine market: evolution and trends, 2014 op. cit.