www.giga-hamburg.de/workingpapers
orking Papers serve to disseminate the research results of work in progress prior to publicaton to encourage the exchange of ideas and academic debate. n of a paper in the Working Papers series does not constitute publication and should not limit publication in any other venue. Copyright remains with the authors.
GIGA Research Programme:
Socio-Economic Challenges in the Context of Globalisation
___________________________
Religiosity as a Determinant of Happiness Erich Gundlach and Matthias Opfinger
No 163 April 2011
GIGA Working Papers
Edited by the
GIGA German Institute of Global and Area Studies Leibniz‐Institut für Globale und Regionale Studien
The GIGA Working Papers series serves to disseminate the research results of work in progress prior to publication in order to encourage the exchange of ideas and academic debate. An objective of the series is to get the findings out quickly, even if the presentations are less than fully polished. Inclusion of a paper in the GIGA Working Papers series does not constitute publication and should not limit publication in any other venue. Copyright remains with the authors. When working papers are eventually accepted by or published in a journal or book, the correct citation reference and, if possible, the corresponding link will then be included on the GIGA Working Papers website at <www.giga‐hamburg.de/workingpapers>.
GIGA research unit responsible for this issue:
GIGA Research Programme 3: “Socio‐economic Challenges in the Context of Globalisation”
Editor of the GIGA Working Papers series: Bert Hoffmann
<workingpapers@giga‐hamburg.de>
Copyright for this issue: © Erich Gundlach and Matthias Opfinger Editorial assistant and production: Vera Rathje and Silvia Bücke
All GIGA Working Papers are available online and free of charge on the website
<www.giga‐hamburg.de/workingpapers>.
For any requests please contact:
E‐mail: <workingpapers@giga‐hamburg.de>
Phone: +49 (0)40 − 4 28 25 − 548
The GIGA German Institute of Global and Area Studies cannot be held responsible for errors or any consequences arising from the use of information contained in this Working Paper; the views and opinions expressed are solely those of the author or authors and do not necessarily reflect those of the Institute.
GIGA German Institute of Global and Area Studies Leibniz‐Institut für Globale und Regionale Studien Neuer Jungfernstieg 21
20354 Hamburg Germany
E‐mail: <info@giga‐hamburg.de>
Website: <www.giga‐hamburg.de>
Religiosity as a Determinant of Happiness
Abstract
We find a U‐shaped relation between happiness and religiosity in cross‐country panel data after controlling for income levels. At a given level of income, the same level of happiness can be reached with high and low levels of religiosity, but not with intermediate levels. A rise in income causes an increase in happiness along with a decline of religiosity. Our interpretation of the empirical results is that the indifference curves for religiosity and other commodities of the utility function are hump‐shaped.
Keywords: Happiness, religiosity, utility function, long‐run development
JEL Code: I31, Z12, O11
Prof. Dr. Erich Gundlach
is a Claussen‐Simon‐Professor of Economics at the Institute of Asian Studies of GIGA and Professor at Hamburg University, Germany.
Contact: <gundlach@giga‐hamburg.de>
Website: <www.erichgundlach.de>
Matthias Opfinger
is a research fellow at the Department of Economics of Leibniz University Hannover, Germany.
Contact: <opfinger@vwl.uni‐hannover.de>
Erich Gundlach and Matthias Opfinger1
Article Outline
1 Empirical Happiness Research, Religiosity, and Utility Theory 2 Data and Empirical Specification
3 Estimation Results 4 Discussion
5 Conclusion
1 Empirical Happiness Research, Religiosity, and Utility Theory
Since its beginning, empirical research on happiness has been at odds with basic utility the‐
ory. Rich people generally report higher levels of happiness than poor people, but rising av‐
erage incomes do not increase happiness beyond a satiation point according to the Easterlin paradox (Easterlin 1973, 1974, 1995). Hence, an increase in income beyond the satiation point only seems to shift the reference point within a society, without affecting utility as proxied by a measure of happiness. This contradicts textbook utility theory, where changes in income always shift the indifference curve to a higher level of utility.
1 Acknowldgements: For comments and suggestions on earlier versions, we are grateful to Michael Funke, Bernd Lucke, Martin Paldam, Ulrich Schmidt, Holger Strulik, Timo Trimborn, and to seminar participants in Hamburg and at the ISNE 2010 Conference in Dublin.
Taken at face value, the Easterlin paradox has far‐reaching policy implications. If rising incomes only shift the reference point instead of improving utility, a primary goal of gov‐
ernment policy should be higher taxes on income or consumption rather than a focus on economic growth (Layard 2003). This conjecture has led to two related theoretical reactions.
Frey and Stutzer (2006) appeal to mistakes in decision making in cases where utility and sub‐
jective levels of happiness do not correspond. For instance, accepting a better paid job should not reduce happiness because a higher salary should at least compensate for any related in‐
conveniences. But Stutzer and Frey (2008) find that people who accept a better paid job with higher commuting costs report less happiness. So this line of reasoning presumes that utility deviates from subjective happiness because individuals might make mistakes when maxi‐
mizing their utility.
Criticizing the assumption that individuals systematically fail to maximize their utility, Becker and Rayo (2008) argue that measures of happiness and the reported Easterlin paradox might not have a clear foundation in utility theory at all. They consider subjective happiness as an argument of the utility function rather than as a direct proxy for utility itself. According to their approach, utility would remain in the realm of the empirically unknown. If this holds the Easterlin paradox would no longer be at odds with basic utility theory since a decline of happiness with rising income can be interpreted as a substitution effect.
However, there is probably no longer any need to rationalize the Easterlin paradox. New empirical results based on improved international data sets suggest that the Easterlin para‐
dox can be put to rest. Deaton (2008), Stevenson and Wolfers (2008), and Sacks et al. (2010) provide strong evidence for a robust positive link between aggregate indicators of happiness and log per capita income across countries and over time. Moreover, the estimated effects of income on happiness closely resemble the well‐known within‐country correlation between individual levels of happiness and individual income.
The new empirical evidence allows for a fresh start on the empirics of well‐being. We consider happiness as a direct proxy for utility, as implicitly claimed in the empirical happi‐
ness literature (Frey and Stutzer 2002). That is, our textbook utility function implies that in‐
come should be positively correlated with measures of happiness. The next natural step is to look for plausible arguments of such a utility function. Religiosity appears to be one of them.
The present major religions are several centuries or even millennia old. Since their ori‐
gins, the world has changed along many cultural and social dimensions. Beginning with the Enlightenment, the churches as the main institutional manifestations of religion have lost their strong influence on peopleʹs daily decision making in many countries. Due to an ever growing stock of scientific knowledge since the onset of the Industrial Revolution, mankind has learned that natural disasters have other sources than the fury of the Gods. But this can‐
not belie the fact that many people still believe in their Gods, go to church, and pray.
Hence, religiosity or religious behavior obviously creates utility, together with other commodities of the utility function. Below we return to the question which other commodi‐
ties could be part of the utility function. For the moment we hypothesize that religiosity could be either a complement or a substitute for the other commodities, and it may turn out to be a normal or an inferior good. To complicate matters, these potential properties may ac‐
tually differ across religious subgroups within major branches, such as within Christianity, where the Protestant work ethic (Weber 1904/05) and the more joyful way of life encouraged by Catholic norms come to mind. We circumvent such problems by relying on aggregated self‐reported measures of religiosity that are largely independent of the specific religious de‐
nomination of the respondents.
We begin by considering the empirical relation between subjective happiness and religi‐
osity conditional on the level of income. Such a conditional relation should be present in the data if religiosity is an argument of the utility function and if utility can be satisfyingly proxied by measures of happiness.
Earlier empirical research on the link between religiosity and subjective well‐being starts with Ellison (1991), who finds a positive correlation. Robbins and Francis (1996) report a positive relationship between religiosity and happiness in a study among undergraduate students. Peacock and Poloma (1999) suggest that religiosity increases with age and as such tends to increase reported well‐being. Along these lines, Greene and Yoon (2004) assert that subjective well‐being rises with religious attachment as measured by the willingness to at‐
tend religious services regularly.
Ferriss (2002) confirms a positive correlation between happiness and the frequency of church attendance but points to denominational and doctrinal differences across churches.
Lelkes (2006) uses the economic transition in Hungary after the collapse of socialism as an exogenous shock and corroborates that higher religiosity, measured in terms of church at‐
tendance, is positively correlated with reported well‐being. Elliott and Hayward (2009) main‐
tain that tighter government regulation is positively correlated with personal religiosity and life satisfaction, and negatively correlated with participation in social religious activities.
Focusing on life satisfaction instead of happiness, Okulicz‐Kozaryn (2010) finds a bimodal relation between religiosity and subjective well‐being. It appears that religious people in general tend to be either very satisfied or dissatisfied and that they are happier in religious than in non‐religious countries. This result shows that the effect of religiosity on subjective well‐being may depend on the social context and might not be linear.
Taken at face value, a positive relation between religiosity and happiness as reported in some empirical studies is puzzling if two other empirical results are taken into account.
Happiness is positively correlated with the level of income (Deaton 2008; Stevenson and Wolfers 2008; Sacks et al. 2010), and religiosity is negatively correlated with the level of in‐
come (McCleary and Barro 2006; Paldam and Gundlach 2010). Hence, one would expect to find a negative and not a positive correlation between religiosity and happiness without con‐
trolling for income.
Furthermore, a positive correlation between religiosity and happiness conditional on in‐
come does not necessarily pick up the effect of religiosity on happiness if there are other in‐
puts into the utility function that may be correlated with religiosity but are not accounted for.
That is, a robust estimate would have to control for a potential omitted variables bias. On top of this, the result reported by Okulicz‐Kozaryn (2010) suggests that an empirical specification should allow for a non‐linear relation between religiosity and happiness.
To the best of our knowledge, the hypothesis of a non‐linear relation between happiness and religiosity has not been further discussed in the literature. The only other related study we are aware of is based on household survey data for a sample of Tibetan herders. Tu et al.
(2011) report an inverted U‐shaped relation between religious “inputs” (time and money spent in the temple) and income. Though the great majority of the respondents appears to be on the upward sloping part of the curve linking economic performance to religious inputs, some respondents appear to use too many resources as religious inputs relative to the eco‐
nomic performance achieved. Given that economic performance is a good proxy for happi‐
ness, these findings would imply that the same level of happiness (economic performance) can be achieved with high and low levels of religious inputs.
We explore the possibility of an aggregate non‐linearity between religiosity and happi‐
ness at the level of countries, and propose an interpretation of such a non‐linear relation in terms of a textbook utility model. Our hypothesis is that conditional on the level of income, a given level of happiness may be attainable with low or high levels of religiosity, but not with intermediate levels. This reasoning implies a hump‐shaped indifference curve with religiosity as one of the commodities of the utility function. In addition, we hypothesize that religiosity is substituted for other commodities of the utility function when the level of income rises.
Section 2 describes the data and our empirical specification. In Section 3 we discuss our main empirical result on the relation between happiness and religiosity and consider its ro‐
bustness conditional on a number of alternative controls and estimation methods. Section 4 provides an assessment of our empirical results and an interpretation in terms of long‐run development. Section 5 concludes.
2 Data and Empirical Specification
Our measure of happiness is taken from the study by Stevenson and Wolfers (2008). Their measure is calculated from data provided by the World Values Survey (WVS). The WVS is based on surveys that have been conducted in many developing and industrialized countries in several waves. The survey questionnaire includes information about the respondentsʹ demographics, such as age and gender, as well as the economic circumstances of the house‐
hold. The data used in Stevenson and Wolfers (2008) span the four waves 1982, 1990, 1995, and 2000.
The WVS questions concerning happiness are asked in the following way: “Taking all things together, would you say you are: very happy; quite happy; not very happy; not at all happy?” Stevenson and Wolfers (2008) create a measure of average national happiness and from the sample data by running an ordered probit regressions on country fixed effects.2 We use their approach to generate an augmented sample that includes the 2005 WVS wave.3 This unbalanced panel of happiness data with the aggregated individual information from the five WVS waves includes 93 countries, with 11 countries participating in all five waves and 32 countries participating in at least three of the five waves.4
The ordered probit index of happiness is our dependent variable, i.e., our proxy for aver‐
age national utility. This index of happiness is distributed mainly between ‐1 and 1. The lowest value of the happiness index is reported by Albania in 1995 (‐1.142), the highest by Nigeria in the year 2000 (0.9982).
Our measure of average national religiosity is taken from Paldam and Gundlach (2010).
The religiosity score (religiosity) is based on answers to questions from the same waves of the WVS that have been used to construct the happiness index. Paldam and Gundlach (2010) use factor analysis to identify a robust average measure of religiosity that is based on answers to 14 items that are directly related to religious behavior, such as whether respondents fre‐
quently attend religious services, believe in God, or think that religion is important in life and faith is important in teaching children. This measure is held to identify the importance of religion in all aspects of peopleʹs lives. We divide the reported religiosity score by 100 to avoid four‐digit regression coefficients, such that the rescaled religiosity score ranges from 0.02 points in China in 1990 to 0.91 points in Nigeria in 1995.
The income data come from the Maddison homepage (Maddison 2010), where income is measured as Gross Domestic Product per person in constant international prices (ln gdpc).
For countries that are included in the WVS but not in the Maddison data, we rely on income data from the CIA World Factbook. In our sample, per capita income in constant prices ranges from 686 dollars for Ethiopia in 2005 to 43,900 dollars for Luxembourg in 2000.
A number of control variables are included as potential additional determinants of hap‐
piness, i.e. as potential arguments of the utility function. Measures of political rights and civil
2 The WVS also includes a measure of life satisfaction. In parts of the literature, well‐being, happiness, and life satisfaction have been used synonymously. But there may be differences between the concepts, notwithstand‐
ing a statistically significant correlation between the measures of happiness and life satisfaction. A possible dis‐
crepancy could be the time horizon that is considered when respondents answer questions about happiness and life satisfaction. Happiness is probably a more short‐term measure of personal well‐being, whereas life sat‐
isfaction takes into account a long‐term perspective. In this paper, we focus on happiness as the dependent variable and report results for life satisfaction only when considering the robustness of our main result.
3 We have been able to reproduce the Stevenson‐Wolfers happiness data for the first four WVS waves up to mi‐
nor differences in the range of second decimal points.
4 We drop Tanzania (one observation for the year 2000) from our sample because of inconsistent data on happi‐
ness and life satisfaction.
liberties are taken from Freedom House and rescaled in a way that the highest value of 7 re‐
lates to a situation with the highest degree of political rights and civil liberties, respectively.
The degree of democracy as measured by the polity score is taken from the Polity IV dataset.
Data on the marriage rate come from the United Nations Statistics Division, from the United Nations Statistical Yearbook and from the World Consumer Lifestyles Databook. Information on life expectancy at birth, the rate of (log) inflation, and the unemployment rate are taken from the World Development Indicators of the World Bank. Detailed definitions and sources for all variables that are used in our empirical analyses are reported in the appendix (Table A1).
We are mainly interested in the empirical relation between happiness and religiosity. Our dependent and independent variables are measured across countries i at times t. In our most general specification, our measure of happiness is regressed on religiosity and on squared re‐
ligiosity to allow for a non‐linear relation, on log per capita income (lngdpcit), and on other controls:
(1) happinessit = +c β1religiosityit +β2
(
religiosity)
2it+β3lngdpcit +β4Xit+α α εi+ t + it,where
β
1 andβ
2 are the main coefficients of interest, Xit is a vector of control variables that are expected to affect the level of happiness along with religiosity and income,α
i andα
t are country‐fixed and time‐fixed effects, andε
it is an error term.We begin with a benchmark specification of equation (1) that keeps (linear) religiosity and income as the only explanatory variables and uses all available data points. We also check whether religiosity can be considered a threshold variable, which would motivate a non‐linear specification of religiosity. The robustness of our results for the non‐linear religi‐
osity specification is subsequently tested by including alternative control variables and using different estimation methods.
3 Estimation Results
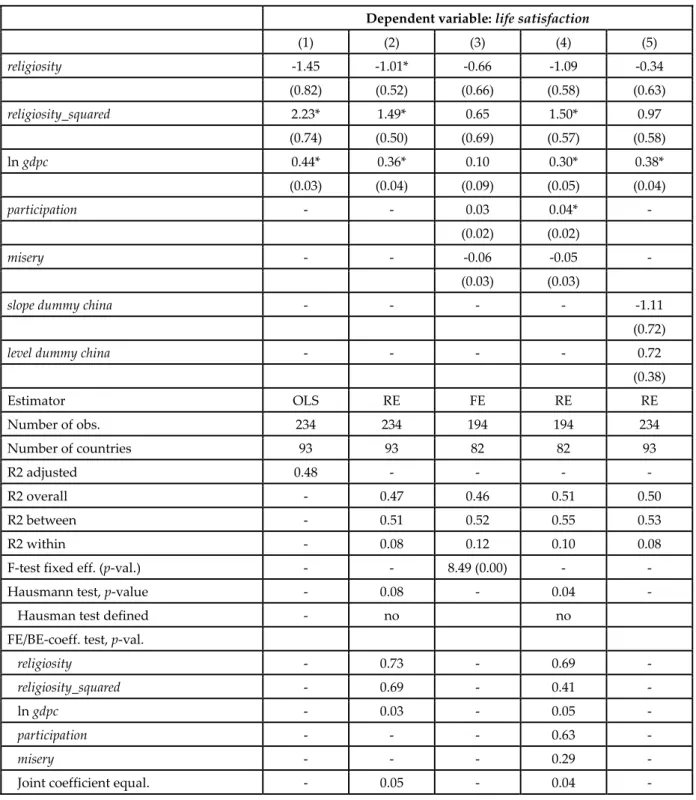
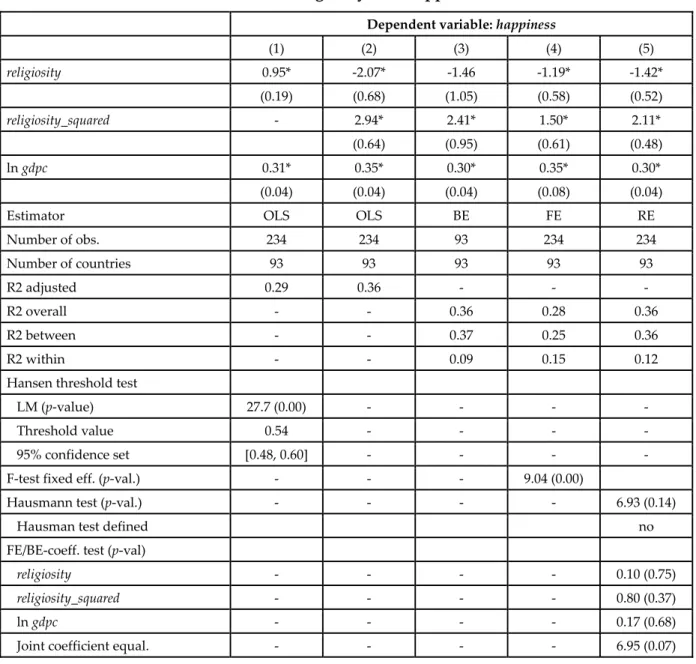
Our basic results for the benchmark estimation are reported in Table 1. The first column shows that income and religiosity have statistically significant positive effects on happiness.
An increase in income by one logarithmic point is predicted to raise the happiness index by 0.31 points. This income effect is in line with the effect on happiness reported by Stevenson und Wolfers (2008), who do not control for religiosity.
The income effect is large. The total variation in our measure of happiness between the
25th and the 75th percentile is about 0.64 index points. The difference in income between the
25th and the 75th percentile of our sample is about 1.45 logarithmic points. In this specifica‐
tion, income differences can statistically explain about 70 percent of the variation in happi‐
ness between the 25th and the 75th percentile (0.31*1.45/0.64=0.70).
The coefficient estimate for religiosity is also statistically significant and quantitatively important. An increase in the religiosity score by 10 percentage points is predicted to raise the happiness index by 0.1 points.5 Thus, higher religiosity seems to increase happiness, in‐
dependent of the level of income.
However, such an interpretation excludes the possibility that the same level of well‐being can be reached with low and high levels of religiosity, as suggested by Okulicz‐Kozaryn (2010) and indirectly implied by the results of Tu et al. (2011). To test for a possible bimodal distribution of religiosity at the country level, we employ the threshold regression test pro‐
posed by Hansen (2000), with religiosity as the threshold variable.6
The reported results have been derived by employing the heteroskedasticity‐consistent Lagrange multiplier test for a threshold. The p‐value for the LM test is below the one percent level of statistical significance. The threshold value occurs at a religiosity score of 54 percent with an asymptotic 95 percent confidence interval of 12 percentage points. It turns out that the religiosity threshold variable splits the sample into two equally‐sized subsamples: a low‐
religiosity subsample with 117 observations and a high‐religiosity subsample with 117 ob‐
servations. For the high‐religiosity subsample, the effect of religiosity on happiness remains positive as in column (1), but for the low‐religiosity subsample, there is a negative though statistically insignificant effect.
This result points to a non‐linear effect of religiosity on happiness. The threshold regres‐
sion approach identifies an abrupt regime change within a rather narrow interval of the re‐
ligiosity score. To allow for a more gradual regime change, the specification in column (2) of Table 1 includes religiosity squared as an additional explanatory variable. Given the results of the threshold regression test, we would expect to find a negative coefficient on the linear religiosity term and a positive coefficient on the squared religiosity term.
The results in column (2) are as expected. The coefficient on the linear religiosity term is negative and the coefficient on the squared religiosity term is positive. Both coefficients are statistically significant at the one percent level. The coefficient on income remains more or less unchanged and statistically significant. These estimates point to a U‐shaped relation be‐
tween happiness and religiosity, conditional on the level of income.
The next three columns of Table 1 display the results for alternative estimators. The U‐
shaped religiosity effect and the income effect also show up for a between‐estimate (an aver‐
age of the cross‐sections) in the third column, but the negative linear religiosity effect is no longer statistically significantly different from zero. The statistical significance returns for a within‐estimate (with country‐fixed effects) in the fourth column, where the hypothesis of a joint significance of the country dummies cannot be rejected.
5 For the regression analysis we have rescaled the religiosity score. The coefficient used for the calculation of the effect of religiosity on happiness is 0.0101.
6 We are grateful to Bernd Lucke for running all threshold regression tests reported in the paper.
The between‐ and the within‐effects appear to be rather similar in size for each of the two religiosity terms and the income variable. Therefore, we employ the random‐effects estima‐
tor in column (5). Since the random‐effects estimator is a weighted average of the between‐
and the fixed‐effects estimators, the RE results are necessarily much in line with the other es‐
timates, but the question is whether the random effects estimator can be considered as efficient.
According to the Hausman test statistic, it seems that a random effects model cannot be rejected relative to a fixed effects model at conventional levels of statistical significance.
However, it turns out that the difference between the estimated covariance matrices is not positive definite, so the Hausman test is not defined and cannot be applied.
Following Gould (2001), we use a coefficient test to check the efficiency of the random‐
effects estimator. The first step is to decompose each explanatory variable into a mean value (across countries) and a difference from the mean. Then a regression of the dependent vari‐
able on this set of explanatory variables produces the coefficients on the averaged and the demeaned variables that would be estimated separately by between‐effects and by fixed‐
effects regressions. If it turns out that the coefficients on the averaged and the demeaned variables are not statistically significantly different, the random effects estimator can be con‐
sidered as efficient.
The results in Table 1 show that the hypothesis of equal coefficients estimated with fixed‐
and between‐effects cannot be rejected for each explanatory variable individually. The hy‐
pothesis of equal fixed‐ and between‐effects coefficients also cannot be rejected if the three explanatory variables are considered jointly. We use these test results to proceed with the random effects estimator.
In the next step we test whether the U‐shaped relationship between happiness and religi‐
osity also holds if other variables are taken into account that may have an independent effect on happiness. For instance, Frey and Stutzer (2002) see a role for political factors in the ex‐
planation of well‐being. Easterlin (1973, 2001) argues that well‐being is influenced by per‐
sonal and family matters, by health, and by economic factors other than average income, such as inflation and unemployment. The empirical problem is that most potential control variables will be correlated with income, which makes it difficult to identify their independ‐
ent effect on happiness.
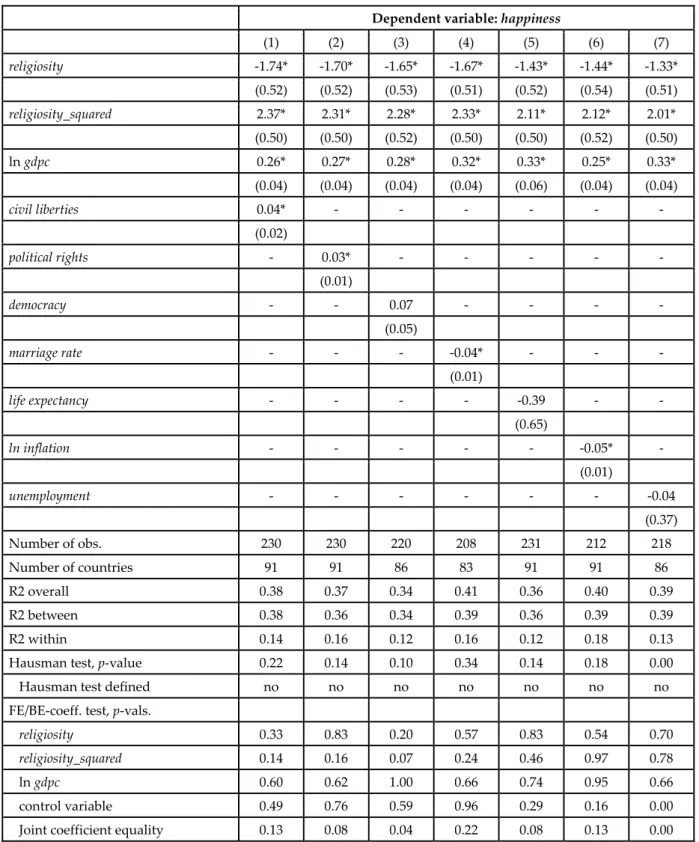
Our general finding from including further control variables is that the U‐shaped relation between happiness and religiosity remains intact. Table 2 reports random effects estimation results for the inclusion of civil liberties, political rights, democracy, the marriage rate, life expec‐
tancy at birth, the log inflation rate, and the unemployment rate. Some of the additional control variables are statistically significant and have the expected sign (except for the marriage rate), but their inclusion leaves unchanged the effects of religiosity and income. This finding appears to reduce the probability that an omitted variables bias is driving the estimated U‐
shaped relation between happiness and religiosity.
The test results show that a random effects model cannot be rejected for most specifica‐
tions. The Hausman test would reject a random effects model only for column (7), but it turns out that the Hausman test cannot be applied in any specification because its underlying assumptions are not satisfied. The alternative coefficient test (Gould 2001) suggests, with one exception, that the fixed‐effects coefficients and the between‐effects coefficients of all of the individual regressors are not different from each other at the five percent level of statistical significance. The joint equality of the between‐effects and the fixed‐effects coefficients also cannot be rejected, except for columns (4) and (7). Overall, these results provide rather strong support for estimation with a random effects model.
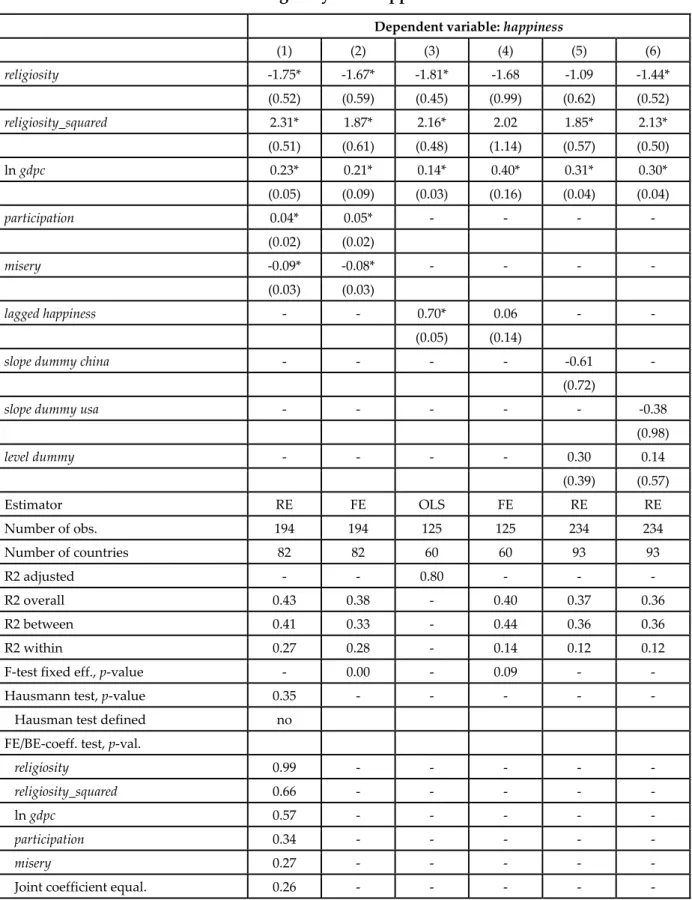
Column (1) in Table 3 uses two aggregate measures of the previously considered control variables to see if their simultaneous inclusion has an effect on the estimates of religiosity and income. The average of civil liberties and political rights is called the participation index, and the average of the inflation rate and the unemployment rate called the misery index. Both aggregated variables enter in a statistically significant way, but the effects of religiosity and income on happiness remain unchanged by their inclusion.
The test results again reveal that the Hausman test cannot be applied. As before, the coef‐
ficient test cannot reject a random effects model in favor of a fixed‐effects model. Column (2) provides the fixed‐effects results to allow for a direct quantitative comparison of the esti‐
mated coefficients. The FE‐coefficients are similar in magnitude and in levels of statistical significance to the RE‐coefficients, as implied by the results of the coefficient test in column (1).
The inclusion of the lagged endogenous variable is another possibility to check the ro‐
bustness of our estimates. For instance, one could speculate that there is an inverse relation from happiness to religiosity, such that religiosity is in fact a U‐shaped function of happiness and not the other way round as in our previous specifications. If this was true, our significant religiosity estimate would actually identify the effect of the missing lagged happiness vari‐
able. Column (3) shows that the coefficient of lagged happiness is indeed large and highly statistically significant, but the estimated coefficients on the two religiosity terms and on in‐
come are not much affected. Controlling for country‐fixed effects in column (4) eliminates the relevance of the lagged endogenous variable. It also reduces the statistical significance of the religiosity coefficients to the 10 percent level, but their size remains largely unchanged.
As an interesting side result, the hypothesis of a joint significance of the country dummies is rejected for this specification.
Our results may also be sensitive to the inclusion of extreme observations on religiosity.
Relative to their income level, China and the United States have religiosity scores that can be considered as outliers for most WVS waves (Paldam and Gundlach 2010). In column (5), we include a dummy that equals 1 for China and zero otherwise. The China dummy enters twice, as a level dummy and as a slope dummy that is interacted with the linear religiosity variable. This specification reveals that the low conditional religiosity scores of China affect the estimated coefficient on the linear religiosity variable. In the dummy specification, the
coefficient is substantially reduced in size and is statistically significant only at the eight per‐
cent level. But the negative sign remains, and the estimated coefficient is still within the 95 percent confidence interval of all the negative coefficients in Tables 1, 2, and 3.7 In column (6), the slope dummy for the United States has been interacted with the squared religiosity vari‐
able in order to allow for a possible effect of the exceptionally high conditional US religiosity scores. In this case there seems to be no quantitative impact on the estimated U‐shaped ef‐
fects of religiosity on happiness.
As a final robustness check, we consider a measure of life satisfaction as an alternative de‐
pendent variable, i.e., as an alternative proxy for utility. Table A2 repeats some of the specifi‐
cations discussed in Tables 1 and 3. The general impression is that the estimates are less ro‐
bust than with happiness as the dependent variable, but a conditional U‐shaped relation also emerges for life satisfaction and religiosity.
With the OLS estimator in column (1), the religiosity terms have the signs and the sizes familiar from Tables 1‐3, but the linear religiosity term is only statistically significant at the eight percent level. The RE estimator in column (2) produces a marginally significant (five percent level) linear religiosity coefficient. The coefficient test shows that the RE estimator cannot be considered as efficient, mainly because the estimated FE‐ and BE‐coefficients of in‐
come are statistically different from each other. However, the estimated FE‐ and BE‐coef‐
ficients of the two religiosity terms are not statistically different from each other.
Columns (3) and (4) repeat specifications with the additional controls participation and misery. The FE results are statistically insignificant, which is probably due to the high within‐
multicollinearity of the explanatory variables. But even these estimates reflect the same pat‐
tern as the statistically significant estimates in column (4) of Table 3. The RE results are like the RE results in column (2) and thus show that the additional controls do not affect the religi‐
osity coefficients. The linear religiosity coefficient is statistically significant at the six percent level, and the coefficient test suggests that the religiosity coefficients are efficiently estimated.
The last column of Table A2 shows that the religiosity observations for China have a strong effect on the estimated coefficients if life satisfaction is used as the dependent variable.
The two China dummies reach marginal levels of statistical significance (12 percent and six percent, respectively), and the coefficients of the two religiosity terms become smaller and statistically insignificant.
It could be objected that our results may suffer from some shortcomings. One qualifica‐
tion is that we solely rely on happiness and religiosity data from the World Values Survey, and that these data may include some rather extreme observations, especially on religiosity
7 In addition, it is not self evident that the low conditional religiosity scores of China should be considered as biased, say, due to repressive measures by the government. The religiosity score of Hong Kong in 2005 is in the same range, but cannot be explained away by repressive government measures. This is not to deny that further research may be necessary to understand the exceptionally low Chinese religiosity scores, and proba‐
bly also the exceptionally high conditional religiosity scores of the United States.
as shown by the inclusion of the China dummies. Other data sources might lead to different results. However, the results in Stevenson and Wolfers (2008) on the effect of income on hap‐
piness did not depend on the data source, so maybe this holds for alternative measures of re‐
ligiosity as well. Another qualification is that we have only used a very limited set of proxy variables for family matters and health, which may also determine the level of happiness. But the robustness of our results indicates that the effect of further control variables may turn out to be limited.
Taken together, we find an average linear religiosity coefficient of ‐1.75 and an average squared religiosity coefficient of 2.31 with the preferred random effects estimation with addi‐
tional controls (Table 3, column 3). In the initial sample of 234 observations, the difference be‐
tween the 25th and the 75th percentile in both the linear and the squared religiosity score is about 0.3 points (0.32 points vs. 0.35 points). Hence with specification (3) of Table 3, the esti‐
mated net effect of religiosity explains about 39 percent of the variation in happiness be‐
tween the 25th and the 75th percentile, and the estimated income effect here explains 53 per‐
cent of the variation.
The linear and the squared coefficient estimates also predict the level of religiosity that minimizes the level of happiness, conditional on income and other potential control vari‐
ables. Using the same religiosity coefficients as before, happiness is minimized at a religiosity score of 38 percentage points. Since our measure of religiosity mainly ranges between 90 and 20 percentage points, the maximum loss of well‐being appears to be caused by a relatively large decline in religiosity away from the level typical for traditional societies towards a level more typical of modern societies.
Our results are in line with textbook utility theory in so far as income would shift the utility function, which is proxied by our measure of happiness, and religiosity together with participation and the absence of misery would appear as commodities of the utility function.
However, a U‐shaped relation between happiness and religiosity does not fit into the text‐
book utility model. In the next section we review some arguments in favor of a non‐linear re‐
lation between happiness and religiosity, and consider how this relation can be interpreted from the perspective of a simple utility model.
4 Discussion
Our stylized empirical result implies that all else constant, people are happier in countries in which the level of religiosity is either high or low, but are less happy in countries with inter‐
mediate levels of religiosity. One possible explanation for this observation is that people may be less happy when the population is highly heterogeneous in terms of cultural attitudes and social norms.
For instance, a very religious person in a country in which the average level of religiosity is rather low may feel unhappy because the rest of the population follows a distinctly differ‐
ent way of life. This could be associated with a feeling of a loss of values, independent of the actual religious denomination. A frequent churchgoer, for example, could be unhappy even though he attends mass every Sunday if he realizes that only very few of his neighbors join him. An atheistic person may feel unhappy if he lives in a very religious country, even more so if the secular part of life is influenced by religious affairs such that, say, shops are closed on Sundays, there is no public transportation on Sabbath, and restaurants are closed during daytime in Ramadan.
Apparently, well‐being is difficult to achieve without being part of a community in which people share similar attitudes and beliefs, and identify with the same moral values. This can be illustrated by simple network effects. A large network is more effective than a small net‐
work. If an atheistic person realizes that nobody else practices religious ceremonies and if a very religious person realizes that everybody else enjoys praying or working for the religious community, both networks could be a source of happiness and life satisfaction.8 But in socie‐
ties without such networks or in societies with alternative networks for atheists and religious believers, the result could be distrust or even rivalry between the different networks because the formation of a common identity of the two groups is not possible. Such an outcome could be a source of less happiness and life satisfaction on average, especially in the absence of long‐run income growth for all groups.
Another factor that could explain the conditional U‐shaped relationship is that countries with intermediate levels of religiosity are typically countries with medium levels of income.
Paldam and Gundlach (2010) argue that secularization in the form of a religious transition is part of the long‐run process of economic development. This process generates fundamental changes in almost all matters of life and all fields of society. For instance, people may have to move from rural to urban homes, from labor‐intensive to skill‐intensive jobs, from high to low fertility and from low to high female labor supply, and also have to experience the some‐
times rocky path from non‐democratic to democratic forms of government. All these changes are likely to contribute to an initial feeling of insecurity, and consequently to less personal happiness and life satisfaction. Not surprisingly, some social groups correctly believe that they have been better off before the transition process started. But after the transition has been completed and a low level of religiosity is reached, the average level of subjective well‐
being may be high again due to a possible substitution of religiosity for other commodities of the utility function.
That is why network effects and transition effects can be considered as determinants of the U‐shaped relationship between happiness and religiosity. People should be happier when they feel they belong to a social group. If this group identification is not possible or if there is
8 A steep upward sloping part of a U‐shaped relation between happiness and religiosity illustrates that religious people could have relatively high or relatively low levels of well‐being, as reported by (Okulicz‐Kozaryn 2010). The same may hold for non‐religious people, as implied by a steep downward sloping part of the same U‐shaped relation.
rivalry between religious and non‐religious networks, less happiness is likely to prevail. And people are likely to be less happy when being confronted with ongoing fundamental socio‐
economic transitions. Hence the presence of stable social networks and the absence of large transition effects may explain why countries with very high and countries with very low levels of religiosity report higher subjective happiness than countries that are stuck in between.
What remains to be puzzling is how the hypothesis of a U‐shaped relation between hap‐
piness and religiosity can be interpreted within a standard indifference curve diagram. The problem is that a convex indifference curve would not allow for such a U‐shaped relation – which implies that the indifference curve cannot be convex if our empirical results hold.
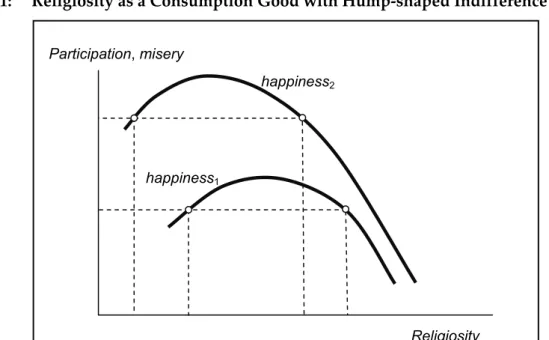
In Figure 1, happiness is used as a proxy for utility, which is represented by an indiffer‐
ence curve. An increase in income shifts the indifference curve to the north‐east, implying a higher level of happiness. Religiosity is held to be one of the consumption goods that deter‐
mine happiness; participation and the absence of misery are proposed to be other consumption goods that affect happiness, as reported in Table 3.
The level of happiness (utility) is constant along a given indifference curve. Our regres‐
sion results imply that happiness falls with declining religiosity until the minimum is reached at a religiosity score slightly below 40 percentage points, and rises thereafter with further declining religiosity. Hence, moving along a given indifference curve from right to left, happiness will remain constant if falling religiosity consumption is compensated for by rising consumption of the other determinants of happiness. But this standard pattern of sub‐
stitution only holds as long as the positive (squared) religiosity effect determines the out‐
come on happiness. Once the minimum of the happiness‐religiosity relation has been reached, lower levels of religiosity consumption lead to higher levels of happiness. To keep utility (happiness) constant, falling consumption of the other determinants of happiness is required if the consumption of religiosity falls beyond the level corresponding to the esti‐
mated happiness minimum. Therefore, our finding of a U‐shaped relation between happi‐
ness and religiosity implies a hump‐shaped indifference curve, where the hump of the indif‐
ference curve occurs at the minimum of the U‐shaped happiness‐religiosity relation.
With a hump‐shaped indifference curve, we get the same level of happiness for low and for high levels of religiosity, conditional on the level of income and conditional on the level of other determinants of happiness. This result would reappear for all levels of income, i.e. for hump‐shaped indifference curves that represent different levels of happiness such as the two curves in Figure 1. As these indifference curves are drawn, an increase in income would re‐
sult in a decline of religiosity for constant relative prices.
The implication of Figure 1 is that there are two extreme equilibria at the intersection of the indifference curves with the axes, which become visible once a budget constraint is in‐
cluded. It is tempting to conclude that these are the equilibria that are reached before and af‐
ter the religious transition from a traditional to a modern level. For instance, a shift from the traditional high religiosity equilibrium to the modern low religiosity equilibrium would be
reached in Figure 1 if the slope of the budget constraint would rise with rising levels of in‐
come. However, more research is necessary to show that persistent changes in the relative price of religiosity can explain the observed religious transition.
5 Conclusion
Our basic result is a conditional U‐shaped relation between happiness and religiosity. Coun‐
tries with high levels of religiosity and countries with low levels of religiosity report higher levels of well‐being than countries with medium levels of religiosity, conditional on the level of income. We argue that this outcome reflects network and long‐run transition effects.
Religious people might be happier if they live in a religious society. By the same token, atheistic people might be happier if they live in a society in which religion does not play an important role. Both groups might be less happy in countries with medium levels of religios‐
ity, due to the rivalry between the networks if no common identity is formed. The long‐run religious transition could be another reason for the estimated non‐linearity between happi‐
ness and religiosity. People might be unhappier and less secure on average during the transi‐
tion from a traditional to a modern society, which triggers changes in many economic, politi‐
cal, and cultural variables, not only with regard to religiosity.
Taken at face value, our empirical results imply a hump‐shaped indifference curve, given that happiness can be considered as a proxy for utility and religiosity as an input of the util‐
ity function. Further research should reveal whether persistent changes in the relative price of religiosity in the course of economic development can help explain the transition from a traditional to a modern level of religiosity that may follow from our hump‐shaped indiffer‐
ence curves.
Bibliography
Becker, Gary S., and Luis Rayo (2008), Comment, in: Brookings Papers on Economic Activity, 1, 88‐95.
CIA (2011), The World Factbook, online: <www.cia.gov/library/publications/the‐world‐factbook/>.
Deaton, Angus (2007), Income, Health, and Well‐Being Around the World: Evidence From the Gallup World Poll, in: Journal of Economic Literature, 22, 2, 53‐72.
Easterlin, Richard A. (1973), Does Money Buy Happiness?, in: The Public Interest, 30, Winter, 3‐10.
Easterlin, Richard A. (1974), Does Economic Growth Improve the Human Lot? Some Empirical Evidence, in: Paul A. David and Melvin W. Reder (eds.), Nations and Households in Economic Growth: Essays in Honor of Moses Abramowitz, New York: Academic Press, 89‐125.
Easterlin, Richard A. (1995), Will Raising the Incomes of All Increase the Happiness of All?, in: Journal of Economic Behavior and Organization, 27, 1, 35‐47.
Elliot, Marta, and R. David Hayward (2009), Religion and Life Satisfaction Worldwide: The Role of Government Regulation, in: Sociology of Religion, 70, 3, 285‐310.
Ellison, Christopher G. (1991), Religious Involvement and Subjective Well‐Being, in: Journal of Health and Social Behavior, 32, 1, 80‐99.
Euromonitor International (2009), World Consumer Lifestyles Databook, London.
Ferrer‐i‐Carbonell, Ada (2005), Income and Well‐being: An Empirical Analysis of the Comparison Income Effect, in: Journal of Public Economics, 89, 997‐1019.
Ferriss, Abbott L. (2002), Religion and the Quality of Life, in: Journal of Happiness Studies, 3, 199‐215.
Freedom House homepage (2010), online: <www.freedomhouse.org/template.cfm?page=439>.
Frey, Bruno S., and Alois Stutzer (2002), What Can Economists Learn from Happiness Research?, in: Journal of Economic Literature, 40, 2, 402‐435.
Frey, Bruno S., and Alois Stutzer (2006), Mispredicting Utility and the Political Process, in:
Edward J. McCaffery and Joel Slemrod (eds.), Behavioral Public Finance, New York: Russel Sage Foundation, 113‐140.
Gould, William (2001), What Is the Between Estimator? Stata Home, Resources & Support, Frequently Asked Questions, March, online: <www.stata.com/support/faqs/stat/xt.html> (03 March 2011).
Greene, Kenneth V., and Bong Joon Yoon (2004), Religiosity, Economics and Life Satisfaction, in: Review of Social Economy, 62, 2, 245‐261.
Gurr, Ted R., Monty G. Marshall, and Keith Jaggers (2010), Polity IV Project: Political Regime Characteristics and Transitions, 1800‐2009, online: <www.systemicpeace.org/polity/polity4.
htm> (03 March 2011).
Hansen, Bruce E. (2000), Sample Splitting and Threshold Estimation, in: Econometrica, 68, 3, 575‐603.
Layard, Richard (2003), Happiness: Has Social Science A Clue?, Lionel Robbins Memorial Lectures 2002/3, London School of Economics, March 3‐5, online: <http://cep.lse.ac.uk/events/lectures/
layard/RL030303.pdf> (03 March 2011).
Layard, Richard (2005), Rethinking Public Economics: The Implications of Rivalry and Habit, in: Pier Luigi Porta, and Luigino Bruni (eds.), Economics and Happiness: Framing the Analysis, New York: Oxford University Press, 147‐169.
Lelkes, Orsolya (2006), Tasting Freedom: Happiness, Religion and Economic Transition, in:
Journal of Economic Behavior and Organization, 59, 2, 173‐194.
Maddison, Angus (2010), Statistics on World Population, GDP and Per Capita GDP, 1‐2008 AD, verti‐
cal‐file_02‐2010‐1.xls, online: <www.ggdc.net/MADDISON/oriindex.htm> (05 March 2010).
McCleary, Rachel M., and Robert J. Barro (2006), Religion and Economy, in: Journal of Economic Perspectives, 20, 2, 49‐72.
Okulicz‐Kozaryn, Adam (2010), Religiosity and Life Satisfaction Across Nations, in: Mental Health, Religion & Culture, 13, 2, 155‐169.
Paldam, Martin, and Erich Gundlach (2010), The Religious Transition. A Long‐run Perspective, Working Paper, 1576, Kiel Institute for the World Economy, online: <http://mit.econ.au.
dk/vip_htm/mpaldam/Papers/Rel‐Tran‐text.pdf> (12 January 2011).
Peacock, James R., and Margaret M. Poloma (1999), Religiosity and Life Satisfaction Across the Life Course, in: Social Indicators Research, 48, 3, 321‐345.
Robbins, Mandy, and Leslie J. Francis (1996), Are Religious People Happier? A Study among Undergraduates, in: Leslie J. Francis, William K. Kay, and William S. Campbell (eds.), Research in Religious Education, Herefordshire: Gracewing, 207‐217.
Sacks, Daniel W., Betsey Stevenson, and Justin Wolfers (2010), Subjective Well‐being, Income, Economic Development and Growth, NBER Working Paper, 16441, Cambridge MA.
Stevenson, Betsey, and Justin Wolfers (2008), Economic Growth and Subjective Well‐Being: Re‐
assessing the Easterlin Paradox, in: Brookings Papers on Economic Activity, 1, 1‐87.
Stutzer, Alois, and Bruno S. Frey (2008), Stress that Doesn’t Pay. The Commuting Paradox, in:
Scandinavian Journal of Economics, 110, 2, 339‐366.
Tu, Qin, Erwin Bulte, and Shuhao Tan (2011), Religiosity and Economic Performance: Micro‐
econometric Evidence from Tibetan Area, in: Chinese Economic Review (forthcoming).
United Nations (UN) (various issues), Statistical Yearbook, New York, online: <http://unstats.un.org/
unsd/syb/> .
United Nations (UN) Statistics Division, Demographic and Social Statistics, online: <http://unstats.un.
org/unsd/demographic/default.htm> (03 March 2011).
Weber, Max (1904/05), Die protestantische Ethik und der “Geist” des Kapitalismus, in: Archiv für Sozialwissenschaft und Sozialpolitik, 20, 1‐54 and 21, 1‐110.
World Bank (2010), World Development Indicators, online: <http://data.worldbank.org/indicator>
(03 March 2011).
Appendix
Table A1: Definitions and Sources of Variables
Dependent variable
happiness Measure of average national happiness, generated by ordered probit regression with country fixed effects from individual answers to the World Values Survey question: ʺTaking all things together, would you say you are:
very happy; quite happy; not very happy; not at all happy?ʺ
Sources: Own calculations based on Stevenson and Wolfers (2008) and WVS data for 1982, 1990, 1995, 2000, and 2005.
Explanatory variables (alphabetical order)
civil liberties Index of civil liberties, here rescaled so that a higher value corresponds to a higher level of civil liberties.
Source: Freedom House (2010).
http://www.freedomhouse.org/template.cfm?page=439.
democracy Measures the degree of democracy. The index is constructed to range from ‐10 for total autocracies to +10 for total democracies.
Source: Gurr et al. (2010).
http://www.systemicpeace.org/polity/polity4.htm.
gastil Arithmetic average of civil liberties and political rights.
Source: Freedom House (2010).
http://www.freedomhouse.org/template.cfm?page=439.
life expectancy Years of life expectancy at birth.
Source: World Bank (2010). http://data.worldbank.org/indicator.
ln gdpc Natural logarithm of GDP per capita, measured in 1990 international Geary‐Khamis dollars.
Sources: Maddison (2010), CIA (2011).
http://www.ggdc.net/MADDISON/oriindex.htm.
https://www.cia.gov/library/publications/the‐world‐factbook/.
ln inflation Natural logarithm of the rate of inflation.
Source: World Bank (2010).
http://data.worldbank.org/indicator.
marriage rate The marriage rate counts the number of marriages per 100,000 inhabitants in each country. In the cases of India, Pakistan, Morocco, and Nigeria, the marriage rates were calculated by relying on changes in the number of to‐
tally married people. Omitting these countries does not affect the validity of the reported results.
Sources: United Nations Statistical Yearbook (various issues)., United Nations (UN) Statistics Division. Demo‐
graphic and Social Statistics, Euromonitor International (2009). World Consumer Lifestyles Databook. Euromoni‐
tor Pub.
http://unstats.un.org/unsd/syb/.
http://unstats.un.org/unsd/demographic/default.htm.
misery Arithmetic average of unemployment rate and inflation.
political rights Index of political rights, here rescaled so that a higher value corresponds to a higher level of political rights.
Source: Freedom House (2010).
www.freedomhouse.org/template.cfm?page=439.
religiosity Index of the intensity of religion, compiled from 14 items of the WVS.
Source: Paldam and Gundlach (2010).
stability Joint measure of civil liberties and ln inflation, here estimated by first principal components.
unemployment Unemployment rate.
Sources: World Bank (2010), UN Statistics Division.
http://data.worldbank.org/indicator, http://unstats.un.org/unsd/syb/.
http://unstats.un.org/unsd/demographic/default.htm.
Alternative dependent variable
life satisfaction Measure of average national life satisfaction, generated by ordered probit regression with country fixed effects from individual answers to the World Values Survey question: ʺAll things considered, how satisfied are you with your life as a whole these days?ʺ
Source: Own calculations based on Stevenson and Wolfers (2008) and WVS data for 1982, 1990, 1995, 2000, and 2005.
Source: Authors’ compilation.