Deutsche Geodätische Kommission der Bayerischen Akademie der Wissenschaften
Reihe C Dissertationen Heft Nr. 766
Clémence Dubois
Interferometric Synthetic Aperture RADAR and Radargrammetry
towards the Categorization of Building Changes
München 2016
Verlag der Bayerischen Akademie der Wissenschaften in Kommission beim Verlag C. H. Beck
ISSN 0065-5325 ISBN 978-3-7696-5178-2
Deutsche Geodätische Kommission der Bayerischen Akademie der Wissenschaften
Reihe C Dissertationen Heft Nr. 766
Interferometric Synthetic Aperture RADAR and Radargrammetry
towards the Categorization of Building Changes
Zur Erlangung des akademischen Grades eines Doktor-Ingenieurs (Dr.-Ing.)
von der Fakultät für Bauingenieur-, Geo- und Umweltwissenschaften des Karlsruher Instituts für Technologie (KIT)
genehmigte Dissertation von
Dipl.-Ing. Clémence Dubois
aus Saint-Lô (Frankreich)
München 2016
Verlag der Bayerischen Akademie der Wissenschaften in Kommission beim Verlag C. H. Beck
ISSN 0065-5325 ISBN 978-3-7696-5178-2
Deutsche Geodätische Kommission
Alfons-Goppel-Straße 11 ! D – 80539 München
Telefon +49 – 89 – 230311113 ! Telefax +49 – 89 – 23031-1283 /-1100 e-mail hornik@dgfi.badw.de ! http://www.dgk.badw.de
Referent: Prof. Dr.-Ing. habil. Stefan Hinz
Institut für Photogrammetrie und Fernerkundung (IPF), Karlsruher Institut für Technologie (KIT)
Korreferent: Prof. Dr.-Ing. Uwe Sörgel
Institut für Geodäsie, Technische Universität Darmstadt Tag der mündlichen Prüfung: 11.11.2015
Diese Dissertation ist auf dem Server der Deutschen Geodätischen Kommission unter <http://dgk.badw.de/>
sowie auf dem Server des Karlsruher Instituts für Technologie unter
<http://digbib.ubka.uni-karlsruhe.de/volltexte/1000051736> elektronisch publiziert
© 2016 Deutsche Geodätische Kommission, München
Alle Rechte vorbehalten. Ohne Genehmigung der Herausgeber ist es auch nicht gestattet,
die Veröffentlichung oder Teile daraus auf photomechanischem Wege (Photokopie, Mikrokopie) zu vervielfältigen.
ISSN 0065-5325 ISBN 978-3-7696-5178-2
Ich erkläre hiermit, dass ich die vorliegende Arbeit selbständig verfasst, keine anderen als die angegebenen Quellen und Hilfsmittel benutzt, die wörtlich oder inhaltlich übernommenen Stellen als solche kenntlich gemacht und die Satzung des KIT zur Sicherung guter wissenschaftlicher Praxis in der jeweils gültigen Fassung beachtet habe.
Karlsruhe, den 15. Oktober 2015
v
Abstract
Change detection in urban areas plays an ever-growing role, be it for construction monitoring in urbanization projects, or for rapid damage assessment at building level after a natural disaster.
Remote sensing SAR data are particularly popular for this purpose, as they are deployable in- dependently of daylight and weather.
They present a particular advantage after an earthquake or a storm, where on-site visit is often limited or impossible.
The current generation of satellite SAR platforms such as TerraSAR-X, TanDEM-X and COSMO- SkyMed provides resolutions up to one meter, permitting the detailed analysis of urban areas, whilst covering large zones. Their specic orbital constellations enables, besides the acquisition of single images, the application of other SAR techniques relying on multiple image acquisition, such as SAR interferometry (InSAR) and radargrammetry. Compared to single image analysis, those methods oer the possibility of three-dimensional scene reconstruction, which is of high interest for the analysis of urban areas. InSAR uses the phase dierence between acquisitions taken from similar incidence angles, whereas radargrammetry relies on the amplitude disparity between images taken under dierent incidence angles.
The purpose of this work is the investigation of such techniques for fully automatic and rapid change detection analysis at building level. In particular, the benets and limitations of a com- plementary use of InSAR and radargrammetry in an emergency context are examined in term of quickness, globality and accuracy.
First, the potential of InSAR phase data for building detection and reconstruction is inspected.
Especially, focus is put on building layovers, arising due to the specic sensor geometry. Their particular appearance in interferometric SAR images permits the development of two dierent detectors, whose combined utilization in order to segment building candidates is investigated.
As sometimes more than one facade is visible for one particular building, a tool for dierencing adjoined facades is developed. Based on the extracted facade segments, an algorithm is presented that permits their reconstruction into geometrical shapes, from which building parameters are deduced straightforwardly.
Second, the suitability of radargrammetric data for building reconstruction and change detection
at building level is examined. To achieve this goal, data fusion is performed between interfero-
metric and radargrammetric datasets. It aims at the identication of corresponding buildings
and the transmission of building parameters for improving the robustness of the radargramme-
tric method. The developed radargrammetric approach intends to preserve linear structures, as
found at building locations. For this, modications of standard image matching approaches are
proposed and analyzed. The resulting appearance of buildings in the radargrammetric disparity
map is examined, leading to the recognition of specic geometrical shapes. The consideration of the statistical information and matching parameters permits the extraction of those shapes and the subsequent determination of the building parameters.
Based on the extracted building parameters from both techniques, a change detection approach is developed that aims not only at detecting where changes occurred, but also at giving an in- dication about its nature. Accordingly, several change categories and change parameters are introduced, and their relevance is investigated.
In this work, the analysis is restricted to isolated, rectangular shaped, middle-rise buildings with
at-roof, as found in many suburbs of metropoles. The eciency of the proposed methodology is
evaluated quantitatively and qualitatively for very high resolution TerraSAR-X and TanDEM-X
data of a construction site situated in the north-east of Paris.
vii
Kurzfassung
Die Änderungsdetektion im städtischen Gebiet spielt eine immer gröÿer werdende Rolle, sei es zum Monitoring des Fortschritts bei Neubauten oder Abrissen, für stadtplanerische Zwecke oder zur Schadensanalyse auf Gebäudeebene nach einer Katastrophe. Hierfür sind satellitengestützte SAR Daten besonders geeignet, da sie zu jeder Zeit und bei jedem Wetter eingesetzt werden können. Sie sind z.B. nach einem Erdbeben oder einem Sturm von Vorteil, da eine terrestrische Analyse durch Ortsbegehung oft nur sehr begrenzt möglich ist.
Neben der Möglichkeit einer groÿächigen Aufnahme erreicht die derzeitige Generation satelliten- gestützter Plattformen, wie z.B. TerraSAR-X, TanDEM-X und COSMO-SkyMed, Auösungen bis zu einem Meter, was die detaillierte Analyse städtischer Gebiete erleichtert. Neben Einzelbil- daufnahmen bieten ihre spezischen Konstellationen die Anwendung weiterer SAR-Techniken, die auf mehrfacher Szenenaufzeichnung beruhen, wie z.B. SAR Interferometrie (InSAR) und Radargrammetrie. Im Vergleich zur Einzelbildanalyse ermöglichen diese Methoden eine drei- dimensionale Szenenrekonstruktion, was für die Analyse städtischer Gebiete von besonderem Interesse ist. Bei InSAR wird vor allem die Phasendierenz zwischen zwei Aufnahmen mit ähn- lichem Einfallswinkel genutzt, während bei der Radargrammetrie der Amplitudenversatz zwis- chen zwei Aufnahmen unterschiedlicher Einfallswinkel analysiert wird.
Ziel dieser Arbeit ist die Erforschung solcher Techniken für eine vollautomatische und schnelle Änderungsdetektion auf Gebäudeebene. Insbesondere die Vorteile und Einschränkungen einer kombinierten Anwendung von InSAR und Radargrammetrie in einer Notsituation werden hin- sichtlich Schnelligkeit, Globalität und Genauigkeit untersucht.
Zuerst wird das Potenzial von InSAR-Phasen zur Gebäudedetektion und -rekonstruktion dargelegt.
Insbesondere Gebäude-Layover, die durch die spezische Sensorgeometrie entstehen, werden analysiert. Ihr besonderes Erscheinungsbild im interferometrischen Phasenbild ermöglicht die Entwicklung zweier unterschiedlicher Detektoren, deren kombinierte Verwendung zur Segmen- tierung von Gebäudehypothesen untersucht wird. Da zum Teil mehr als eine Fassade für ein bes- timmtes Gebäude erkennbar ist, wird zusätzlich eine Methode zur Dierenzierung angrenzender Fassaden vorgestellt. Basierend auf den extrahierten Fassadensegmenten wird ein Algorithmus entwickelt, der ihre Rekonstruktion in bekannte geometrische Formen durchführt, von denen wiederum Gebäudeparameter abgeleitet werden können.
Darüber hinaus wird die Eignung radargrammetrischer Daten für die Gebäuderekonstruktion
und Änderungsdetektion auf Gebäudeebene analysiert. Hierfür erfolgt eine Fusion zwischen in-
terferometrischem und radargrammetrischem Datensätzen, mit dem Ziel der Identikation von
Gebäudekorrespondenzen zwischen den Datensätzen und der Übertragung der Gebäudeparam-
eter zur Verbesserung der Robustheit der radargrammetrischen Methode sowie der späteren
Veränderungsanalyse. Der entwickelte radargrammetrische Ansatz beabsichtigt die Erhaltung linearer Strukturen, die an Gebäuden gefunden werden. Folglich werden übliche Bildmatch- ingsverfahren modiziert und ihr Beitrag analysiert. Das resultierende Erscheinungsbild von Gebäuden im radargrammetrischen Versatzbild wird interpretiert, was zur Erkennung spezi- scher geometrischer Formen führt. Die Berücksichtigung von statistischer Information und abgeleiteten Matching-Parametern ermöglicht die Extraktion dieser Formen und die darauol- gende Ermittlung der Gebäudeparameter.
Basierend auf den durch beide Techniken extrahierten Gebäudeparametern wird ein Ansatz zur Änderungsdetektion entwickelt, der nicht nur die einfache Detektion von Veränderungen anstrebt, sondern auch deren Art und Umfang beschreibt. Hierfür werden mehrere Veränderungsklassen und -parameter eingeführt, und ihre Relevanz wird untersucht.
In dieser Arbeit beschränkt sich die Analyse auf freistehende, rechteckige Gebäude mit einem
Flachdach, die eine mittlere Höhe von ungefähr zehn Stockwerken aufweisen und sich vermehrt
in Vororten von Groÿstädten benden. Die Ezienz der vorgestellten Methodik wird quan-
titativ und qualitativ für sehr hochaufgelöste TerraSAR-X und TanDEM-X Daten von einer
Groÿbaustelle im Nord-Osten von Paris bewertet.
ix
Résumé
Que ce soit à des ns d'auscultation de projets d'aménagement urbain, ou bien d'évaluation rapide des dégâts à l'échelle des bâtiments après une catastrophe naturelle, la détection de changements en milieu urbain joue un rôle de plus en plus important dans notre société. Les données de télédétection RSO sont particulièrement appréciées pour cette tâche, car elles peu- vent être employées indépendamment de la luminosité et du temps qu'il fait. Elles présentent un avantage notable à la suite d'un tremblement de terre ou d'une tempête, lorsque l'accès aux lieux est souvent limité, voire impossible.
Tout en permettant un grand champ de couverture, l'actuelle génération de plateformes satellites, telles que TerraSAR-X, TanDEM-X ou COSMO-SkyMed, atteint des résolutions allant jusqu'à un mètre, ce qui permet l'analyse détaillée des milieux urbains. Outre l'acquisition d'images simples, leurs constellations orbitales respectives favorisent l'application d'autres techniques de RSO utilisant l'acquisition d'images multiples, telles que l'interférométrie RSO (InSAR) ou la radargrammétrie. Par rapport à l'analyse d'images simples, ces méthodes orent la possibilité de reconstruire des scènes en trois dimensions, ce qui représente un grand intérêt pour l'analyse des zones urbaines. L'InSAR utilise principalement la diérence de phase entre deux images obtenues avec des angles de vue similaires, tandis que la radargrammétrie exploite la disparité entre deux images d'amplitudes obtenues avec des angles de vue diérents.
Le but de ce travail est l'investigation de telles techniques en vue d'une détection de changement rapide et totalement automatique à l'échelle des bâtiments. En particulier, les bénéces et lim- itations d'un usage combiné de l'INSAR et de la radargrammétrie dans un contexte d'urgence sont analysés en termes de rapidité, globalité et précision.
Dans un premier temps, le potentiel des images de phases InSAR pour détecter et reconstruire les bâtiments est examiné. En particulier, l'attention est portée sur les repliements de façade provenant de la géométrie spécique propre aux capteurs RSO. Leur apparence spécique dans les images de phase interférométriques incite au développement de deux détecteurs distincts, dont l'utilisation combinée est étudiée, an de segmenter des hypothèses de bâtiments. Comme parfois plus d'une façade est reconnaissable pour un bâtiment, un outil est développé perme- ttant la diérenciation de façades jouxtantes. Puis, un algorithme est implémenté permettant la reconstruction des segments en formes géométriques, à partir desquelles les paramètres des bâtiments peuvent être déduits de manière directe.
Dans un second temps, l'aptitude des données radargrammétriques à reconstruire les bâtiments
et détecter les changements est analysée. Une fusion des données interférométriques et radar-
grammétriques intervient, ayant pour but l'identication des buildings correspondants entre les
deux jeux de données et la transmission des paramètres de bâtiments. Cette dernière vise à la
fois l'amélioration de la robustesse de la méthode radargrammétrique et la détection ultérieure de changements. L'approche radargrammétrique développée prévoit la préservation des structures linéaires, comme on peut en trouver au niveau des bâtiments. Pour cela, diverses modications sont apportées à des approches usuelles de mise en correspondance d'images, et leurs bénéces examinés. L'apparence résultante des bâtiments dans l'image de disparité radargrammétrique est analysée, conduisant à la reconnaissance de formes géométriques spéciques. La considéra- tion des statistiques de l'image de disparité ainsi que des paramètres de mise en correspondance permet l'extraction de ces formes et la détermination consécutive des paramètres de bâtiments.
A partir des paramètres de bâtiments déterminés à l'aide des deux méthodes, une approche pour la détection de changement est développée, visant non seulement à détecter où les changements sont apparus, mais aussi à indiquer le type et un ordre de dimension du changement. Pour cela, diérentes catégories et paramètres de changement sont introduits, et leur pertinence est explorée.
Pour cette thèse, l'analyse est limitée à des bâtiments isolés, de forme rectangulaire et à toit
plat, ayant une hauteur moyenne d'environ dix étages. On trouve ce type de bâtiments aux pé-
riphéries de grandes villes. L'ecacité de la méthodologie proposée est évaluée quantitativement
et qualitativement pour des données TerraSAR-X et TanDEM-X très haute résolution, pour un
projet d'aménagement urbain situé dans la banlieue Nord-Est de Paris.
1
Contents
Abstract v
Kurzfassung vii
Résumé ix
1 Introduction 5
1.1 Problem Statement . . . . 6
1.2 State-of-the-Art . . . . 7
1.3 Contribution . . . . 12
1.4 Structure of the Thesis . . . . 14
2 SAR Principles 17 2.1 Real Aperture RADAR (RAR) . . . . 18
2.1.1 RAR Principles . . . . 18
2.1.2 RAR Wavelength . . . . 20
2.2 Synthetic Aperture RADAR (SAR) . . . . 20
2.2.1 SAR Azimuth Resolution . . . . 20
2.2.2 Pulse compression . . . . 22
2.2.3 SAR Image Data . . . . 23
2.2.4 Geometrical Image Distortion . . . . 24
2.2.5 SAR Acquisition Modes . . . . 26
2.2.6 Special SAR Techniques . . . . 27
2.2.7 SAR Systems . . . . 29
2.3 Interferometric SAR (InSAR) . . . . 29
2.3.1 InSAR Principle . . . . 30
2.3.2 InSAR Phase . . . . 31
2.3.3 InSAR Coherence . . . . 32
2.3.4 InSAR Height . . . . 32
2.3.5 InSAR Congurations . . . . 33
2.3.6 The TanDEM-X System . . . . 36
2.4 Radargrammetry . . . . 37
2.4.1 SAR Stereo Principle . . . . 37
2.4.2 Matching . . . . 37
2.4.3 Acquisition Congurations . . . . 40
2.4.4 RADAR Stereo Model . . . . 43
3 Extraction of Building Parameters from InSAR Data 47 3.1 Appearance of Buildings in InSAR Data . . . . 47
3.2 State-of-the-Art . . . . 50
3.3 Overall InSAR Workow for Building Extraction . . . . 52
3.4 Building Detection . . . . 54
3.4.1 Phase Ramp Detector . . . . 54
3.4.2 Constant Phase Detector . . . . 56
3.4.3 Parameter Setting . . . . 57
3.4.4 Fusion of Detectors . . . . 58
3.5 Facade Recognition . . . . 65
3.5.1 Ridge Detection . . . . 65
3.5.2 Fringe Orientation Analysis . . . . 67
3.5.3 Combination . . . . 69
3.6 Building Reconstruction . . . . 70
3.6.1 Parallelogram Fitting . . . . 70
3.6.2 Phase Analysis and Filtering . . . . 72
3.6.3 Special Cases . . . . 73
3.7 Conclusion . . . . 74
4 Radargrammetric Building Detection and Extraction 75 4.1 Appearance of Buildings in Radargrammetric Data . . . . 75
4.2 State-of-the-Art . . . . 77
4.3 Overall Radargrammetric Workow . . . . 79
4.4 Radargrammetric Pre-Processing . . . . 80
4.4.1 Calibration . . . . 81
4.4.2 Coregistration . . . . 81
4.5 Matching . . . . 84
4.5.1 Matching Method . . . . 84
4.5.2 Improved Matching . . . . 85
4.5.3 Constraints . . . . 89
4.6 Building Extraction . . . . 92
4.6.1 Facade Signature in the Disparity Map . . . . 92
4.6.2 Facade Extraction . . . . 93
4.6.3 Filtering and Estimation of Facade Parameter . . . . 97
4.7 Conclusion . . . . 98
5 Fusion of InSAR and Radargrammetry 99 5.1 Geometrical Matching . . . . 99
5.1.1 From Interferometric to Radargrammetric Geometry . . . . 100
5.1.2 Transformation of the Building Parameters . . . . 103
5.2 Change Detection Rules . . . . 105
5.2.1 Possible changes . . . . 106
Contents 3
5.2.2 Bayes' Rule . . . . 108
5.3 Conclusion . . . . 112
6 Results and Evaluation 113 6.1 Test Area . . . . 113
6.1.1 Test Site . . . . 113
6.1.2 Interferometric Data . . . . 117
6.1.3 Radargrammetric Data . . . . 120
6.1.4 Reference Data . . . . 122
6.2 Results of Interferometric Processing . . . . 124
6.2.1 Parameter Setting of the Detectors . . . . 124
6.2.2 Results of Layover Extraction . . . . 129
6.2.3 Results of Building Parameter Determination . . . . 132
6.3 Results of Radargrammetric Processing . . . . 135
6.3.1 Accuracy of the Coregistration with SAR-SIFT . . . . 135
6.3.2 Parameter Setting for the Disparity Map Calculation . . . . 137
6.3.3 Results of Building Parameter Determination . . . . 139
6.4 Results of Change Detection . . . . 142
6.4.1 Determination of the Bayes' Parameters . . . . 142
6.4.2 Results of Change Detection . . . . 145
6.5 Discussion and Conclusion . . . . 149
7 Conclusion and Outlook 153
Bibliography 157
Acknowledgments 169
5
1
Introduction
In recent years, the number of spaceborne Synthetic Aperture RADAR (SAR) systems increased signicantly. Nowadays, most of the developed countries possess their own SAR satellite and developing countries cooperate in order to create evermore performing platforms. Concurrently, the technical developments undergo a rapid evolution. Each new SAR satellite or satellite con- stellation addresses new requirements in terms of resolution, scale of acquisition, conguration, autonomy and/or revisit time.
Especially due to their weather and daylight independence, spaceborne SAR systems permit scene acquisition under most dicult conditions, where optical or airborne systems reach their limits (e.g., cloud coverage, night, stormy weather). Such characteristics make them very attractive in cases of natural disasters, where rapid response is required. Dierent available resolutions and coverages additionally permit a wide range of applications. Low resolution and large coverage is preferred for ood analysis in rural areas, where the knowledge of the total extent of the damage is more important that the exact boundaries of the water line. Higher resolution is required as soon as detailed and local description is necessary. Current spaceborne missions achieve very high resolutions under 1 m. Obviously, with such products, the study of man-made structures is possible. In particular, a detailed analysis of urban areas after an earthquake or a cyclone provides useful information for the local authorities and international emergency organizations.
Knowledge about the current state of buildings is not only mandatory for nding possible vic- tims, but also necessary for estimating which roads are still passable or which buildings could be used as transitional shelter.
The topic of rapid mapping and change detection in urban areas by use of SAR data has been addressed already by several approaches. Many of them deal with change detection at large scale, e.g. at city level, using lower resolution data. The availability of high resolution data since a few years pushes the development of approaches for ner scale analysis, e.g. at building level.
Yet, one main challenge those approaches are confronted to is their global applicability, without any external data. Indeed, often no preliminary (pre-event) data exist, and fast change analysis is performed with a single, post-event, SAR image, combined to pre-event ancillary information.
This work ts into the topic of rapid mapping and change detection in urban areas using exclu-
sively SAR data and aims at overcoming the lack of data or information for the scene of interest
whilst permitting a global applicability of the developed approach and a ne scale analysis of the buildings.
1.1 Problem Statement
One crucial element when speaking about rapid mapping is the time component. After a nat- ural disaster (later referred to as event) occurred, emergency response is required. Information about the extent and the kind of the damage, as well as logistic information, should be available rapidly. Current spaceborne SAR missions allow the fast observation and scene acquisition of every point on Earth in a short time interval, independently from daytime and weather condition.
Yet, depending on the applied technique and used sensors, the response time and accuracy can vary signicantly. It is therefore important to choose the most suitable system.
Particularly sensitive and challenging are urban areas, which present high people density and should provide rapid logistic solutions for nding and oering shelter to potential victims. An important migration of population from rural to urban areas is observable since over half of a cen- tury, principally for work, but also for health, cultural, social or economical reasons. This leads to a signicant urbanization, especially in the city outskirts, where buildings capable of lodging hundreds of families grow very rapidly since the 1970s. Such areas are particularly sensitive in case of a natural disaster. Namely, the buildings are often old and not built for countering such catastrophes. Furthermore, many families are living in such buildings, inducing high fatalities in case of collapse. Finally, they are usually located near main access roads to the city centers, and their collapse could induce a total obstruction of the city entrances for rescue teams. Hence, changes should preferably be modeled at building level, in order to facilitate the logistic decision making. In this work, a methodology is developed that allows to distinguish individual buildings and determine their state of damage.
To this end, three main questions arise:
• Which SAR system(s) and technique(s) enable(s) a rapid and global application?
The main limitation of change detection analysis is the poor availability of pre-event data, due to the unpredictable occurrence of an event. This work addresses accurate pre-event techniques that can be applied globally and post-event techniques that permit a fast re- sponse.
• How do buildings look like, using the chosen technique(s)?
Considering the chosen techniques, it is necessary to analyze and understand the appear- ance of buildings in the resulting SAR images. This enables to estimate the accuracy to which the building analysis is possible, and to extract and compare individual buildings in order to perform change detection.
• Is it possible to detect changes at building level with respect to the applied technique(s)?
Depending on the accuracy of the chosen techniques and the precision of the subsequent
building recognition and extraction, change detection analysis can be performed to a specic
level of detail. This work addresses the capacity of the chosen techniques and applied
1.2. State-of-the-Art 7 methodology to detect and categorize changes at building level, e.g. if it is still standing or if part of it is destructed and, for the later case, to which approximate amount.
This work addresses and answers those questions, discussing qualitatively and quantitatively the advantages of the chosen techniques and methodology, and their limitations.
1.2 State-of-the-Art
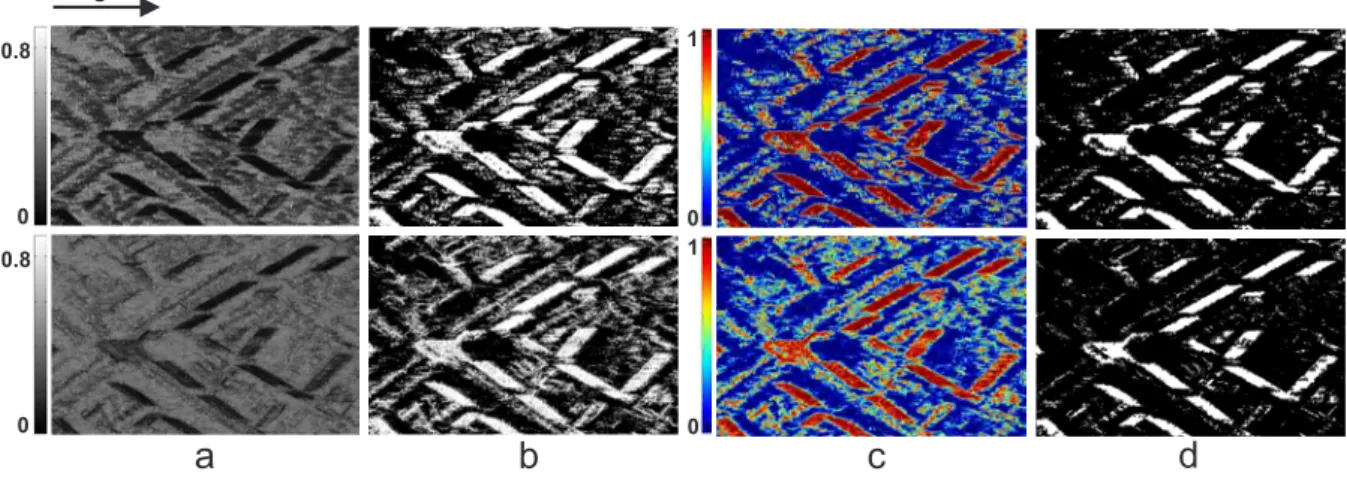
SAR image interpretation is highly related to the desired application. Depending on the chosen mode of acquisition, the appearance of SAR images varies a lot and multiple complementary information can be extracted. Figure 1.1 shows a sample of SAR images acquired under dierent illumination conditions and acquisition techniques. Amplitude-based image interpretation relies on the statistical analysis of the backscattering intensity. This allows to dene specic texture characteristics for dierent objects in the scene, leading to subsequent classication or feature extraction. The result highly depends on the sensor resolution. A similar interpretation can be performed using polarimetric data, where object characteristics are dened with respect to their interaction with the emitted signal (Figure 1.1a). In order to fulll the information and enhance feature extraction, images taken from dierent directions of acquisition (multi-aspect data) can be used (Figure 1.1b). The directions of acquisition are marked with the yellow arrows. In other cases, additional information coming from the combination of two images taken under the same viewing geometry can be used to enhance or replace the amplitude-based interpretation (Figure 1.1c). Using the coherence between two images, similar analysis of the coherence values can be performed as with the intensity, leading to the classication of temporally stable or unstable objects. Moreover, the analysis of the phase dierence between two images taken under the same illumination conditions give additional information about the topography of the scene, permitting its 3D interpretation.
Dierent approaches have been developed in the last decade that permit automatic change de- tection in urban areas using the SAR technology. One of the main problem is the suciency of pre-event data, as most of the natural disasters are not predictable. Therefore, several ap- proaches deal with the fusion of pre-event optical or GIS data and post-event SAR data. Due to the permanent development of the SAR systems, low resolution SAR images are available for the pre-event analysis of most areas since a few years. The post-event analysis is mostly performed using a single SAR image, in order to furnish a rapid response.
The existing approaches not only dier in the kind of data used for the change analysis, but also in the level of detail of the damage assessment. Whereas many methods produce maps of entire areas or cities with an indication of the districts that underwent the most damages, only few methods perform analysis at building level.
An exhaustive review of existing approaches for damage detection in urban areas using dierent
kinds of data is presented in (Dong & Shan 2013). In the following, the existing approaches
using SAR data are categorized, considering if they rely only on SAR data or use additional
information.
42°, descending 36°, ascending
a
b
c
Figure 1.1:
Aspect of SAR data under different acquisition modes; (a) optical (source: Bing Maps), amplitude and color-coded polarimetric data (source: JPL-NASA, AIRSAR); (b) optical image (source: Bing Maps) and amplitude images of multi-aspect data; (c) optical image (source: Bing Maps), interferometric (InSAR) intensity, coherence and phase
Damage assessment using external ancillary data
In (Mansouri et al. 2007), a GIS layer containing building footprints and heights is used for analyzing four multi-aspect post-event Envisat ASAR images of Tehran, Iran. After georefer- encing, dierent statistical features of the SAR images, such as coherence and backscattering intensity, are analyzed at the building edges and corner locations, permitting to detect changes at parcel level due to the low resolution of the data. In (Liu et al. 2012), building footprints are manually extracted from GIS data and changes of backscattering intensity are detected within the extracted footprints. In (Trianni & Gamba 2008), pre- and post-event ALOS/PALSAR data are acquired and change detection performed by classication of extracted features such as co- herence loss and intensity changes. The pixel-based damage assessment is merged in order to provide a parcel level damage information, using parcel border information from GIS data. Such approaches provide satisfying results. However, due to the resolution of the data, they often do not allow to detect changes at building level. Additionally, they rely on the availability of GIS information for the area of interest, which is not always ensured, particularly in remote areas where natural disasters occur.
To overcome this lack of data, some authors propose the combined use of dierent sensors for
assessing changes. In (Butenuth et al. 2011), the authors propose a combined use of optical, SAR
1.2. State-of-the-Art 9 and DEM information into a general damage assessment system, detecting road infrastructures after ooding. (Chini et al. 2013) use optical, thermal and SAR data for analyzing the ood- ing after the 2011 Japan Tsunami. The adaptability of those approaches for buildings damage detection after destruction still has to be proved, as the occlusion eects are very dierent. In (Chini et al. 2009), the authors use multiple sensors in order to give damage information at sev- eral levels. Change detection at building level is performed using pre- and post-event very high resolution optical imagery whereas change detection at district level is carried out with lower resolution SAR imagery from Envisat ASAR. Furthermore, the authors analyze the behavior of a change criterion dened with the pre- and post-event SAR images using a building mask created with optical data. High correlation between the dierent building classes and the variation of the criterion is observed, proving the complementarity of optical and SAR data. In (Dell'Acqua et al. 2011), the authors also use optical data for building damage assessment at pixel level and SAR data for damage assessment at district level. For the latter, the area is divided into several districts, and a damaged area ratio` is created and thresholded by analyzing several texture parameters derivable from amplitude SAR data, such as variance, mean and entropy. Similarly, (Upret & Yamazak 2012) use two TerraSAR-X images of the pre- and post-event, taken under same viewing geometry, and analyze the dierence of backscattering coecient and the loss of correlation between both images. Based on the dierent values, thresholds corresponding to dif- ferent building states are dened. Those are assessed using building footprints digitalized from a post-event optical image. In (Dong et al. 2011), the authors draw building footprints on pre-event Quickbird images, and analyze the behavior of the RADAR backscattering coecient of a post- event TerraSAR-X image within the dened footprints. Three classes are dened a posteriori:
undamaged, semi collapsed and totally collapsed. Thresholding the backscattering coecient on other areas or using further images enables the determination of potentially damaged buildings.
In (Stramondo et al. 2006), the authors propose a complementary use of optical and SAR data for district level damage assessment. After a coregistration and resampling of the optical images to the resolution of the SAR images, dierent feature vectors are dened, using SAR complex coherence and intensity as well as optical indexes as NDVI and pixel-to-pixel dierence. Several combinations of the determined indexes are analyzed, showing that the combination of optical and SAR data provide better change detection accuracy than their separate use. In (Brunner et al. 2010), a method is proposed that fuses pre-event very high resolution optical imagery with post-event high resolution SAR imagery in order to detect changes at building level. First, relevant building parameters are extracted manually from very high resolution optical images.
Those parameters are then used for simulating the building appearance in SAR images. Finally, the simulated building is compared to real post-event SAR imagery and a similarity criterion is calculated using mutual information. The change decision is performed using Bayes' rule for distinguishing two classes: damaged and undamaged. This approach shows good results, yet the framework could be improved using automatic building extraction methods. A similar approach has been developed in (Wang & Jin 2012), dening three building classes: collapsed, subsided and deformed.
It is obvious that the use of complementary information in the form of optical and SAR imagery
is feasible for obtaining detailed damage information whilst permitting a rapid application. Until
less than a decade ago, the resolution of spaceborne sensors did not permit a detailed analysis
at building level using only SAR data. Optical images allowed to understand the backscattering behavior of SAR images at building location, and derive some thresholds for damage classica- tion. The approaches presented previously reveal yet two main drawbacks. First, if pre- and post-event SAR data are available, both must be acquired under the same incidence angle in order to analyze the correlation and dierence of intensities. Second, only two or three damage classes are derivable, all giving only a rough, scattered-based, information about the building state. However, the use of new spaceborne sensors like TerraSAR-X or COSMO-Skymed, which allow very high resolution, permits a more detailed analysis of the changes. It should be possible to dene the amount of the change, and give some information about the planimetric and alti- metric extent of the change. For this, a simple analysis of the backscattering coecient is not enough, and feature based approaches should be envisaged.
The presented approaches using simulated data go in this direction. However, more advanced simulation approaches can be applied that take into account speckle noise and surroundings, as presented in (Auer et al. 2011b). Such a method is used in (Tao et al. 2011), whereby both optical and SAR simulations are performed based on a LIDAR derived DEM in order to facilitate the visual interpretation of SAR data. A further development leads to the simulation of whole city areas under dierent incidence angles (Tao et al. 2013). This approach relies on the principle that the available SAR images before and directly after an event may not have been acquired under the same incidence angle. In order to detect changes, the simulation has to represent buildings as they appear in the post-event SAR image. Based on the LIDAR DEM, the scene is simulated and dierent masks can be created. This approach focuses only on the analysis of layover areas, created by building walls. A pixel-based analysis between simulated and real post-event layover areas enables the detection of changes at building level. The originality of this approach is that it is not necessary to have SAR images acquired under the same incidence angle for pre- and post-event analysis, allowing a faster response. Yet, it requires the availability of an accurate DEM of the scene of interest, which is, in most of the cases, not available.
Damage assessment using only SAR data
Approaches relying only on SAR data can be applied in remote areas, where no other kind of information, or bad optical information is available.
In (Balz & Liao 2010), the authors analyze the appearance of damaged buildings in multiple
post-event high resolution SAR amplitude images. Dierent levels of damage are analyzed theo-
retically, simulated and detected manually on diverse real amplitude images. The relevance of
using multiple viewing geometries to recognize the damages is shown. This approach provides a
good description of the appearance of damaged buildings in amplitude SAR data, but still has
to be automatized. Similar works are presented in (Shinozuka et al. 2000, Wang et al. 2009). In
(Kuny & Schulz 2014), the authors present an extension of the previous approach by simulating
heaps of debris. Simulated SAR data are trained considering several texture features, and heaps
of debris are subsequently detected automatically in real SAR data. This method shows good
results in terms of completeness of the extraction, however, many other objects like trees are also
classied as heaps of debris due to their similar signature. Further texture features should be
dened in order to diminish the false alarm rate. The drawback of methods based on simulations
is the quantity of possible appearances a building and a damaged building can take, which should
all be modeled in order to detect every possible change.
1.2. State-of-the-Art 11 The methods using only SAR data and no simulation can be grouped into amplitude driven methods and phase driven methods, whereby some approaches use the full information content of the SAR or InSAR images.
The amplitude driven methods typically use the backscattering coecent and intensity correla- tion between one pre-event and one post-event SAR image, both taken under the same view- ing geometry. In damaged areas, the intensity correlation becomes lower and the dierence of backscattering coecient between pre- and post-event increases (Matsuoka & Yamazaki 2004).
At building level, additional features can be considered. In (Guida et al. 2010) and (Brett &
Guida 2013), the authors propose to extract double-bounces corresponding to building footprints in one pre-event SAR amplitude image. A double-bounce mask is created. Additionally, the ratio of the pre-event with one post-event amplitude image taken under the same viewing conditions is built. The ratio image is multiplied with the double-bounce mask. Double-bounce lines show- ing a high ratio are classied as damaged buildings. In (Polli et al. 2010), the authors attempt to classify damaged urban areas using only post-event amplitude imagery of COSMO-Skymed.
There, dierent textures are dened and analyzed in groups of pixels, trying to dierentiate several damage levels. Better performance of this method is shown using block analysis at lower resolution SAR images (Cossu et al. 2012), as it suers less of inuence of small objects.
The phase driven methods exploit the loss of phase coherence between interferometric image pairs of pre- and post-event. In (Ito et al. 2000), multi-temporal interferograms are used, using SAR images acquired before and after the event. Several combinations of the images are used, providing dierent coherence information. Image pairs acquired before the event provide a pre- event coherence, and co-seismic coherence is estimated using one pre-event and one post-event image. Damaged areas corresponding to a coherence loss between the pre-event and co-seismic interferograms are classied using neural networks. A similar damage assessment is performed in (Homann 2007). In (Bignami et al. 2004), a coherence based damage classication of urban areas is performed, showing high correlation with damage assessment derived from optical data.
A few methods use both amplitude and phase information. In (Matsuoka & Yamazaki 2000), the intensity dierence, the intensity correlation and the coherence dierence between pre- and post-event interferograms are analyzed, showing that the coherence is suitable for categorizing dierent degrees of damages. A similar approach is presented in (Yonezawa & Takeuchi 2001), showing that damages at building level inuence the backscattering characteristics of the sig- nal and induce a decorrelation between pre- and post-event data. In general, the amplitude information is used for determining areas where potential changes occurred, and phase coher- ence information is used to assess and specify the changes (Arciniegas et al. 2007, Yonezawa et al. 2002).
Another approach relying on the analysis of polarisation changes between pre- and post-event
is presented in (Singh et al. 2013). It shows good results using low resolution SAR images for
detecting damaged areas, and should be tested on higher resolution images for detecting single
damaged buildings. However, due to the higher level of detail at higher resolution, the robustness
of the classier towards other objects and infrastructures should be tested.
Limitations of current approaches
In general, approaches relying only on SAR data for change detection assess the damages at a block or district level, classifying the backscattering characteristics and features calculated from the image statistics. Partly due to the lower resolution of the imagery provided by the chosen sensors, only few approaches perform damage assessment at building level. All presented approaches rely on pixel-based methods, or use external information in order to simulate and quantify the change in terms of building extent and dimension. However, no approach species the amount of the change in terms of building height and planimetric dimension.
In this work, it is attempted to use a feature based method, permitting to quantify planimetric and height changes at building level. Besides, no external information is used or simulation performed, but the building parameters are estimated using pre- and post-event SAR data only.
For this, not only a rapid technique for post-even analysis is looked for, but also a method permitting a global and accurate estimation of the pre-event state is addressed.
1.3 Contribution
The existing approaches use either external (e.g. optical, LIDAR) or only locally available (e.g.
single SAR image, GIS data) pre-event data. Such data are often not up-to-date and sometimes show lower resolutions or bad quality. Therefore, they are dicult to interpret for building level analysis. The approach developed in this work attends to overcome this lack by using global SAR data provided by the current tandem mission of the German Aerospace Center (DLR). This mission aims at creating a global DEM of the Earth using the principle of SAR interferometry with the two satellites TanDEM-X and TerraSAR-X ying on parallel orbits. To this goal, in- terferometric data are acquired worldwide, providing a global coverage.
For post-event analysis with SAR data, most approaches use either a single SAR amplitude im- age or an interferometric phase image. The use of a single SAR image presents the advantage of a very short time of acquisition after an event. However, it suers from the poor information content due to the single aspect. Occlusions occur, which hinder a good building recognition and reconstruction. Furthermore, the height information can only be derived based on the 2D measurement of characteristic image shapes, which in turn can suer from occlusion eects. The approaches using interferometry seem to be a good compromise, as the elevation information can be deduced directly using the phase values of the interferogram. Such approaches rely mainly on the change of coherence in order to detect areas where changes occurred. However, due to the loss of coherence after an event, the phase information cannot be evaluated anymore, and elevation retrieval is usually impossible. The tandem mission may allow a more coherent interferometric acquisition due to a single-pass of the satellites above the scene of interest, but when this mission will nish, the only possibility for spaceborne interferometry will be repeat-pass acquisitions of the same sensor, inducing additional noise due to time decorrelation. In this work, a new so- lution for post-event analysis is investigated, allowing to retrieve height information under non coherent conditions, whilst using acquisitions taken within a short time span. Radargrammetric data, i.e. at least two images taken from dierent incidence angles, are used, and their amplitude information is treated similar to the optical stereoscopy in order to retrieve height information.
With such data, incoherent 3D change detection can be performed.
1.3. Contribution 13 In this work, pre-event interferometric and post-event radargrammetric SAR data are used in order to detect and extract buildings. The determined building parameters from both methods are then compared in order to detect and quantify the changes.
Considering the pre-event data, an automatic processing chain is developed in order to detect and extract buildings from interferometric SAR data. Based on existing building detectors using the phase image, a new detector is created. A new algorithm for building extraction is subsequently introduced, combining information coming from the building detection step and geometrical shape considerations. The building detection rate and correctness of the extracted building pa- rameter are analyzed thoroughly, and the robustness of the extraction is shown.
For the post-event analysis, a new fully automatic processing chain for radargrammetric data is developed. Contrary to most existing feature-based approaches for building extraction by radargrammetry, this work relies on a pixel-based approach, combining recent knowledge on SAR image matching and methods coming from the optical stereoscopy. A recent approach for SAR image matching is used for automatic image coregistration, and methods for improving the image matching such as a pyramidal approach and backmatching are adapted to SAR image processing. Based on the developed algorithm, a thorough analysis of the building appearance in radargrammetric SAR data is conducted, permitting to derive a methodology for extracting building and change parameters. Furthermore, a new relative height calculation is introduced, taking into account the angle dierence on the ground between two SAR acquisitions. A detailed analysis of the performance and limitations of the developed methodology considering dierent acquisition congurations is performed, dening requirements for future SAR missions.
Finally, a new fusion strategy involving building parameters deduced from interferometric and radargrammetric SAR data is developed in this work. The data fusion occurs at dierent levels of the methodology. First, information deduced from the interferometric processing is transmitted directly to the radargrammetric processing. It introduces some constraints that allow to improve the radargrammetric processing in terms of accuracy and time. Second, the deduced building parameters from both processing chains are brought together in a rule system permitting to evaluate the probability and the amount of a change.
In conclusion, the main contributions of this work can be resumed in the following points:
• an investigation of the combined use of pre-event interferometric and post-event radar- grammetric SAR data,
• a new algorithm for building detection and extraction using interferometric SAR data,
• a new methodology for building detection and extraction using radargrammetric SAR data,
• a thorough analysis of the dierent acquisition parameters and congurations, allowing to dene requirements for future SAR missions, and
• an original change detection strategy, allowing fast response under non coherent conditions
whilst preserving height information.
PRE-EVENT POST-EVENT
Data Acquisition Data Acquisition
Interferometric Processing
Radargrammetric Processing
Fusion Change
Detection
t t + 3 days
Figure 1.2:
Concept of this work: pre-event interferometric data and post-event radargrammetric data are fused in order to detect changes in urban areas within a short timespan (maximum 3 days) after an event
In this work, the focus is put on middle-rise rectangular shaped buildings with at roofs, mostly isolated from the surroundings, as can be found in many city outskirts. A few examples of such buildings are shown Figure 1.2.
1.4 Structure of the Thesis
The concept of this work is depicted in Figure 1.2, showing the overall structure of the thesis.
Building parameters are extracted for the pre-event analysis from interferometric data. These are used for the radargrammetric processing in order to improve the robustness and limit processing time for the post-event analysis. New building parameters are deduced from the radargrammetric processing. Both sets of parameters are then fused in a rule system in order to detect changes.
Chapter 2 recalls the principles of the synthetic aperture RADAR (SAR) and highlights in more details the two SAR techniques employed in this work: SAR interferometry and SAR radargram- metry.
Chapter 3 describes the pre-event interferometric analysis. The building appearance in interfe- rometric SAR data is reviewed, leading to the description of the overall interferometric workow for building detection and extraction developed in this work. The new building detector is in- troduced, and the dierent processing steps are specied. The determination of the pre-event building parameters follows subsequently.
Chapter 4 is the equivalent of Chapter 3 for post-event radargrammetric data. First, the dierent building appearances in the amplitude images resulting from the dierent incidence angles are analyzed. Then, the new methodology for performing stereoscopy on SAR images is described step-by-step. It is explained at which step the pre-event building parameters can be considered in order to restrain the processing time and improve the robustness of the algorithm. Finally, new building parameters are extracted, corresponding to the post-event state.
Chapter 5 comprises the fusion of interferometric and radargrammetric data. First, the geo-
metrical aspect is explained, describing how the pre-event building parameters are transformed
for being used as constraint during radargrammetric processing. Second, the change detection
1.4. Structure of the Thesis 15 approach, using extracted pre- and post-event building parameters, is described, nally leading to the dierent considered changes.
Chapter 6 shows the suitability of the developed methodology by means of an application exam- ple. The test site and acquired data are described, and results of the dierent processing steps are shown. A thorough evaluation using dierent acquisition parameters is performed, and the obtained results are discussed and compared to reference data.
A nal discussion and outlook of this work are given in Chapter 7.
17
2
SAR Principles
The wide eld of remote sensing can be divided into two main sensing strategies: passive and active. Passive systems record the radiation reected or emitted by an object. In optical imagery, the object is illuminated by the sun or other illumination sources. The optical sensor records the reected light on the object surface. In thermal imagery, the object specic thermal emission is recorded. Active systems, on the contrary, have their own illumination source. They emit radiations that are reected by an object. The system records the part of the reection that is returned towards the sensor. For example, active sonar systems emit a sound whose return time indicates the distance of a detected object. In airborne and spaceborne remote sensing, most sensors use electromagnetic radiation as emission source. For example, LIDAR emits laser pulses that are reected by the object. The resulting product represents the distance between sensor and object, determined by the speed of light and the time needed by the emitted pulse to return to the sensor. Whereas LIDAR systems use the optical domain of the electromagnetic spectrum, RADAR systems work in the microwave domain, with wavelengths varying from a few millimeters to about one meter.
Due to their active mode of measurement, RADAR systems are very attractive for night mea- surements. Indeed, they need no sun or other illumination source. Moreover, they can acquire data even by dense cloud coverage, as their long wavelength is aected only to a limited extent by the atmospheric conditions.
In this chapter, basics on RADAR are rst recalled (Section 2.1). Then, the SAR principle
is introduced and the dierent acquisition modes are presented (Section 2.2). Afterwards, the
INSAR principle is explained and the current spaceborne constellation TanDEM-X is introduced
(Section 2.3). The last section gives an exhaustive presentation of the radargrammetric principle
(Section 2.4).
β
Aθ
Ground Range Slant Range
Azimuth
R H
Figure 2.1:
Geometry of a Real Aperture RADAR - RAR
2.1 Real Aperture RADAR (RAR)
RADAR is an acronym for Radio Detection And Ranging and is a range measuring method based on the emission and the time-delayed reception of an electromagnetic signal in the microwave domain. In the following, real aperture RADAR (RAR) is explained, before presenting the advantages of a synthetic aperture RADAR (SAR) in Section 2.2.
2.1.1 RAR Principles
Figure 2.1 shows the principle of acquisition of a real aperture RADAR. The azimuth direction`
corresponds to the ight path of the sensor. The perpendicular direction corresponds to the
beam direction of the sensor. It is called range direction` in the following, as it is the direction
of measurement of the sensor-object distance. It has to be distinguished between slant range
direction, which corresponds to the line-of-sight of the sensor, and ground range direction, which
is its projection on a reference surface. First, the sensor emits a signal towards the scene. Second,
the signal is reected by the illuminated objects. Depending on the reection characteristics of
the material and the orientation of the considered object, the signal is either partially reected
towards the sensor (diuse reection) or totally reected (specular reection). The latter induces
either that no signal comes back to the sensor (e.g., on very smooth surfaces, like calm water or
oil) or that all the signal comes back to the sensor (e.g., specic material or succession of specular
reections bringing the signal back to its origin). The received signal is recorded, processed,
and transformed into an image. The runtime of the signal between emission and reception is
analyzed, leading to the distance between the illuminated object and the RAR system. An
exhaustive explanation of the signal processing is given in Section 2.2.2, for SAR images. The
resulting 2D image is complex and each pixel has two values, representing the real (in-phase)
and imaginary (quadrature) part of the signal. Using angular functions, they can be related to
2.1. Real Aperture RADAR (RAR) 19 the amplitude of the reection and to the phase of the received radiation. The latter contains information about the sensor-object distance with an ambiguity corresponding to the number of full wavelengths between sensor and object. The run-time of the signal for two objects situated at the same distance of the sensor is the same. Thus, both objects are mapped at the same position in the resulting 2D image and it is impossible to discern them.
With perspective nadir geometry, as for optical sensors, it would be impossible to represent separately objects situated at the same distance but on dierent sides of the sensor. The side- looking geometry of RAR systems avoids this problem, as the beam is oriented in slant direction.
In the nal 2D images, objects are represented from near range to far range, in slant geometry.
The geometrical resolution corresponds to the minimal distance between two objects, such that they can still be distinguished from each other. For RAR systems, the geometrical resolution is usually dierent in range and in azimuth direction. The range resolution depends on the duration τ of the transmitted pulse, as well as on its speed, i.e. the speed of light c (Klausing &
Holpp 2000):
ρ
SR= cτ
2 , whereby τ ≈ 1
B . (2.1)
The pulse duration τ can be expressed in function of the bandwidth B of the emitted frequency modulated signal, referred in Section 2.2.2 as chirp. In ground range direction, it additionally depends on the incidence angle θ :
ρ
GR= cτ
2 sin θ . (2.2)
Using shorter τ improves the range resolution. However, using too short pulses would yield a too weak signal power and deteriorate the signal-to-noise ratio. Yet, using pulse compression and matched ltering (Section 2.2.2) allows to obtain high resolution by maintaining low noise level.
By reducing the incidence angle θ , the ground range resolution becomes large. The critical point is achieved when θ = 0 , i.e. by nadir illumination. The ground range resolution goes innite, and all illuminated objects within the beam would be mapped within the same range cell. This is why the main characteristic of a RAR system is its side-looking geometry.
The azimuth resolution ρ
ARARdepends on the angular spread β
Aof the signal - β
A=
LλA
-, whereby λ is the signal wavelength and L
Ais the length of the antenna in azimuth direction. It is expressed as:
ρ
ARAR= Rβ
A= Rλ
L
A, (2.3)
whereby R is the slant distance between sensor and object. Two ground objects situated at the same distance R from the sensor can only be distinguished if they are not within the same beam.
Considering Equation (2.3) , it is obvious that the azimuth resolution ρ
Adepends highly on the
range R between sensor and object. Increased ranges lead to poorer resolution. In order to
enhance the resolution, shorter wavelengths λ could be used. However, they are more sensitive
to atmospheric attenuation. The use of a longer antennas (i.e. increased L
A) would also improve
ρ
ARAR, but it is subject to technical and material limitations. Longer antennas need very high
transmission power, and are very heavy to deploy on a satellite platform. Instead of dealing
with a real, long antenna, the creation of a synthetic longer antenna is possible, and led to the
development of SAR sensors, which permit the achievement of a better azimuth resolution.
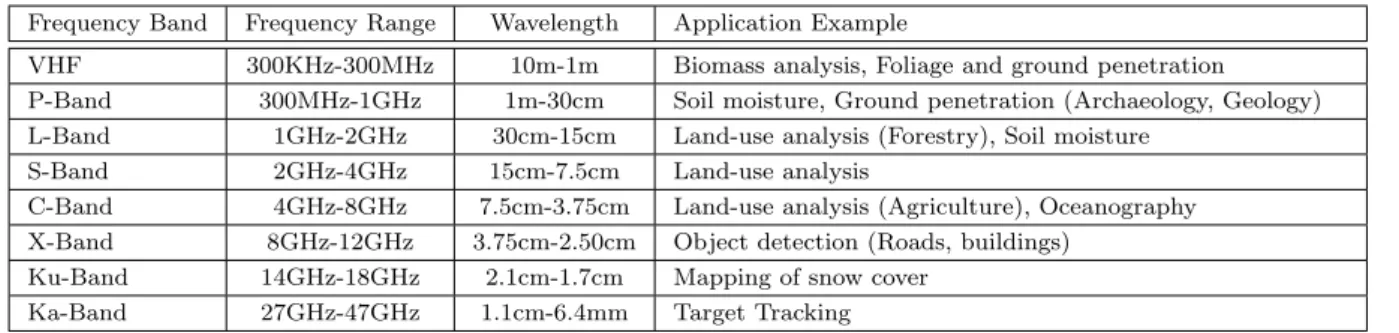
Table 2.1:
RAR Wavelengths and Applications
Frequency Band Frequency Range Wavelength Application ExampleVHF 300KHz-300MHz 10m-1m Biomass analysis, Foliage and ground penetration P-Band 300MHz-1GHz 1m-30cm Soil moisture, Ground penetration (Archaeology, Geology) L-Band 1GHz-2GHz 30cm-15cm Land-use analysis (Forestry), Soil moisture
S-Band 2GHz-4GHz 15cm-7.5cm Land-use analysis
C-Band 4GHz-8GHz 7.5cm-3.75cm Land-use analysis (Agriculture), Oceanography X-Band 8GHz-12GHz 3.75cm-2.50cm Object detection (Roads, buildings)
Ku-Band 14GHz-18GHz 2.1cm-1.7cm Mapping of snow cover Ka-Band 27GHz-47GHz 1.1cm-6.4mm Target Tracking
2.1.2 RAR Wavelength
Commonly used frequency bands are presented in Table 2.1. In spaceborne applications, mostly X-, C- and L-Band, and sometimes P-Band are used, as they are a good compromise between low generation power and low atmospheric extinction. Besides, using these four bands, a wide range of applications can be covered. Due to their long wavelengths, P-Band and L-Band can penetrate the ground, allowing the analysis of ground structure, which is of high interest for archaeological and geological applications. Furthermore, they can penetrate through dense foliage, allowing ground mapping instead of forest cover. On the contrary, C-Band RADAR penetrates to a lower extent, permitting mapping of forest structure and biomass evaluation. Finally, X-Band wave- lengths are too short to penetrate dense foliage. Reections happen at canopy height, allowing classication of forest types by considering intensity of the reection and volume decorrelation.
2.2 Synthetic Aperture RADAR (SAR)
The principle of Synthetic Aperture RADAR is to create an articial very long antenna. Practi- cally, instead of one single sensor position, the whole scene is illuminated at several consecutive sensor locations, creating a very long antenna. In the following, a straight ight path is assumed.
The derived formulas can be found in more details in (Klausing & Holpp 2000).
2.2.1 SAR Azimuth Resolution
The angular spread β
Aof the antenna at each sensor position is the same. An object in the scene is illuminated for each beam at a dierent position. This corresponds to dierent ranges to the sensor, as shown in Figure 2.2. Therefore, a Doppler eect occurs, with increasing signal frequency when the sensor comes closer to the object and decreasing signal frequency when the sensor moves away. The signal frequency f
0at the object is expressed as:
f
0= 1 + v
c
f
s, (2.4)
whereby v is the component of the sensor velocity in range direction and f
sthe frequency emitted by the sensor. The frequency shift between sensor and object is f
0−f
s. Furthermore, the returned echo is shifted by the same amount, leading to a total Doppler frequency shift f
dat the object of:
f
d= 2(f
0− f
s) = 2v
c f
s. (2.5)
2.2. Synthetic Aperture RADAR (SAR) 21
RAR SAR
LA βA LSA β
Figure 2.2:
SAR Principle
βd θ va
R
xd
Figure 2.3:
Geometry of a Synthetic Aperture RADAR - SAR
This expression can be rewritten as function of the velocity v
aof the sensor along its ight path:
f
d= 2v
asin β
dc · c
λ = 2v
ax
dλR . (2.6)
whereby β
dis the angular dierence between the object and the range direction and x
dis the azimuth coordinate of the object in a coordinate system with the sensor as origin, as represented in Figure 2.3.
The shift between emitted and returned frequency yields the correct object location, by extracting x
d.
Considering these observations, two objects can be distinguished if they have dierent Doppler frequency shifts. Thus, the azimuth resolution depends on the resolution ρ
fdof the Doppler frequency shift:
ρ
ASAR= λR
2v
aρ
fd. (2.7)
Assuming that the Doppler frequency shift is constant during the illumination time ∆t of the object, ρ
fdcan be expressed as:
ρ
fd= 1
∆t
, whereby ∆t = Rβ v
a= Rλ L
Av
a. (2.8)
Rβ is the length between the start and the last position of the sensor from which the object is observed (cf. Figure 2.2). It corresponds to the length of the synthetic aperture L
SA= Rβ =
RλLA