CHAPTER ONE INTRODUCTION
This study deals with an update global public health issues, i.e. healthy nutrition with regard to fruit and vegetable consumption. Since nutrition is an integral part involving every stage of people lifecycle, changes in diet affect more or less their physical health and wellness. Food is considered as one of the lifestyle choices that people practice on a daily basis. People who opt to continuously pursue the poor lifestyle choices may increase their risks to develop deteriorate health and disease. At present, it becomes obvious that people choose foods for reasons other than the nutritious aspect. Admittedly, it is evident that other factors, such as economy, geography, social and cultural values and environment, influence food choices as well as eating habits (Trudeau et al. 1998, Neumark-Sztainer et al. 1999, Pollard et al.
2002, Neumark-Sztainer et al. 2003, Dibsdall et al. 2003, Kamphuis et al.
2006). Driven by such factors, changes in food consumption behaviors are reflected in nutrition-related health outcomes, as witnessed by climbing statistics of health conditions and non-communicable diseases, e.g. obesity, hypertension, diabetes, cardiovascular diseases and cancers.
It is not unusual to experience this phenomenon in countries other than developed, industrialized nations since the effects of globalization and urbanization help shape towards modern industrial-urban lifestyles, which seem to be prone to a pattern of diet high in saturated fat, sugar and energy- dense foods and low in fiber, the so-called Western diet (Popkin 1999, WHO 2002, Kónya and Ohashi 2004, Pingali and Stringer 2005). For developing countries where numerous transitions are underway, these nutrition-related non-communicable diseases have put even greater health burden when combined with the existing malnutrition problems (WCRF/AIRC 1997, Popkin
1999, Pingali and Stringer 2005, Galea and Vlahov 2005). This leads to concerns, especially in developing countries where resources are limited.
Given that, Thailand is also amidst this transition; therefore, it is apparent that research, innovative knowledge and findings are crucially needed. Fruits and vegetables, as potential food choices, can play an important part in alleviating this situation as well as preventing those health problems both under and overnutrition, where Thailand’s prevailing characteristics, e.g. diverse horticulture of fruits and vegetables and traditional food consumption high in plant-based foods, are conducive to success. This study aims to provide such information to draw attention and help guide future policy initiatives to promote and facilitate consumption of fruits and vegetables in Thailand.
This study begins by introducing the importance of fruit and vegetable consumption as well as its public health relevance and current situation at the global level as well as in Thailand. Also, it addresses the needs and objectives for conducting this study. In the next chapter, it then provides crucial theoretical grounds in relation to fruits and vegetables that will be referred to throughout this study, i.e. definition, assessment methods and tools, as well as other related issues. Within this chapter, it also explains the conceptual framework and its application in quantifying disease burden attributable to risk of low intake of fruits and vegetables. In addition, it offers an analytical view of risk-factor-disease relationship through an approach of systematic review of latest published literature. The next chapter describes the investigation design and method applied in this study that combines quantitative and qualitative approaches. Later, it presents the findings of the study corresponding to steps of analysis, i.e. fruit and vegetable consumption assessment, risk quantification and urbanization influence investigation. The
remaining chapters provide crucial discussion issues with regard to the main results and analysis from the study, including limitations, future implications and conclusion.
1.1 Background
Fruits and vegetables, considered as micronutrient-rich foods, are widely accepted as an essential foundation of healthy diet. It is noted that an ample amount of fruit and vegetable consumption is considered to be an active measure to help prevent certain chronic diseases and to promote sustainable health and well beings (Widdowson and Matthers 1992, Shetty and McPherson, 1997, WHO 2003b). Mounting evidence, notably study reviews, indicates the protective effect of increased vegetable and fruit consumption against cardiovascular diseases and cancers (WCRF/AICR 1997, Terry et al.
2001, IARC 2003, Riboli and Norat 2003, Heber 2004, Genkinger et al. 2004, Key et al. 2004).
In fruits and vegetables are found many substances that are protective, whose biochemical mechanisms are not solely reliable upon any single nutrient or phytochemical (Steinmetz and Potter 1996, Heber 2004). The possible protective elements include dithiolthiones, isothiocyanates, indole- 32-carbinol, allium compounds, isoflavones, protease inhibitors, saponins, phytosterols, inositol hexaphosphate, vitamin C, d-limonene, lutein, folic acid, beta carotene (and other carotenoids), lycopene, selenium, vitamin E, flavonoids, and dietary fiber (Lamper 1999, Steinmetz and Potter 1996, Block et al. 2001, Holick et al. 2002, IARC 2003, Boyer and Liu 2004). It is recommended that in the fruit group consumption of whole fruits, rather than fruit juices, for the majority of the total daily amount ensure adequate
fiber intake, and that in the vegetable group a sufficient weekly intake of varieties of vegetables secure sufficient nutrient utilization (William 1995, Steinmetz and Potter 1996, WCRF/AICR 1997, IARC 2003).
1.1.1 Global public health perspectives on low intake of fruits and vegetables
Among the risk factors contributing to the worldwide disease burden, low intake of fruits and vegetables is of concern (WCRF/AICR 1997, WHO 2002, IARC 2003). At present, chronic and non-communicable diseases, particularly cardiovascular diseases (CVDs) and cancers are becoming a primal cause of disability and premature death worldwide. Annually, chronic conditions approximately accounted for 59 per cent of the 56.5 million deaths and 45.9 per cent of the global burden of disease (WCRF/AICR 1997). The World Health Report 2002 showed that about 31 per cent of ischemic heart disease, 11 per cent of stroke, and 19 per cent of gastrointestinal cancer were attributable to the risk of inadequate fruit and vegetable consumption. In other words, given that account, about 2.7 million deaths a year could be saved if consumption of fruits and vegetables achieved the level recommended by food guidelines (WHO 2002).
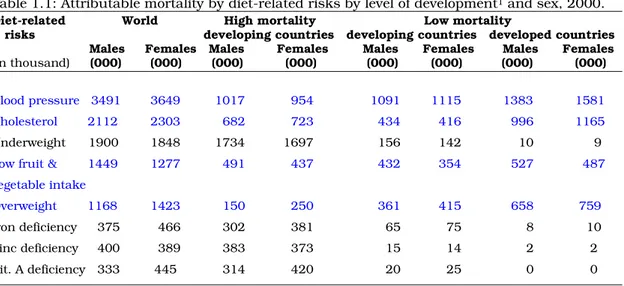
Table 1.1 illustrates the distribution of diet-related factor burdens in both developed and developing countries. Death tolls caused by diet-related risks contributing to non-communicable diseases, such as high cholesterol, overweight, high blood pressure and low fruit and vegetable intake indicate relatively similar tendencies in both western industrialized nations and developing countries. Deplorably, this puts such developing nations in a dilemma of the prevailing undernutrition and micronutrient deficiencies, and overnutrition. Major influences triggering this trend involve globalization,
urbanization and economic development (WCRF/AICR 1997), affecting changes in daily living and working styles, essentially consumption patterns (Popkin 1999, WHO 2002). Increasing evidence suggests globalization as a process driving international integration of markets of goods and services (Kónya and Ohashi 2004, Pingali and Stringer 2005), while income level, preferences and market prices (Ruel et al. 2005) as a result of economic development and urbanization help shape consumption behaviors towards homogeneity in the sense of higher living standards (WHO 2002, Kónya and Ohashi 2004). It is now not uncommon to see people in urbanized cities in developing countries develop the similar consumption-related problems seen in developed nations, e.g. overweight, hypertension or high cholesterol, whereas undernourishments, e.g. infants’ underweight still exist in many deprived areas of the country (WCRF/AIRC 1997, Popkin 1999, Pingali and Stringer 2005, Galea and Vlahov 2005).
Table 1.1: Attributable mortality by diet-related risks by level of development1 and sex, 2000.
Diet-related World High mortality Low mortality risks developing countries developing countries developed countries
Males Females Males Females Males Females Males Females (in thousand) (000) (000) (000) (000) (000) (000) (000) (000)
Blood pressure 3491 3649 1017 954 1091 1115 1383 1581 Cholesterol 2112 2303 682 723 434 416 996 1165 Underweight 1900 1848 1734 1697 156 142 10 9 Low fruit & 1449 1277 491 437 432 354 527 487 vegetable intake
Overweight 1168 1423 150 250 361 415 658 759 Iron deficiency 375 466 302 381 65 75 8 10 Zinc deficiency 400 389 383 373 15 14 2 2 Vit. A deficiency 333 445 314 420 20 25 0 0 Source: adapted from World Health Report 2002.
1The matrix defined by the six WHO’s regions (Africa, America, Eastern Mediterranean, Europe, South- East Asia and Western Pacific) and the five level of child and adult mortality strata (high child, very high adult; high child, high adult; low child, high adult; low child, low adult; very low child, very low adult) leads to 14 sub-regions (AFR-D, AFR-E, AMR-D, EMR-D, SEAR-D, AMR-B, EMR-B, SEAR-B,WPR-B, AMR- A, EUR-A, EUR-B, EUR-C, WPR-A).
In Table 1.1, High mortality, developing countries refer to AFR-D, AFR-E, AMR-D, EMR-D, SEAR-D; Low mortality, developing countries refer to AMR-B, EMR-B, SEAR-B,WPR-B; and Developed countries refer to AMR-A, EUR-A, EUR-B, EUR-C, WPR-A (WHO 2002).
Increased intake of fruits and vegetables has been proven to confer a protective effect against major investigated cancers of several sites, such as stomach, esophagus, lung, oral cavity and pharynx, endometrium, cervix, prostate, pancreas, and rectum/colon (Smith-Warner et al. 2003, WCRF/AIRC 1997, Terry et al. 2001, IARC 2003, Genkinger et al. 2004, Lunet et al. 2005). Several reports suggested that a recommended amount of fruit and vegetable consumption could decrease overall cancer incidence by at least 20%, in particular in cancers of mouth and pharynx, esophagus, lung, stomach, colon and rectum (WCRF/AIRC 1997, IARC 2003, Key et al.
2004). Nonetheless, this evidence has also been questioned. For instance, findings from some recent reviews of large prospective cohort studies and clinical trials have revealed a weaker or null association of fruit and vegetable consumption with reduced cancer risks (Sauvaget et al. 2003, Hung et al.
2004, Olsen et al. 2005, Gonzalez et al. 2005 and Nouraie et al. 2005, Park et al. 2005) (also see details in Chapter 2.3). This leads to controversial discussions on recommendations of the protective benefits of fruits and vegetables. Despite such an inconsistency of evidence in demonstrating the associations between fruit and vegetable intake and disease outcomes, increased fruit and vegetable consumption is still considered beneficial with regard to its nutrient profile benefits (Key et al. 2004) and greater consistency of the overall scientific evidence (Vainio and Weiderpass 2006).
Consumption of fruits and vegetables has also shown a protective effect against cardiovascular diseases, i.e. ischemic heart disease, ischemic stroke and coronary heart disease (Ness and Powles 1997, WCRF/AIRC 1997, IARC 2003, Johnsen et al. 2003, Pereira et al. 2004, Genkinger et al. 2004, Dauchet et al. 2005, Dauchet et al. 2006, He et al. 2006). Unlike for cancers, most findings have proven a strong inverse association between fruit and
vegetable intake and cardiovascular diseases (see Chapter 2.3). Concerning decreased risk for coronary heart disease, green leafy or cruciferous vegetables and vitamin C-rich fruits and vegetables were specifically advocated (Rim et al. 1996, Joshipura et al. 2001, Bazzano et al. 2002, Genkinger et al. 2004). According to the Dietary Approaches to Stop Hypertension (DASH) Study funded by the U.S. National Institutes of Health, 8 – 10 servings a day of fruits and vegetables are strongly suggested for those with hypertension and high blood cholesterol, important risk factors for development of stroke (Appel et al. 1997, NIH 2006).
Despite accumulating evidence in supporting this defensive role of fruits and vegetables against cardiovascular diseases and cancers, the consumption of fruits and vegetables barely achieve the recommendations in developed nations, such as the United States (Kreb-Smith et al. 2001), Britain (William 1995), and European countries (Naska et al. 2000, Agudo et al. 2002, O’Brien 2003, Ezzati et al. 2004) and, undoubtedly, in developing countries (WCRF/AICR 1997, WHO 2002, WHO 2003c, Ruel et al. 2005). This drives initiatives in researches and policies at the national and international levels, most of which, however, are implemented in the developed world where the availability of data on fruit and vegetable consumption, such as nationally representative data, allows deeper detailed investigations (IARC 2003, WHO 2003b, Ezzati et al. 2004, Ruel et al. 2005).
Currently, almost all countries and international organizations encouraged by the World Health Organization, a core agency at the global level in promoting an increase in fruit and vegetable consumption, formulate their food-based dietary guidelines for individuals in terms of generous quantities of fruits and vegetables as part of the daily diet (Painter et al.
2002, WHO 2003b, ILSI 2004). Recommendations, dietary guidelines and
standards as well as technical support are prompted for all countries, in particular developing countries, though diverse dietary patterns and cultures (Painter et al. 2002), to implement evidence-base strategies and to promote healthy diet patterns for their populations (WCRF/AICR 1997, WHO 2003b).
Table 1.2: The WHO/FAO’s global initiative plan on fruit and vegetable promotion.
1. To promote production and consumption of fruit and vegetables so as to promote and improve health and to help prevent non-communicable diseases
2. To innovate research and technology with regard to fruit and vegetable production, distribution, increased consumption, and benefits for health
● Initiating fruit and vegetable promotion activities at the national level Preparatory stage
1. Compiling baseline data related to fruit and vegetable consumption and health status using a rapid needs assessment method.
2. Establishing collaborative partnerships from concerned parties
3. Establishing nationally consensual scientific evidence base and culturally suited message 4. Enhancing advocacy environment, e.g. politics, public and private sectors, etc.
5. Conducting evaluation programs for benchmarking
6. Providing professional training for raising awareness and building support 7. Initiating fund raising strategy
Planning stage
1. Collaborating with main parties in designing effective interventions 2. Assisting fund raising activities
3. Disseminating success to gather more support
4. Providing support on needed and culturally sensitive activities.
5. Establishing milestones for gaining continuous motivation Implementation stage
1. Initiating appropriate interventions at the national, regional and/or local levels 2. Sustaining enabling environments for long-term success
3. Initiating programs for raising awareness 4. Providing capacity training programs
5. Developing and disseminating public and professional educational materials 6. Conducting administrative activities
Building sustainability
1. Applying the evaluation results to further improve program performance 2. Transferring programs and ownership to the implementers
3. Sustaining community participation
4. Supporting the integration of program elements into inter-sectoral policies at both local and national levels
5. Maintaining fundraising and long-term development strategy to secure resources 6. Keeping scientific and consensual base up-to-date
● Developing scientific knowledge and research in enhancing fruit and vegetable promotion activities 1. Standardizing scientific methods, e.g. definition, assessment methods, portion sizes.
2. Researching associations between fruit and vegetable intake and health and disease, e.g.
protective effects, food processing and preparation, nutrition transition, and food safety
3. Researching fruit and vegetable intake’s determinants covering both supply and demand sides, e.g. psychosocial, cultural, social, psychological and environmental factors.
4. Conducting literature review of the evaluation of existing fruit and vegetable promotion programs Source: Extracted from a meeting report on fruit and vegetable promotion initiative (WHO
2003b).
In addition to the settled framework of the global strategy on diet, physical activity and health and the implementation mandate of the “WHO Global Strategy for the Prevention and Control of Noncommunicable Diseases”, WHO planned to carry out as well as strengthen a global fruit and vegetable promotion initiative, including the existing “5-A-Day” type programs
(WHO 2003b). Such plans included global reviews of fruits and vegetables, standardization of fruit and vegetable classification and assessment methods, establishment of fruit and vegetable surveillance database and system, collaboration with FAO in ensuring food security and encouragement of a fruit and vegetable promotion programs in developing countries, as detailed in Table 1.2 above. Given that, a daily consumption for individuals is recommended of at least 400 grams of fruits and vegetables (excluding starchy tubes, legumes, nuts and seeds) for the prevention of chronic diseases as well as for the prevention and mitigation of micronutrient deficiencies, particularly in developing countries (WHO 2003c).
1.1.2 Fruit and vegetable situation in Thailand
Situated in the continental Southeast Asia, Thailand is a lower-middle- income country2 with the current population of 65.38 million (2006) in an area of 514,000 square kilometers. Thailand has economically evolved from an agriculture-base nation. About 5.1 million small farm ventures are a majority part of the agricultural sector and almost 60 percent of the total population, mainly as farmers, engages in agriculture (FAO 1999). The agricultural influence is the main root of the Thai living patterns in almost all aspects, i.e. social, culture, beliefs, norms and diet and consumption patterns. The major components of Thai diet include rice, legumes, vegetables, fruits, and less meat (FAO 1999). This diet pattern is relatively typical for almost all Asian nations (Shetty and McPherson 1997, Popkin 1999). Fresh spices and herbs are common basic ingredients in almost all Thai dishes. The common food preparation methods include stewing, grilling
2 Countries with Gross National Income (GNI) between $876 and $3,465 classified by the World Bank
and baking; while a technique of frying has been adopted from Chinese cuisine (Kosulwat 2002). In a typical Thai meal, dishes are served all at once, not in courses, except for desserts which normally are various seasonal fresh fruits. This permits such various dishes to complement and enhance tastes (Kosulwat 2002).
Nonetheless, since having entered into the international trade treaties with western countries in 1856, Thailand, which successfully evaded colonization, has continuously adapted westernization into its own prevailing societal norms and values (Wibulpolprasert 2002). As a result, Thailand, with greater advantages of transferred technology and the enabling agro-climatic conditions prevailing in the country, achieves sufficiency in the production of cereals, staple substitutes, oil crops, legumes, fruits, vegetables and horticultural commodities (FAO 1999). Foods are increasingly produced to serve for sale and exportation purposes rather than for domestic uses (Kosulwat 2002).
1.1.2.1 Fruit and vegetable production and accessibility
Fruit and vegetable production throughout the year serves not only the domestic markets but also the global trades, including those in processed forms (FAO 1999, FAO 2004). Indigenous kinds and diverse tastes of Thai fruits and vegetables favor an increasing demand of fruit and vegetable exports. According to Thai Agriculture Department, Ministry of Agriculture and Cooperatives, exported or frozen vegetable accounted for 81,965, 85,771 and 88,654 metric tons in 2001, 2002 and 2003, respectively. For fresh fruit, Thailand made exports of 303,256, 332,723 and 239,749 metric tons in 2001, 2002 and 2003, respectively (MOAC 2004).
In Thailand, there are several accesses to vegetables and fruits, such as indigenous vegetables and fruits available in tropical rain forests along jungle tracks, road sides or in abandoned areas as wild weeds and berries; home gardens; gardening for village markets; or commercial farming at small and large scales (FAO 1999). In suburban and irrigated areas, the main source of income of farmers is normally from vegetable cultivation and, essentially, when other sources of food are scarce, vegetables commonly serve sustainability and food security for the families (Kunarattanapruk et al.
1998, FAO 1999). Nonetheless, there has recently appeared oversupply of fruits and vegetables due to overproduction, coupled with a bar from exports due to exceeding amounts of agriculture-related chemicals, such as fertilizers or pesticides, acceptable by importing countries such as Japan, the European Union and the U.S. Given that, the government has attempted to resolve by reducing production sizes, promoting organic diverse fruit and vegetable farming while initiating national seasonal campaigns for higher consumption (FAO 1999).
1.1.2.2 Fruit and vegetable consumption
For more than four decades, national food and nutrition surveys have been used as a key tool in monitoring changes in nutritional status as well as diet- related health conditions of the Thai population. The previous surveys illustrated a climbing trend of fruit and vegetable intakes since the first 1960, the first national nutrition survey, as shown in Table 1.3. However, those consumption levels were still considerably low and subject to the availability of nutrition knowledge and assessment tools at the time.
Table 1.3: Trends of fruit and vegetable intake in Thailand, 1960-1995 Years of survey Food item
1960 1975 1986 1995
Fruits (g/d) 6.1 36.0 99.2 73.6
Vegetables (g/d) 81.9 106.0 115.9 113.4
Source: Extracted from Kolsuwat (2002), the 4th National Nutrition Survey, 1995.
Essentially, the reports on the 4th National Nutrition Survey in 1995 using a 24-hour dietary recall showed the turning point of decreasing fruit and vegetable consumption among Thai (MOPH 1995). In this report, at the household level, more than 106 kinds of various vegetables were consumed by Thais at an average of 113.2 grams per person per day. In terms of fruit consumption, an average of 73.6 grams a day of various fruits, more than 9 kinds, normally in fresh form. Such amounts consumed (combined fruits and vegetables consumed at an average of 186.8 g/day) were considerably low, when compared to the national dietary guidelines for fruit and vegetable consumption3. Like previous surveys, this survey, however, did not primarily serve to assess the fruit and vegetable intake purpose. Also, it had several constraints with respect to methodological issues, such as a single-day 24- hour recall, seasonal variations, food coding and mixed dish calculations.
Besides, a study conducted by the Physical Activity Division, Ministry of Public Health (MOPH 2000a) investigated health behaviors and physical activity practices among employees working in the Ministry of Public Health, where consumption frequency was basically applied to interpret dietary consumption behaviors. The study showed that almost half of the participants, especially civil servants representing a group of higher education and socio-economic status, consumed only about 2 servings per day (or approximately 135 g/day) of fruit and vegetable combined. This
3 In accordance with the recommended serving (portion) size designated by the Nutrition Division, Ministry of Public Health (MOPH 2000b):
One serving of fruits is an average of 95 grams (70 – 120 grams) with a suggested minimum daily intake of 4 servings.
One serving of vegetables is about 40 grams (40-50 grams) with a suggested minimum daily intake of 5
brings up a concern of consumption patterns and working styles that have recently changed among people residing in the cities as a result of globalization, urbanization and economic development (WCRF/AICR 1997, Konya and Ohashi 2004).
Considering the quantities of domestic production and supply for food uses in fruit and vegetable categories, as provided in the food balance sheets by Food and Agriculture Organization (FAO 2006), the domestic fruit and vegetable productions estimated at the country level during the period of 1985 to 2003 are generally rising every year whereas the supplies for domestic food uses are moderately increasing (see Table 1.4). Conversely, with regard to supply for food uses per individual (kg/year) at the country level, the accounts indicate decreasing amounts of fruits and vegetables from 139.5 kg/year in 1985 to 128.2 kg/year in 2003. The falling trend appears to affect fruits rather than vegetables. This suggests that there be changes in the food system as well as eating pattern of Thai society.
Table 1.4: Thailand’s Supply Utilization Accounts for fruits and vegetables, 1985-2003.
Category Account 1985 1990 1995 2000 2003
Fruits
Production quantity
(1000 metric tons) 5742.4 6248.5 7148.5 7844.9 7756.1
Food uses quantity
(1000 metric tons) 5379.8 5246.7 6002.1 6153.8 5861.1 Food uses per capita
(kg/year) 97.0 89.0 95.8 92.3 86.4
Vegetables
Production quantity
(1000 metric tons) 2463.8 2544.1 3012.2 3036.6 3236.5
Food uses quantity
(1000 metric tons) 2377.7 2304.9 2661.8 2717.7 2910.7 Food uses per capita
(kg/year) 42.5 38.2 41.5 40.3 41.8
Fruits &
vegetables
Production quantity
(1000 metric tons) 8206.2 8792.6 10160.8 10881.5 10992.6 Food uses quantity
(1000 metric tons) 7757.5 7551.6 8663.8 8871.5 8771.8 Food uses per capita
(kg/year) 139.5 127.2 137.3 132.6 128.2
Source: Food Balance Sheet electronic database (FAO 2006).
1.1.2.3 Disease trends in Thailand
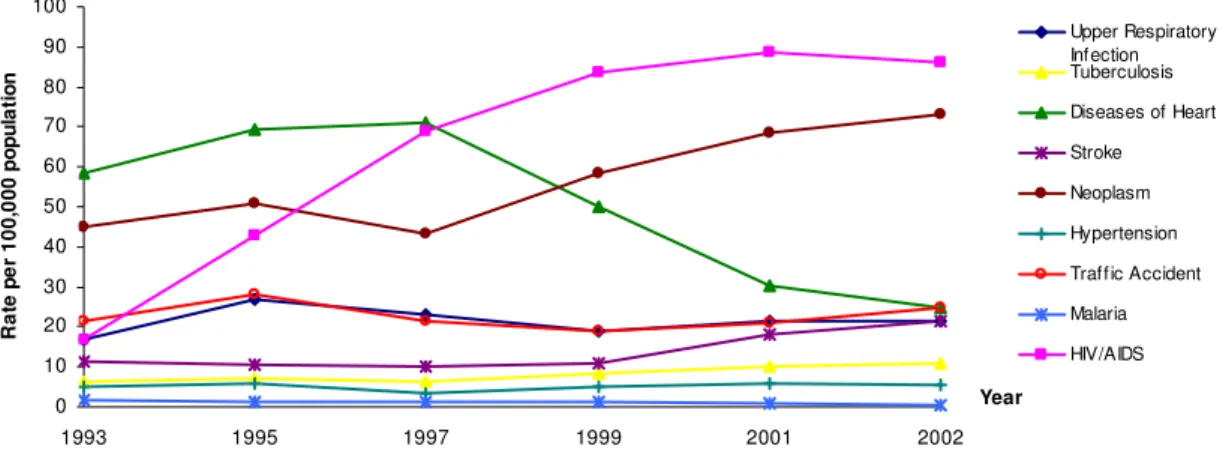
Like other developing countries, Thailand is currently experiencing an epidemiological transition; namely, from infectious and parasitic diseases as well as undernutrition to chronic and degenerative diseases of adult life such as heart diseases, cancers, strokes and traffic accidents. According to the recent Thai national statistics (Figure 1.1), mortality rates for non- communicable diseases, such as cancers, stroke, hypertension, are significantly climbing, closely following HIV/AIDS, which presently is the prime leading cause of death (MOPH 2002b). Such communicable diseases as malaria, which used to be significant national health problems, have been declining except for re-emerging diseases, e.g. tuberculosis which was in relation to HIV/AIDS. This signals changes in health conditions and disease patterns in Thailand, which mostly are related to changes in patterns of consumption and behavior, e.g. diet, smoking, drinking and activity.
Figure 1.1: Mortality rates per 100,000 population, by cause, Thailand, 1993 - 2002
Trends of Thai Mortality Pattern
0 10 20 30 40 50 60 70 80 90 100
1993 1995 1997 1999 2001 2002
Year
Rate per 100,000 population
Upper Respiratory Infection Tuberculosis Diseases of Heart Stroke Neoplasm Hypertension Traffic Accident Malaria HIV/AIDS
Source: Bureau of Policy and Strategy, Ministry of Public Health, Thailand, 2006.
However, the rate of heart diseases has been declining since 1997, which was actually affected by the implementation of death certificate analysis study. The one-year period study conducted during 1997 and 1999 in 16 provinces used the verbal autopsy method to verify the actual cause of death (MOPH 2003). The study led to significantly improved accuracy of determination of causes of death, where a death was conventionally confirmed by lay persons in the remote areas with limited access to medical care or trained medical personnel. Or, otherwise, a death may also be medically assigned based on the conventional final symptomatic appearances such as respiratory or cardiac arrest or heart failure (MOPH 2003). Only 29.3 per cent of specified causes of death were in consistency with those stated in the death certificates. This may explain the trend of heart diseases with an apparent drop in mortality rates after 1997 due to improved cause of death notification.
The death certificate analysis study, however, illustrated that in those years of investigations the first leading cause of death for all age groups was the diseases associated with circulatory system (18.6 per cent of all causes), more than half of which were cerebrovascular diseases. The second leading cause was cancers (16.2 per cent), nearly half of which were at the sites of liver/bile duct and lung. The third leading cause was infectious diseases (15.5 per cent), most of which were HIV/AIDS, especially among teenagers and young adult males, followed by tuberculosis. The fourth leading cause was external causes among children and youths (12.4 per cent), such as accidental drowning and road traffic accidents (MOPH 2003).
Table 1.5: Major cause of death among study population, by age group and sex Major causes of death
Age group
Males Females
Under 1 year premature birth, low birth weight, pneumonia
premature birth, low birth weight, congenital heart defect, pneumonia
1 – 4 years accidental drowning, pneumonia accidental drowning, pneumonia 5 – 14 years accidental drowning, road traffic
accidents
accidental drowning, road traffic accidents 15 – 24 years road traffic accidents, HIV/AIDS,
suicide
road traffic accidents, HIV/AIDS, suicide 25 – 44 years HIV/AIDS, road traffic accidents,
suicide
HIV/AIDS, road traffic accidents, suicide 45 – 59 years liver/bile duct cancers, cerebrovascular
diseases, diabetes
liver/bile duct cancers, cerebrovascular diseases, diabetes
60 – 74 years cerebrovascular diseases, liver/bile duct cancers, chronic obstructive pulmonary disease (COPD)
cerebrovascular diseases, diabetes, liver/bile duct cancers
75 years and above
cerebrovascular diseases, liver/bile duct cancers, chronic obstructive pulmonary disease COPD), cardiac ischemia
cerebrovascular diseases, diabetes, cardiac ischemia
Source: Death Certificate Analysis study, Ministry of Public Health, 2003
Table 1.5 demonstrates causes of death derived from the death certificate analysis study by age group and sex. It is evident that chronic diseases, especially cancers and cerebrovascular diseases are as major health threats for those aged over 45 years in both males and females.
Table 1.6: Rank and disease burden of Thais (DALYs) by sex, 1999 (million)
Males Females
Rank Disease DALY % Rank Disease DALY %
1 HIV/AIDS 9.6 17 1 HIV/AIDS 3.7 11
2 Traffic injury 5.1 9 2 Stroke 2.8 6
3 Stroke 2.7 5 3 Diabetes 2.7 6
4 Liver cancer 2.5 4 4 Major Depression 1.5 3
5 Diabetes 1.7 3 5 Liver cancer 1.2 3
6. Ischemic heart disease 1.6 3 6 Osteoarthritis 1.1 3
7 COPD 1.6 3 7 Traffic injury 1.1 3
8 Homicide/violence 1.6 3 8 Anemia 1.1 3
9 Suicides 1.5 3 9 Ischemic heart disease 1.1 3
10 Drug dependence 1.4 2 10 Cataracts 1.0 2
Source: Burden of Diseases and Injuries in Thailand: Priority Setting for Policy, 2002.
Table 1.6 shows the health status of Thai people in 1999 by means of a summary measure, Disability-Adjusted Life Year—DALY4. HIV/AIDS was the number one leading cause of DALYs lost in both males and females (17% in males and 11% in females). The second and third causes in men were road traffic accidents and stroke while stroke and diabetes in women, respectively.
4 Disability-Adjusted Life Year (DALY) is a summary measure indicating lost years of healthy life due to
About one fifth of the overall disease burden involves consumption-related chronic diseases, i.e. cardiovascular diseases, cancers, and diabetes (MOPH 2002a). Apparently, non-communicable diseases have become the leading causes of mortality and morbidity among Thai people. This demonstrates a major contribution of nutritional issues to the mortality and morbidity of Thais.
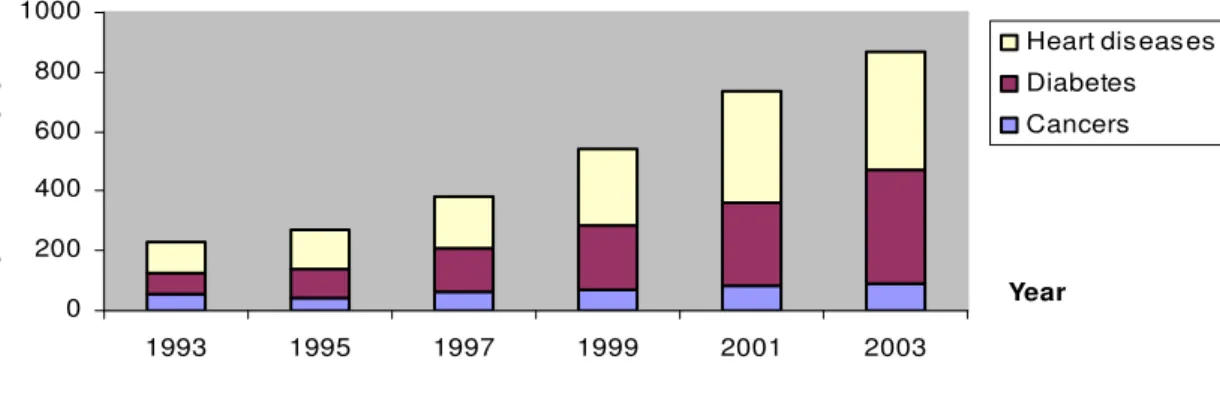
Figure 1.2: Hospitalization rates of patients with heart diseases, cancers, and diabetes, 1993- 2003, Thailand.
Hospitalization rates of patients with heart diseases, cancers and diabetes from 1993 to 2003
0 200 400 600 800 1000
1993 1995 1997 1999 2001 2003
Year
Rate per 100,000 population
Heart diseases Diabetes Cancers
Source: Inpatients Report, Ministry of Public Health, Thailand, 2006.
Figure 1.2 demonstrates climbing trends of the hospitalization rates of patients with heart diseases, cancers and diabetes in all public health facilities from 1993 to 2003. The admission rate of heart disease patients per 100,000 population considerably went up from 101.7 in 1993 to 252.6 in 1999 and 397.0 in 2003. For cancer cases, the admission rates per 100,000 population increased from 56.1 in 1993 to 89.4 in 2003. Likewise, the hospitalization rates per 100,000 population of diabetic patients rose from 69.3 in 1993 to 380.7 in 2003. Subsequently, these trends also infer an increase in utilization of health services as well as their incurred costs.
As mentioned earlier, Thailand is recently experiencing several transitions, i.e. economy, consumption and working patterns as well as demography. This is accompanied by a greater accessibility to care, a better coverage of the health service system, advanced medical technology, and improved environmental and personal hygiene, thereby inevitably encountering changes in health problems and patterns. Increased fruit and vegetable consumption considered to be a preventive approach to obtain better health, in terms of either health gains or health care cost savings, might be a promising option while the national health resources seem more and more limited.
1.2 Aim of this study
In recognition of a national alerting signal of disease trends as well as conducive global environments for technical support, a research on fruit and vegetable consumption, in relation to the cause and prevention of cardiovascular diseases and cancers, requires greater attention. In Thailand, few studies specifically engage in areas of fruit and vegetable intake issues.
Following are questions of major interest leading to construction of objectives, hypotheses and design of this study.
Do Thais currently consume fruits and vegetables sufficiently? Does such a level of fruit and vegetable consumption meet the national or international dietary recommendations for fruits and vegetables? Do demo/geographic differences affect quantity and consumption behaviours in relation to fruits and vegetables? How much does low fruit and vegetable consumption risk contribute to cardiovascular diseases and cancers? Does urbanization affect fruit and vegetable consumption patterns? What are
potential influences in association with such changes? What can be done to improve this situation? This study attempts to analyze these issues and provide new insights.
Specifically, this study aims to achieve the following objectives
1. To assess the magnitude of low intake of fruit and vegetable in Thailand.
2. To estimate burden of low intake of fruit and vegetable risk contributing to cardiovascular disease and cancers in Thailand.
3. To investigate the consumption patterns of fruit and vegetable intake in association with urbanization in Thailand.
To fulfill these objectives, both quantitative and qualitative information has been gathered and analyzed. By this, the study will be of use in providing information to help guide future policy initiatives to promote and facilitate consumption of fruits and vegetables in Thailand. Effective policies and programs are needed to influence healthy consumption behaviours and promote fruit and vegetable intake, where Thailand’s natural resources provide ample supply of these foods.