Distributional and Incentive Effects of the Austrian Pension System
Sandra Müllbacher Wolfgang Nagl
Research Report
Institut für Höhere Studien (IHS), Wien Institute for Advanced Studies, Vienna
Distributional and Incentive Effects of the Austrian Pension System
Sandra Müllbacher Wolfgang Nagl
Final Report Study on behalf of Global Equity Partners September 2015
Contact:
Mag. Sandra Müllbacher
: +43/1/599 91-234
email: sandra.muellbacher@ihs.ac.at
Dr. Wolfgang Nagl
: +43/1/599 91-115 email: nagl@ihs.ac.at
Table of Contents
1. Introduction 1
2. Data and Method 3
3. Results 6
3.1. Situation of New Pensioners for the Year 2010 ... 6
3.2. Distributional Effects... 8
3.2.1. The Status Quo ... 9
3.2.2. The New Pension System APG ... 13
3.2.3. NDC System ... 16
3.2.4. Pure NDC System ... 20
3.3. Explicit and Implicit Redistribution ... 23
3.4. Incentive Effects ... 27
4. Conclusion 33
5. Literature 35
Tables
Table 1: Comparison sample and official numbers (2010) ... 3
Table 2: Descriptive statistics of new pensioners in 2010 ... 8
Table 3: Descriptive Statistics Status Quo ... 10
Table 4: Descriptive statistics APG ... 14
Table 5: Descriptive statistics NDC ... 18
Table 6: Descriptive statistics pure NDC ... 21
Table 7: Calculation of implicit redistribution in the APG system ... 24
Table 8: Relative shares of individual contributions and redistribution on the individual pension, all pensioners, women and men... 25
Table 9: Relative shares of individual contributions and redistribution on the individual pension, years of contribution ... 26
Table 10: Relative shares of individual contributions and redistribution on the individual pension, lifetime income (10% Quantiles) ... 27
Figures
Figure 1: Net SSW Ratio Status Quo, All Pensioners, Women and Men ... 11
Figure 2: Net SSW Ratio Status Quo, Years of Contribution ... 12
Figure 3: Net SSW Ratio APG, Lifetime Income (10% Quantiles) ... 12
Figure 4: Net SSW Ratio APG, All Pensioners, Women and Men ... 15
Figure 5: Net SSW Ratio APG, Years of Contribution ... 15
Figure 6: Net SSW Ratio APG, Lifetime Income (10% Quantiles) ... 16
Figure 7: Net SSW Ratio NDC, All Pensioners, Women and Men ... 19
Figure 8: Net SSW Ratio NDC, Years of Contribution ... 19
Figure 9: Net SSW Ratio NDC, Lifetime Income (10% Quantiles) ... 20
Figure 10: Net SSW Ratio Pure NDC, All Pensioners, Women and Men ... 22
Figure 11: Net SSW Pure NDC, Years of Contribution ... 22
Figure 12: Net SSW Pure NDC, Lifetime Income (10% Quantiles) ... 23
Figure 13: Explicit and Implicit Redistribution, All Pensioners, Women and Men ... 24
Figure 14: Explicit and Implicit Redistribution, Years of Contribution... 25
Figure 15: Explicit and Implicit Redistribution, Lifetime Income (10% Quantiles) ... 27
Figure 16: Change in Average Monthly Gross Pension for Postponing Retirement After the Earliest Possible Retirement Age, Men ... 30
Figure 17: Change in Average Monthly Gross Pension for Postponing Retirement After the Earliest Possible Retirement Age, Women ... 31
Figure 18: Change in Gross SSW for Postponing Retirement After the Earliest Possible Retirement Age, Men ... 31
Figure 19: Change in Gross SSW for Postponing Retirement After the Earliest Possible Retirement Age, Women ... 32
1. Introduction
The Austrian pension system is a pay-as-you-go (PAYGO) pension scheme with defined benefits. Because of this setup, the system is particularly vulnerable to the aging population and the shrinking labour force. To counteract this institutional problem, the General Pensions Act of 2004 was passed (Allgemeines Pensionsgesetz, APG). Before this reform, calculating an individual’s pension claim only focused on the best years of one’s employment career.
Under the new regulation, a person’s whole employment career is taken into account. In a transitory period until about 2050, grandfathering applies for entitlements acquired under the old system. In a nutshell, the current legal situation can be described as follows:
- For people who started their career after 2005 and/or were born after 1990, the new pension system applies completely;
- For people born before 1955, the old system applies;
- For all in between, a mixture of both systems applies, the new system being more prominent in the pension calculation if people were born in more recent years. Since the first of January 2014, notwithstanding the consideration of different rules, the accumulating pension claims became more transparent, as all people born after 1955 got an individual account (“Pensionskonto”) which contains their pension claims.1
In this paper, we analyse the distributional and incentive effects in the Austrian pension system, with a focus on the redistribution within the system. A more equal distribution is a basic goal of society. Depending on inequality aversion, adequate redistribution adds to a nation’s welfare, in spite of the distortions created by the tax transfer mechanism (Hochman and Rodgers, 1969; Persson and Tabellini, 1994; Sinn, 1995). For the government and voters to be informed about the nature and direction of redistribution, it should be done explicitly, rather than implicitly, within a social security system, and should be coordinated with the general tax transfer mechanism to achieve a desired and coherent total amount of redistribution. For this reason, a clear separation of insurance and redistribution is necessary where old age insurance is provided by an actuarially fair pension system, and redistribution is achieved by progressive taxes on higher earnings and income supplements and transfers at the lower end of the distribution. If redistribution is eliminated by imposing actuarial fairness, then people should be compensated by explicit transfers to maintain the desired level of redistribution, subject to the usual democratic debate. If imposing actuarial fairness eliminates implicit intergenerational distribution, a transitional compensation scheme is necessary that ensures a balanced intergenerational distribution as well. To the best of our
1 For an overview of all rules and regulations concerning the Austrian pension system see Bundeskanzleramt (2015) or Pensionsversicherungsanstalt (2015b). Section 3.2.2 shows an example for the transition period.
knowledge there is no related literature that quantifies the implicit distributional effects within the Austrian Pension System.
Our analysis of incentive effects is related to the literature on labour market incentives and the employment of older workers in Austria (e.g., Jaag et al., 2010; Keuschnigg and Keuschnigg, 2004; Mara and Narazani, 2011; Staubli and Zweimüller, 2013). In contrast to this literature, we focus on the decision to retire. The closest study to our investigation is, therefore, Gruber and Wise (2002) and Hofer and Koman (2006) for Austria.
We use the concepts of Social Security Wealth (SSW) and the Net SSW Ratio to determine the distributional and incentive effects (Gruber and Wise, 2002). We mainly study four scenarios using the data of people who retired in 2010. The first scenario is the status quo.
As stated above, the pension reform of 2004 brought new regulations; however, for people who retired in 2010, the pre-reform regulations apply. In the second scenario, we simulate the full implementation of the APG, not considering the transition period. Thereby, we take the employment pattern as given and focus on the change in the distributional and incentive effects due to the new system. As a third scenario, we simulate a simple Notional Defined Contribution (NDC) system. To separate the explicit and implicit redistribution, we simulate in a fourth scenario a pure NDC system without non-contribution-based pension benefits.
Besides the distributional and incentives measures, we provide descriptive statistics for all scenarios of the earliest possible retirement age, the average pension amount, and gross replacement rates. All measures and statistics are reported separately for men and women.
All reported monetary values are Euros (€) of the year 2014.
The remainder of the paper is organized as follows. The next section briefly describes our data and method. In Section 3, we present our results by first illustrating the situations of new pensioners in the year 2010. After that, we analyse the distributional effects for the different scenarios of the Austrian pension system. Subsequently, we focus on the explicit and implicit redistribution in the APG system. In the last subsection, we show the retirement incentives in various pension systems. In the final section, we present our conclusions.
2. Data and Method
To calculate the distributional and incentive effects in the Austrian pension system, we use the IHS-Microsimulation-Model-for-REtirement-Behaviour-in-Austria (IREA) (Hanappi et al., 2012). This state-of-the-art microsimulation model is based on the administrative data of all employees (except civil servants) subject to social insurance contributions. Our data comprises people who were entitled to receive a pension in 2010.
We exclude survivor’s pensions and all people retiring before 55. In our analysis, we focus on the old-age-pension system; thus, we need people with careers ending reasonably close to statutory retirement age. Furthermore, we exclude people with additional pension claims from working abroad as we are not able to model their pension claims correctly. In our dataset, this applies to about 20% of the observations.
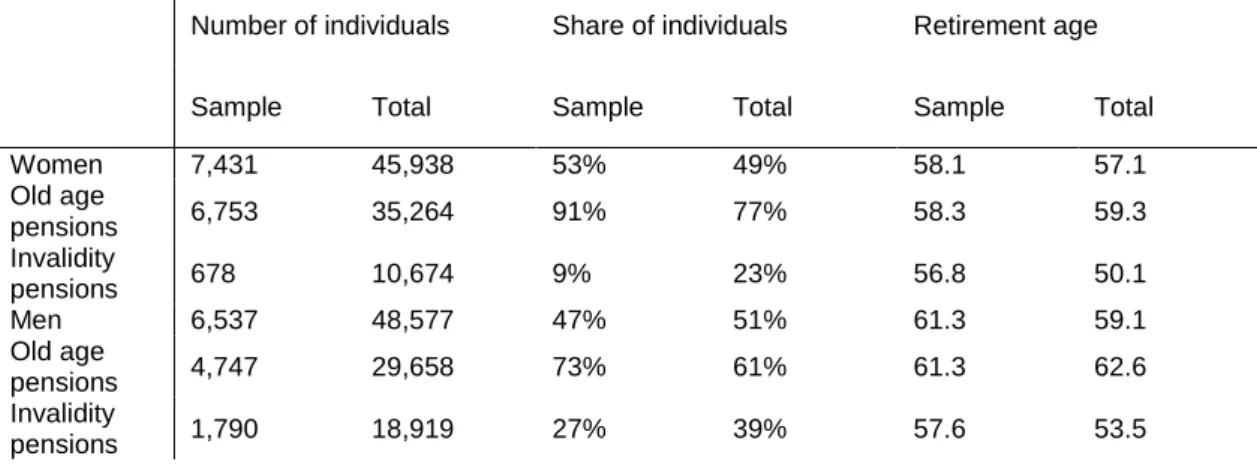
From this dataset, we draw a sample of 15,000 people. Table 1 compares this sample with the overall number of new pension claims in 2010 according to official numbers. Please note that the official numbers contain people with cross-national pension claims. Furthermore, retirement age is not restricted, while we restrict it to at least 55. This second point explains the larger share of old age pensions in our sample. Looking at the retirement age in the official numbers, we see that the average retirement age into an invalidity pension lies below our restriction of 55; thus, we exclude a large share of invalidity pensions in our sample. The fact that the retirement age of old age pensions in our sample is lower than in the official numbers might be due to the exclusion of foreign pension claims, as the retirement age of people living abroad is significantly higher than of people living in Austria (Sozialministerium, 2014).
Table 1: Comparison sample and official numbers (2010)
Number of individuals Share of individuals Retirement age
Sample Total Sample Total Sample Total
Women 7,431 45,938 53% 49% 58.1 57.1
Old age
pensions 6,753 35,264 91% 77% 58.3 59.3
Invalidity
pensions 678 10,674 9% 23% 56.8 50.1
Men 6,537 48,577 47% 51% 61.3 59.1
Old age
pensions 4,747 29,658 73% 61% 61.3 62.6
Invalidity
pensions 1,790 18,919 27% 39% 57.6 53.5
Source: IREA (2015), OPIS (Federal Ministry of Labour, Social Affairs and Consumer Protection, http://www.dnet.at/opis [11.09.2015]
To examine the distributional effects in the Austrian pension system, we calculate the Net SSW for every individual at planning age S and given retirement age R (e.g., Gruber and Wise, 2002; Hanappi et al., 2014):
Equation 1: Net SSW
𝑁𝑒𝑡 𝑆𝑆𝑊𝑖= ∑ 𝑏𝑖𝑡⋅ 𝑣𝑡
∞
𝑡=𝑅
⋅ 𝛿𝑡−𝑆− ∑ 𝑐𝑡⋅ 𝑤𝑖𝑡⋅ 𝑣𝑡 𝑅−1
𝑡=𝑆
⋅ 𝛿𝑡−𝑆− ∑ 𝑐𝑡⋅ 𝑤𝑖𝑡⋅ 𝛿𝑡−𝑆
𝑆
𝑡=0
The first term on the right-hand side describes the payout stream after retiring in period t = R. The individual`s pension is denoted by 𝑏𝑖𝑡.The probability to survive until age t given survival until age S is given by 𝑣𝑡. The discount rate is 𝛿 = 1/(1 + 𝑟). In the following analysis, we assume a real internal rate of return r of 1%. Of course, nominal values were transformed into real values before the internal rate is applied. The second term on the right- hand side considers the contributions paid from planning age S until retirement age R. The contribution rate is 𝑐𝑡. The individual wage is 𝑤𝑖𝑡. The third term on the right-hand side includes the contributions paid until the planning age S. In the following analysis, the planning age will be the retirement age so that the second term becomes zero.
When the Net SSW equals zero, the pension system is actuarially fair. A positive Net SSW indicates a positive transfer within the pension system. Over their remaining lifetime, people receive more from pensions than they contributed to the system. The remainder must be paid by other people or future generations.
To detect a relative betterment or a less favourable treatment of different groups, we calculate the Net SSW Ratio:
Equation 2: Net SSW Ratio
𝑁𝑒𝑡 𝑆𝑆𝑊𝑖 𝑅𝑎𝑡𝑖𝑜 = 𝑁𝑆𝑆𝑊𝑖
∑𝑅−1𝑡=𝑆𝑐𝑡⋅ 𝑤𝑖𝑡⋅ 𝑣𝑡⋅ 𝛿𝑡−𝑆− ∑𝑆𝑡=0𝑐𝑡⋅ 𝑤𝑖𝑡⋅ 𝛿𝑡−𝑆
A Net SSW Ratio of zero indicates a balanced account. A set internal rate of return (in our calculations 1%) implies actuarial fairness. A positive Net SSW Ratio indicates the percentage of which the present value of the future pensions is larger than the present value of the contributions, e.g. a Net SSW Ratio of 0.5 indicates that the present value of the future pension is 50% larger than the present value of the contributions. A Net SSW Ratio of 1 indicates that the present value of the future pension is twice as large as the present value of the contributions. A negative Net SSW Ratio indicates that the present value of the contributions is larger than the present value of the future pensions.
To study the retirement incentive (Section 3.4) given by the pension system, we calculate the SSW (Börsch-Supan et al., 2004):
Equation 3: SSW
𝑆𝑆𝑊𝑖= ∑ 𝑏𝑖𝑡⋅ 𝑣𝑡
∞
𝑡=𝑅
⋅ 𝛿𝑡−𝑆− ∑ 𝑐𝑡⋅ 𝑤𝑖𝑡⋅ 𝑣𝑡⋅ 𝛿𝑡−𝑆
𝑅−1
𝑡=𝑆
Equation 3 differs from Equation 1 as it only takes into account the future pension (first term from Equation 1) and the extra contributions (third term Equation 1) from planning age S onwards. When deciding whether to retire now or later, the contributions paid before the planning point S are sunk costs for the forward-looking individual.
The pension system is neutral if postponing retirement does not change SSW, such that the SSW of retiring in t is equal to the SSW of retiring in t + 1. That means the extra contributions and foregone pension benefits are exactly compensated by the future pension increase. A positive SSW indicates overcompensation of the forgone pension benefits and extra contributions by the future pension increase. A negative SSW indicates the reverse case.
3. Results
In the first step, we briefly discuss the Austrian pension reality by describing the situation of new pensioners in the year 2010. We focus on the earliest possible retirement into an old- age pension2, and provide descriptive statistics on the average pension amount and the gross replacement rate in relation to the last income as well as in relation to the average income over the life cycle.
In the second step, we study the distributional effects of different pension systems. In a calculation exercise, we use the employment pattern and retirement behaviour of the new APG system to analyse the status quo pension system, a fully implemented APG system and a simple NDC system for Austria. For the latter, we study with and without non-contribution- based pension benefits. As a measure for the distributional effect, we calculate the Net SSW Ratio (Equation 2). We present gender-specific results as well as results for different lengths of the contribution period and for different income levels.
In the third step, we focus particularly on the following question: Which share of the redistribution in the new Austrian pension scheme (APG) is explicit (by means of insurance years for child-rearing, sickness, unemployment, etc.) and which share is implicit (a higher pension than the covered by contributions)?
In the fourth step, we focus on the incentive effect to retire. The SSW (Equation 3) provides an adequate measure for that purpose. We study the incentive effect again for the status quo, the APG and the NDC scenarios.
3.1. Situation of New Pensioners for the Year 2010
Retiring into an old-age pension in 2010 as soon as possible leads to quite a good income situation. The average gross pension per month is €1,231 for women and €2,043 for men (Table 2). This corresponds to a gross replacement rate in relation to the last income of 68%
for women and 78% for men. Comparing the gross pension with the average gross income earned by pensioners during their lifetime, we find that pensions are higher than their average income: the gross replacement rates concerning the average income are 102% for women and 109% for men. The average earliest possible retirement age is 58.5 years for women and 61.5 years for men.
Individuals in 2010 availed of the following pathways into retirement:
2 As shown in Table 1, a significant share of our retirees retired due to invalidity. In this paper, we are less interested in the actual situation of retirees, but in the frame the system provides. We do not consider invalidity pensions, but simulate an old-age pension for every person. In the descriptive statistics, we observe every person at the earliest age an old-age pension can be claimed. Thus, the numbers differ from the numbers shown in Table 1.
- Old-age pension (Alterspension): retirement age 60 for women, 65 for men;
- Long-term insured (Langzeitversichertenregel, “Hacklerregelung”): after 40 (women) and 45 (men) insurance years retirement at 55/60 without deductions3;
- Early old-age pension due to a long insurance period (vorzeitige Alterspension bei langer Versicherungsdauer): expiring rule allowing early retirement with deductions;
- Flexible retirement scheme (Korridorpension): early retirement at 62 with deductions after 37.5 insurance years; this retirement scheme is currently not relevant for women as their statutory retirement age lies below 60.4
In Table 2, we divide our sample according to the possible pathways into retirement; most women (55%) can enter retirement with an old-age pension. These women do not have enough insurance years to enter into other pathways. Accordingly, the average pension is lowest for this group at €940 per month. In contrast, only 8% of men have this pathway into retirement. For men, the most common pathway is the long-term insured pension (51%), whereas 37% of women in our sample can enter this pension form. For both men and women, pensions are highest with this pension form. This is easily explained as people having access to a long-term insured pension dispose of a stable employment career (of at least 40 or 45 years). We see that the expiring rule of an early old-age pension due to a long insurance period loses importance with only 8% of women and almost no men entering this pension form. The flexible retirement regulation becomes important for men (40%), while with the statutory retirement age still being 60, no women use this pathway.
3 The long-term insured pathway into retirement was subsequently changed, such that people born after 1954/1959 can retire only at 62/57 with deductions. For women, the age will go up with the statutory retirement age increasing to 65.
4 The requirements to enter a flexible retirement scheme were subsequently changed, asking for more insurance years. Furthermore, deductions were increased.
Table 2: Descriptive statistics of new pensioners in 2010
Number of
individuals
Earliest possible retirement age
Pension amount (2014 Euro)
Gross replacement rate – last income*
Gross replacement rate – average income*
Women 7,931 58.5 1,231 68% 102%
Old-age pension 4,330 60.2 940 68% 93%
Long-term insured 2,943 56.1 1,616 66% 114%
Early old-age pension due to a long insurance period
648 57.9 1,414 83% 106%
Flexible retirement
scheme - - - - -
Men 7,069 61.5 2,043 78% 109%
Old-age pension 560 65.1 1,091 75% 78%
Long-term insured 3,615 60.5 2,347 77% 117%
Early old-age pension due to a long insurance
period 29 62.4 1,806 70% 95%
Flexible retirement
scheme 2,862 62.0 1,847 80% 106%
* Reference is the individual’s income. Incomes are truncated at the social contribution ceiling.
Source: IREA (2015), own calculations.
3.2. Distributional Effects
The APG did not only bring differences in the pension calculation. Additional reforms changed early retirement access such that the earliest possible retirement age is different in the 2010 legislation than in the APG legislation when completely due.5 The same is true for the NDC system we analyse: here, retirement is possible from 55 onwards for men and women – of course, with appropriate changes in pension height. To analyse the distributional effects for different pension systems, it is, however, necessary to compare them at identical
5 The statutory retirement age of women will be 65. Access to the long-term insured pension is only at age 62. The early old-age pension due to a long insurance period ceases to exist.
retirement ages. Thus, we calculate the earliest possible retirement age in the APG system and apply this to all scenarios. We use IREA to simulate the working careers and calculate the individual pension claims. We calculate the individual pensions due to accumulated entitlements only and exclude supplements for low pensions to achieve the minimum pension level.
Applying the employment and retirement patterns in all scenarios implies that the career patterns of the individuals do not change because of the new pension system. We are fully aware that this assumption does not match reality. For this reason, we see our analysis more as a calculation exercise examining the distributional effects of the different pension systems and not as an exact rebuild of the Austrian reality. Nevertheless, our approach allows us to study the distributional effects of the different systems in detail.
We use the APG system as the benchmark case because it is enacted legislation in Austria.
We study distributional effects for the status quo system, the APG system, and a simple NDC system. Furthermore, we calculate this same NDC system considering only the insurance months due to employment, and setting aside pension benefits that are not related to individual contributions. For all scenarios, we provide additional descriptive statistics.
The distributional effects are measured via the Net SSW as given in Equation 1 and reported in Net SSW Ratio as given in Equation 2. Again, for a given internal rate of return,6 a Net SSW Ratio of zero indicates an actuarially fair pension. A positive Net SSW Ratio indicates a positive redistribution from the younger generation (current contribution payers and taxpayers) and current taxpayers. A negative Net SSW Ratio indicates a negative redistribution. The Net SSW Ratio shows how much the present value of future pensions is higher or lower than the present value of the contributions.
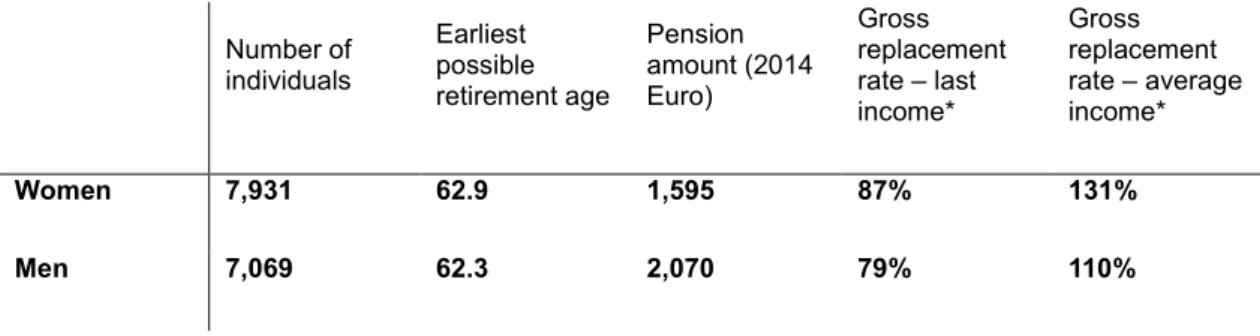
3.2.1. The Status Quo
The situation for new pensioners in the status quo is quite comfortable. The average pension is €1,595 for women and €2,070 for men. The gross replacement rates in regard to the last (average) income are 87% (131%) for women and 79% (110%) for men (Table 3).7
6 We choose 1%.
7 Compared to Table 2, the numbers are higher as we calculate the pension claims at a later retirement age (+4.4 years for women and +0.8 years for men).
Table 3: Descriptive Statistics Status Quo
Number of individuals
Earliest possible retirement age
Pension amount (2014 Euro)
Gross replacement rate – last income*
Gross replacement rate – average income*
Women 7,931 62.9 1,595 87% 131%
Men 7,069 62.3 2,070 79% 110%
* Reference is the individual’s income. Incomes are truncated at the social contribution ceiling.
Source: IREA (2015), own calculations.
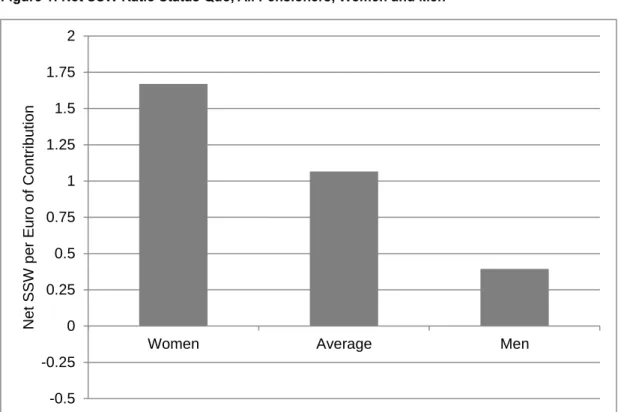
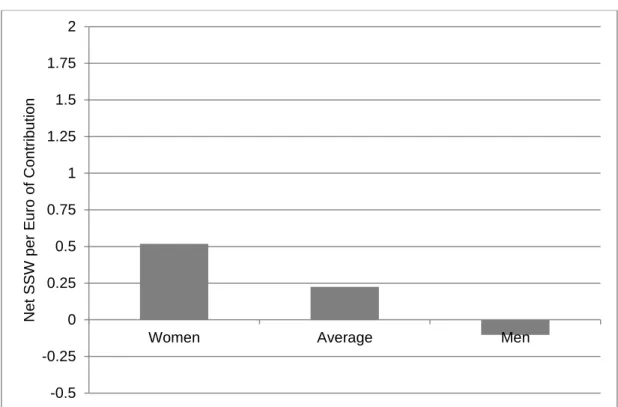
The average Net SSW Ratio is about 1 in the status quo scenario (Figure 1). A Net SSW Ratio of 1 indicates a substantial positive redistribution effect of 100% from current contribution payers and current taxpayers toward current pensioners. For every Euro today’s pensioners have contributed to the pension system, they receive €2.00. Current taxpayers have to bear the federal subsidy, while future generations have to bear the high pension entitlements of today’s pensioners.
A further gender-specific investigation shows that the effect is much more pronounced for women (Figure 1). The Net SSW Ratio is 1.67. A higher ratio is expected because only the best 15 years within the pension system were considered for the calculation of the monthly pension. Women often have no consistent employment careers; thus, they pay fewer contributions during their work life but are rewarded for their best working years. Additionally, women retire earlier and live longer than men. In contrast, men only got a Net SSW ratio of 0.4.
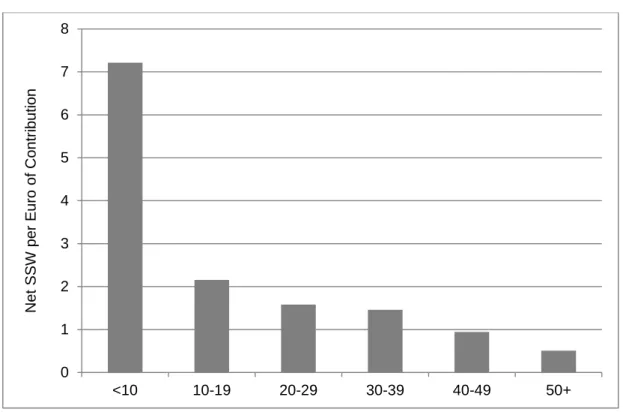
The relatively more favourable treatment of people with just a few contribution years also becomes very clear when studying the Net SSW Ratio in relation to the years of contributions (Figure 2). Especially, people who contributed less than 10 years to the pension system benefit strongly. The total value of benefits they obtain is 7.2 times larger than the total value of contributions they paid. However, for the next group (10 to 19 years of contributions), the Net SSW Ratio decreases to 2.15. For groups with more years of contributions, the Net SSW Ratio decreases further. For people with more than 50 years of contributions, the Net SSW decreases to 0.51.
Also, people with a relatively small income benefit in the status quo. In particular, people with a lifetime income in the lowest 10% of the lifetime income distribution of our sample benefit the most by far. The total value of benefits is about 3.5 times higher than the total value of
contributions. With increasing income, the Net SSW Ratio decreases drastically. For example, the Net SSW Ratio for people in the fifth 10% quantile is 0.87 (Figure 3).
Women and people with fewer years of contributions and low incomes benefit the most in the status quo. However, the redistribution is positive for all groups considered. This means there is a large intergenerational redistribution effect from current contribution payers and current taxpayers to current retirees.
Figure 1: Net SSW Ratio Status Quo, All Pensioners, Women and Men
Source: IREA (2015), own calculations.
-0.5 -0.25 0 0.25 0.5 0.75 1 1.25 1.5 1.75 2
Women Average Men
Net SSW per Euro of Contribution
Figure 2: Net SSW Ratio Status Quo, Years of Contribution
Source: IREA (2015), own calculations.
Figure 3: Net SSW Ratio Status Quo, Lifetime Income (10% Quantiles)
Source: IREA (2015), own calculations.
0 1 2 3 4 5 6 7 8
<10 10-19 20-29 30-39 40-49 50+
Net SSW per Euro of Contribution
-0.5 0 0.5 1 1.5 2 2.5 3 3.5 4
1 2 3 4 5 6 7 8 9 10
Net SSW per Euro of Contribution
3.2.2. The New Pension System APG
Since 2005, for all people born after 1 January 1955, the insurance periods are calculated due to the new pension system (APG, “pension account”8). However, long transition periods apply. Introduction of the system foresaw that, at retirement, two pensions are calculated:
one applying the old system, one applying the new system. The actual pension is then a weighted average of both pensions, with the share of insurance months before and after 2005 operating as weights. With this system of parallel calculation, however, the benefit of larger transparency in the pension account system would only start in late 2040. Therefore, another reform in 2012 changed the way the pension is calculated. Instead of applying two parallel systems at retirement, all claims prior to 2014 are transferred to the account. Thus, every individual can see his or her current pension entitlement when looking at his or her pension account. However, with this reform, the pension levels were not changed, such that the new rules are still entirely valid only for people born after 1990. For the others, the pension size is a mixture between the old and new system.
An example makes the pension calculation possibly more illustrative. Imagine a person born in 1960 who started to work in 1980 with a monthly income of €1,500. This income increases by 2% annually in real terms. The person works continuously until retiring at age 65. The new APG pension system would foresee a monthly gross pension of €1,950. The old system foresaw a monthly gross pension of €2,294. The actual pension will be €2,089. The transition system attenuates the pension cut of 15% foreseen by the APG to 9%. The attenuation is stronger for people born earlier and weaker for people born later.9
In this paper, we are not interested in the transition period. We want to compare the status quo system with the new system, even if it is only fully in force in future years. Therefore, we act as if the new regulations have been fully implemented and take into account all periods of insurance, including those prior to 2005, as insurance periods in the new APG system.
Another transition process concerns the statutory retirement age of women. Beginning in 2024, it increases by half a year each year such that, by 2033, the statutory retirement age is 65 for both men and women. In the following scenario, we again do not consider the transition, but act as if the statutory retirement age of women was already 65. As mentioned above, we do not consider invalidity pensions. In reality, of course invalidity pensions are still possible.
Table 4 shows the descriptive statistics for this simulation of an APG fully in force. With the same employment pattern and retirement behaviour as assumed in Table 3, the average
8 From the beginning of the working career, the future entitlements are noted on a fictive account.
9 These numbers are only true for this example of a person with a steady insurance career. For people with interrupted insurance careers, the pension cut due to APG is larger, as will be shown in the following pages. For more information on pension calculations see Pensionsversicherungsanstalt (2015b).
pension amount as well as the gross replacement rates drop significantly compared to the status quo. The average pension amount is €1,152 for women and €1,651 for men. These values correspond to a gross replacement rate concerning the last income of 68% for women and 64% for men and a gross replacement rate concerning the average income of 98% for women and 89% for men.
Table 4: Descriptive statistics APG
Number of
individuals
Earliest possible retirement age
Pension amount (2014 Euro)
Gross replacement rate – last income*
Gross replacement rate – average income*
Women 7,931 62.9 1,152 66% 98%
Men 7,069 62.3 1,651 63% 89%
* Reference is the individual’s income. Incomes are truncated at the social contribution ceiling.
Source: IREA (2015), own calculations.
In the new APG system, the redistribution effect becomes smaller for men and women. The average Net SSW Ratio is about 0.7. For every Euro contributed, there is a pension benefit of €1.70. There are still huge differences between men and women (Figure 4). The Net SSW Ratio for women is 1.16, whereas it is 0.19 for men.
Also, the redistribution for the different groups of contribution years and for the different lifetime-income quantiles declined. In the APG, there is still an immense redistribution towards people with only a few years of contributions (Figure 5). With less than 10 contribution years, the Net SSW Ratio is 7.98. This group consists of mostly women, so this high redistribution coefficient might be driven by the relatively high share of contribution years because of child-rearing periods. With more contribution years, the Net SSW Ratio again drops drastically. Compared to the status quo scenario, the Net SSW Ratio in the APG is lower for all groups with more than 10 years of contributions.
Analogous to the status quo, the redistribution also decreases in the APG for all groups with the lifetime income. For the top 50% of the income distribution, the Net SSW Ratio is below 0.3. For the highest 20% of the lifetime income distribution, we find basically actuarial fairness. For the highest 10% quantile, the Net SSW Ratio is even negative with a value of - 0.06 (Figure 6).
Figure 4: Net SSW Ratio APG, All Pensioners, Women and Men
Source: IREA (2015), own calculations.
Figure 5: Net SSW Ratio APG, Years of Contribution
Source: IREA (2015), own calculations.
-0.5 -0.25 0 0.25 0.5 0.75 1 1.25 1.5 1.75 2
Women Average Men
Net SSW per Euro of Contribution
0 1 2 3 4 5 6 7 8
<10 10-19 20-29 30-39 40-49 50+
Net SSW per Euro of Contribution
Figure 6: Net SSW Ratio APG, Lifetime Income (10% Quantiles)
Source: IREA (2015), own calculations.
3.2.3. NDC System
Since the 1990s, several countries have introduced an NDC pension system (Holzmann et al., 2012, 2013). Probably, the most famous NDC system was introduced in Sweden (Könberg et al., 2006; Schoyen and Stamati, 2013; Swedish Pensions Agency, 2014). An NDC system is a PAYGO pension system with notional accounts that follows two principles.
First, the relative position in the monthly pension benefit distribution is directly linked to the relative height of pension contributions over the years. Second, the same contributions lead to the same pension entitlements. The individual entitlements are accumulated on the individual notional account. At the time of entering retirement, the individual pension is calculated based on the individual account. An NDC system is actuarially fair, and to ensure this, life expectancy is taken into account to calculate the monthly pension benefit.
We use the Swedish system as a model for a simple NDC system for Austria. The Swedish system has a fixed contribution rate of 18.5%, of which 16% is contributed to the NDC system, and the remaining 2.5% to a funded system. For our adaptation, we use the respective currently valid contribution rates in Austria and do not consider a funded system.
In the Swedish system, the individual pension entitlements as well as the individual monthly pension is indexed with the annual growth rate of the consumer price index and the annual growth rate of gross wages per capita. We apply the same indexation in our NDC scenario.
-0.5 0 0.5 1 1.5 2 2.5 3 3.5 4
1 2 3 4 5 6 7 8 9 10
Net SSW per Euro of Contribution
In our scenario, the monthly pension is calculated by dividing the individual accumulated accounts by an individual annuity divisor. We use the conditional life expectancy of men and women at the time of retirement as the annuity divisor.10 In order to achieve a unisex life expectancy, we compute the weighted average of the two conditional life expectancies using the share of the sexes in the population.
An NDC pension system is by construction self-financing. In a PAYGO pension system, today’s contributions are used to pay today’s pensions. If the budget is not balanced in the Swedish system, the financial burdens are distributed among contributors and pensioners.
Both groups have to accept deductions during the balancing, but there are no long-lasting level effects of the balancing. When balancing ends, the monthly pension is the same as it would have been without balancing.11 We do not simulate the balancing mechanism for Austria due to data limitations. Thus, in our NDC scenario, we focus on whether or not the individual pension is funded by individual contributions. We do not consider whether the total pension expenditures are in line with total pension contributions.
Furthermore, we include all pension benefits not covered by individual contributions as they are in the current pension system, e.g. child-rearing. We apply the Swedish flexible retirement age. In our simulation, it is possible to retire between 55 and 70 with an accordingly adjusted annuity divisor. In contrast to Sweden, we do not allow for partly pensions while still working. We also use the Austrian regulations concerning child-rearing periods.
In contrast to the APG system, the pension level is significantly lower. The average pension amount is €794 for women and €1,188 for men. The gross replacement rates of the last income are 45% for both men and women. The replacement rate of the average income is 67% for women and 63% for men (Table 5).
10 Specifically, we use the conditional life expectancy of men and women of the birth cohort of 1955 reported for the year 2011 (Statistik Austria, 2015).
11 In times with an unbalanced budget, the indexations of the individual accounts as well as the indexations of monthly pensions are attenuated. Balancing is active as long as the so-called balance index is smaller than 1. The balance index is the product of the income index and the so-called balance ratio. The balance ratio is the relation of the asset of contributions plus the asset of the pension buffer fund to the pension liability. The balancing attenuates the pension liability and, therewith, increases the balancing ratio. Since the balancing ends only when the balance index is again at least 1, the value of the individual account and the value of the monthly pensions are at the same value as they would have been without balancing.
Table 5: Descriptive statistics NDC
Number of
individuals
Earliest possible retirement age as in APG
Pension amount (2014 Euro)
Gross replacement rate – last income*
Gross replacement rate – average income*
Women 7,931 62.9 794 45% 67%
Men 7,069 62.3 1,188 45% 63%
* Reference is the individual’s income. Incomes are truncated at the social contribution ceiling.
Source: IREA (2015), own calculations.
As expected, there is much less redistribution in the NDC system. The average Net SSW Ratio is just 0.23. The Net SSW Ratio of women is 0.52 whereas it is -0.10 for men (Figure 7). The negative redistribution effect for men is driven by the unisex life expectancy. Their pension is calculated with the unisex life expectancy, but their gender-specific life expectancy is lower. For women, the effect of the unisex life expectancy is the reverse.
The redistribution effect towards people with only a few years of contributions also decreases drastically. The Net SSW Ratio for people with less than 10 years of contributions in the NDC scenario is 5.2. All other groups show a Net SSW Ratio below 1. For people with more than 50 years of contributions, the ratio is even negative with a value of -0.1 (Figure 8).
Concerning lifetime incomes, there is a strong redistribution effect from high income earners towards low income earners. For the top 50% of the income distribution, the Net SSW Ratio is negative, whereas it is positive for the bottom 50% of the distribution. This redistribution is because of the higher lifetime income of men, who are penalized by the unisex life expectancy. Furthermore, more people with low lifetime incomes benefit from pension benefits not covered by individual contributions. The strongest redistribution effect is still towards people in the bottom 10% of the income distribution, but the Net SSW Ratio, with a value of 1.94, is far smaller than in the previous scenarios (Figure 9).
This simulation highlights that with a simple NDC system for Austria, the indirect redistribution can be drastically reduced. At the same time, the average pension levels would decline. To compensate that explicit redistribution is needed.
Figure 7: Net SSW Ratio NDC, All Pensioners, Women and Men
Source: IREA (2015), own calculations.
Figure 8: Net SSW Ratio NDC, Years of Contribution
Source: IREA (2015), own calculations.
-0.5 -0.25 0 0.25 0.5 0.75 1 1.25 1.5 1.75 2
Women Average Men
Net SSW per Euro of Contribution
-1 0 1 2 3 4 5 6 7 8
<10 10-19 20-29 30-39 40-49 50+
Net SSW per Euro of Contribution
Figure 9: Net SSW Ratio NDC, Lifetime Income (10% Quantiles)
Source: IREA (2015), own calculations.
3.2.4. Pure NDC System
To separate the intended explicit redistributions from the implicit redistributions within the pension system, we also simulate the NDC system for Austria without pension claims because of child-rearing periods, civil and military service, illness and unemployment.
Excluding pension benefits which are not due to individual contributions, the average pension amount decreases further significantly for women and slightly for men. The average pension is then €671 for women and €1,141 for men. The corresponding average gross replacement rates of the last income are 35% for women and 42% for men. The average gross replacement rates of the average income are 53% for women and 59% for men (Table 6).
-0.5 0 0.5 1 1.5 2 2.5 3 3.5 4
1 2 3 4 5 6 7 8 9 10
Net SSW per Euro of Contribution
Table 6: Descriptive statistics pure NDC
Number of
individuals
Earliest possible retirement age
Pension amount (2014 Euro)
Gross replacement rate – last income*
Gross replacement rate – average income*
Women 7,931 62.9 671 35% 53%
Men 7,069 62.3 1,141 42% 59%
* Reference is the individual’s income. Incomes are truncated at the social contribution ceiling.
Source: IREA (2015), own calculations.
As it should be, the pure NDC system is actuarially fair with an average Net SSW Ratio of close to zero. In our simulation, it is -0.07. For women, the Net SSW Ratio is slightly positive with a value of 0.06. For men, it is negative with a value of -0.2 (Figure 10).
In regard to years of contributions, the pure NDC system is actuarially fair. The Net SSW Ratio ranges between 0.13 for people with less than 10 years of contributions to -0.13 for people with more than 50 years of contributions (Figure 11). Also, for the lifetime income, the system is actuarially fair. The Net SSW Ratio ranges from 0.13 for the lowest 10% of the income distribution to -0.28 for the highest 10% of the income distribution (Figure 12).
A pure NDC system for Austria removes all redistribution within the pension system and is actuarially fair.
Figure 10: Net SSW Ratio Pure NDC, All Pensioners, Women and Men
Source: IREA (2015), own calculations.
Figure 11: Net SSW Pure NDC, Years of Contribution
Source: IREA (2015), own calculations.
-0.5 -0.25 0 0.25 0.5 0.75 1 1.25 1.5 1.75 2
Women Average Men
Net SSW per Euro of Contribution
0 1 2 3 4 5 6 7 8
<10 10-19 20-29 30-39 40-49 50+
Net SSW per Euro of Contribution
Figure 12: Net SSW Pure NDC, Lifetime Income (10% Quantiles)
Source: IREA (2015), own calculations.
3.3. Explicit and Implicit Redistribution
The fact that the presented pure NDC system removes all redistribution within the Austrian pension system enables us to disentangle the explicit and the implicit redistribution within the system. We study the explicit and implicit redistribution in the APG system, because it is the applicable pension system in Austria according to law.
How do we separate the implicit from the explicit redistribution? We showed that our simple pure NDC system is actuarially fair. Therefore, in the pure NDC system there are only pension benefits because of individual contributions. To calculate the whole redistribution in the APG system, we subtract the pure NDC pension from the APG pension. To calculate the implicit redistribution, we subtract from the whole redistribution the part of the pension which is not granted because of own contributions, e.g. child-rearing periods, military or community service. Table 7 shows our calculation procedure.
-0.5 0 0.5 1 1.5 2 2.5 3 3.5 4
1 2 3 4 5 6 7 8 9 10
Net SSW per Euro of Contribution
Table 7: Calculation of implicit redistribution in the APG system
APG Pension - Pure NDC Pension
= Whole Redistribution within the APG Pension - explicit redistribution
= implicit redistribution
Source: own representation.
Figure 13 shows the average implicit and explicit redistribution for all pensioners, women and men. The average individual contribution to pension benefits in the APG system is €893.
On average, the implicit redistribution is €360 and the explicit redistribution is €131. For women, the implicit redistribution is €289 and the explicit redistribution is €187. For men, the implicit redistribution is larger (€439) in absolute values, whereas the explicit redistribution is smaller (€68). Table 8 shows that the relative share of the implicit redistribution on the total individual pension is pretty much the same for men and women. The implicit redistribution is proportional to the individual contribution. The explicit redistribution is higher for women due to child-rearing periods.
Figure 13: Explicit and Implicit Redistribution, All Pensioners, Women and Men
Source: IREA (2015), own calculations.
0 200 400 600 800 1000 1200 1400 1600 1800
Women Average Men
Euro
Individual Contribution Explicit Redistribution Implicit redistribution
Table 8: Relative shares of individual contributions and redistribution on the individual pension, all pensioners, women and men
Women Average Men
Individual contribution 58% 65% 69%
Explicit redistribution 16% 9% 4%
Implicit redistribution 25% 26% 27%
Source: IREA (2015), own calculations.
People with less than 10 years of contributions receive the highest explicit redistribution. On average, they receive €372 of explicit redistribution. This amount decreases to €54 in the group of people with more than 50 years of contributions. Pension benefits due to individual contributions increase from €115 to €1,185. The implicit redistribution increases with the years of contributions from €45 to €526 (Figure 14). In the group with less than 10 years of contributions, with 70%, explicit redistribution is by far the most important component of the individual pension. For people with more than 50 years of contributions, the share is negligibly small with 3%. The share of individual contributions on the individual pensions increases with years of contributions from 22% to 67%. Analogously, the share of implicit redistribution increases from 8% to 30% (Table 9).
Figure 14: Explicit and Implicit Redistribution, Years of Contribution
Source: IREA (2015), own calculations.
0 200 400 600 800 1,000 1,200 1,400 1,600 1,800 2,000
<10 10-19 20-29 30-39 40-49 50+
Euro
Individual Contribution Explicit Redistribution Implicit Redistribution