The World Bank Group
Promoting Nature-Based Tourism for
Management of
Protected Areas and
Elephant Conservation in Sri Lanka
69084
Public Disclosure Authorized Public Disclosure Authorized Public Disclosure Authorized Public Disclosure Authorized
Table of Contents
Chapter 1 Introduction and Context ... 7
1 Introduction ... 7
Chapter 2 Nature-Based Tourism: Prospects and Potential ... 10
2.1 Introduction ... 10
2.2 Tourism in Sri Lanka ... 10
2.3 The Approach ... 14
2.4 The Economic Impacts of Tourism: Spending Patterns ... 16
2.5 Economic Impact of Nature Tourism ... 17
2.6 Increasing the Economic Impact of Nature Tourism ... 20
2.7 Opportunities for Financing National Parks and Forest Reserves ... 24
2.8 Revenue Leakages ... 30
2.9 Conclusions ... 31
Chapter 3 The Impediment to Elephant Conservation around Yala National Park—The Human-Elephant Conflict………33
3.1 Introduction: Tourism and Conservation ... 33
3.2 The Approach ... 34
3.3 The Anatomy of Households and Livelihood Activities ... 37
3.4 Human-Elephant Interactions ... 43
3.5 Local Benefits of Tourism and Opportunities for Financing Conservation ... 47
3.6 The Human-Elephant Conflict around Yala National Park, Sri Lanka: Conclusions ... 49
Chapter 4 Conclusion ... 52
4.1 Revenue Potential from Nature-Based Tourism ... 52
4.2 The Impediment to Elephant Conservation—Human-Elephant Conflict... 53
References ... 54
Boxes Box 2.1 Willingness to pay ... 25
Box 2.2 Development scenarios for the parks/reserves ... 27
Box 3.1 Survey Design ... 35
Box 3.2 Chena cultivation and optimal habitats for elephants ... 40
Figures
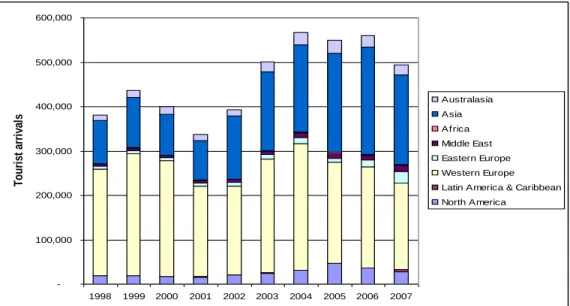
Figure 2. 1 International tourist arrivals to Sri Lanka, 1998-2008 ... 11
Figure 2.2 Tourist arrivals by region, total ... 11
Figure 2.3 Tourist arrivals by region, percent ... 12
Figure 2.4 Perceptions of park attributes... 22
Figure 2.5 Percentage of park visitors who would return to Sri Lanka ... 24
Figure 2.6 International park tourists’ willingness to pay park entrance fees ... 25
Figure 2.7 International nonpark tourists’ willingness to pay park entrance fees ... 26
Figure 2.8 Local park tourists’ willingness to pay park entrance fees ... 28
Figure 2.9 Local nonpark tourists’ willingness to pay park entrance fees ... 28
Figure 3.1 Tenure rights on land where chena occurs in areas adjoining YNP ... 38
Figure 3.2 Tenure rights on other land where chena occurs ... 38
Figure 3.3 Chena land use ... 38
Figure 3.4 Percentage of farmers engaged in seasonal chena cultivation ... 39
Figure 3.5 Seasonality of elephant problems ... 44
Tables Table 2.1 Visitation at major attractions ... 13
Table 2.2 Public sector revenue from tourism (in SL Rs millions) ... 14
Table 2. 3 Distribution of tourists, by type and location ... 15
Table 2.4 Number of international tourists by country of residence and purpose of visit, 2007 ... 16
Table 2.5 Tourist expenditures per person, excluding airfare ... 17
Table 2.6 Breakdown of expenditures per person per trip ($) ... 17
Table 2.7 Direct and indirect economic impact of nature-based tourists in 2007
1... 18
Table 2.8 Economic impacts of nature-based tourism spending in 2007 ... 19
Table 2.9 Overall site satisfaction by park tourists, percent ... 21
Table 2.10 Current and potential fees from visitors to National Parks/ Forest Reserves ... 30
Table 3.1 Details of sample allocation and coverage ... 35
Table 3.2 Characteristics of chena cultivation ... 39
Table 3. 3 Household characteristics ... 41
Table 3.4 Average income from different economic activities ... 42
Table 3.5 Main issues facing chena cultivation ... 42
Table 3.6 Attributes of elephant encounters ... 43
Table 3.7 Determinants of the likelihood and frequency of elephant encounters ... 44
Table 3.8 HEC-related mitigation expenditures undertaken by farmers (values in SL Rs and percentage of households with positive expenditures in brackets) ... 45
Table 3.9 Effectiveness of electric fences (all values in percent) ... 46
Table 3.10 Determinants of HEC losses ... 47
Table 3.11 Tourism employment and income in the survey area
1... 48
Table 3.12 Breakdown of expenditures per person (US$) ... 48
Table 3.13 Revenue generation potential in YNP ... 49
Annexes Annex 1: A Stylized Model of HEC without Elephant Dynamics ... 55
Annex 2: Table A2.1 Tourist arrivals by country of residence & purpose of visit - 2007 ... 57
Annex 3 Tourist survey design and methodology ... 59
Annex 4 Tourist survey, 2008 ... 61
Annex 5 Perceptions of the HEC and tourism-related benefits ... 72
SUMMARY
The Government of Sri Lanka’s ten-year development framework aims at accelerating growth while ensuring a path of sustainable development and prioritizing conservation of the country’s natural heritage. In line with these priorities this study focuses on promoting nature-based tourism for enhancing protection of natural assets, in particular elephants which are a flagship species while promoting growth in the tourism industry. The study identifies development opportunities that increase tourism revenues and offers an assessment of the human elephant conflict which is the primary impediment to long term elephant conservation.
Tourism has remained a resilient contributor to the economy of Sri Lanka. With improved promotion and niche markets that capitalize upon the country’s rich natural assets, tourism’s contribution to the economy could increase substantially. An assessment based on a tourism survey conducted in a small cluster of national parks in the Southern Province indicates potential for increased revenue from nature-based tourism in Sri Lanka which could contribute towards conservation of the protected areas and flagship species such as the elephant.
The current pattern of tourism does not capitalize on the country’s potential and comparative advantage. Expenditure patterns that emerged from the survey indicate that travelers who visit the country are typically on a tour package and spend meager amounts compared to individual (non- package) traveler. The highest spending tourists are those who visit national parks and are non- package travelers. Of the surveyed international travelers, over 76 percent were on packaged tours, and among them, 96 percent of the packages were purchased outside Sri Lanka. These findings have policy implications for the country and suggest that incentives to promote individual travel, which could create high-value niche markets, raise revenue from the sector, and possibly decrease revenue leakages by reducing the number of foreign-purchased travel packages.
Another simple method of increasing tourism revenue would be through increasing the average length of a tourist’s stay. With almost 70 percent of tourists identifying “pleasure” (e.g., recreation, sun-and- sand, cultural, natural, wildlife tours) as their main reason for travel, increasing a nature tourist’s duration in Sri Lanka could be accomplished through better marketing of its national parks. Currently the vast majority of tourists do not visit the parks, but the survey reveals a strong willingness to add a park visit to their trip.
Along with better marketing, improved conditions of the national parks (e.g., less traffic congestion,
improved infrastructure facilities, more shopping opportunities, and diverse activities) have the
potential to increase tourism revenue. To assess the scope for raising additional revenue, the tourist
survey was used to ask nature tourists their willingness to pay park entrance fees (1) to enjoy the
national parks as they currently stand and (2) for specific improvements in the park. Results from the
survey indicate that both international and local tourists are willing to pay higher than their current
entrance fees, for park improvements as well as for the parks’ current conditions. The findings imply
that simply imposing a 30 percent increase on park entrance fees would result in an increase in park
revenues of more than $369,000 per year (in a subset of the surveyed parks). With improved park
conditions and with a more proactive tourism initiative that encourages current nonpark tourists to
visit, entrance fee revenues have the potential to increase to more than $6 million annually,
representing over $55 million in 10 years.
Elephant Conservation and the Human-Elephant Conflict
Tourists visit Sri Lanka’s parks mainly to view the charismatic and celebrated wild elephants that form the backbone of Sri Lanka’s nascent ecotourism industry. Currently Sri Lanka provides the best opportunities of viewing wild Asian elephants in the world. While there is vast scope to capitalize on this natural tourist asset, there are serious conservation challenges that need to be addressed for its full economic potential to be realized. Elephants have large home ranges that are not adequately provided for by protected areas and national parks, and they are edge species that prefer the vegetation found in degraded and secondary forest habits. Consequently, more than two-thirds of the wild elephant population is found outside of protected areas, grazing on agricultural lands and disturbing and threatening the livelihoods of local farmers, chena households in particular. This friction between humans and elephants, termed human-elephant conflict, presents a development challenge between supporting the livelihoods of those living in close proximity to national parks and conserving Sri Lanka’s flagship species, the wild elephant. Furthermore, this study finds that the local residents who suffer the consequences of living near elephants receive only a small share of the benefits accrued from the nature-based tourism industry that thrive on wild elephants. Policy makers are thus confronted with the challenge of developing strategies that link local benefits to the nature tourism industry.
The study suggests there is great potential in devising strategies that build on development opportunities in nature tourism, particularly those that ensure the conservation of wild elephants and their habitats while alleviating the human-elephant conflict. Improving park management and locating fences along ecological rather than administrative boundaries can minimize human-elephant interactions. Healthy elephant herds can boost ecotourism opportunities, adding value to local parks;
the increased revenue generated can be used to compensate farmers located near elephant habitats who inevitably experience losses. Results from a livelihood survey conducted among 800 households in the vicinity of Yala National Park indicate that the cost of mitigation measures (e.g., electric fences, firecrackers, shouting) used to defend crops against wild elephants are quite low, as are the realized crop losses. These findings suggest that a compensation scheme may be successful in facilitating a flow of benefits to local communities while also ensuring the conservation of wild elephants.
In short the study indicates that elephants remain a considerable economic asset to Sri Lanka and there is
much scope to increase their economic contribution through humane and judicious environmental
stewardship, rather than environmental destruction.
Chapter 1 Introduction and Context
1 Introduction
1. Sri Lanka has a tradition of conservation dating back more than 2,000 years, to a time when edicts called for the preservation of wildlife in defined areas. Village communities systematically organized their landscape, locating irrigation tanks and cultivated areas in low-lying land and their settlements at higher levels. Catchments in hilly areas were left under forest cover. The value of the nation’s biodiversity has not gone unrecognized in recent times, as governments enacted laws aimed at the protection of biological resources. With the highest biodiversity per unit area in Asia, Sri Lanka is ranked as a global biodiversity hot spot.
12. Despite its efforts, the country is currently confronted with serious degradation of its ecosystems and the biodiversity they host. According to a recent survey, 33 percent of Sri Lanka’s inland vertebrate fauna and 61 percent of its flora are threatened. Around 33 percent of the threatened biodiversity is endemic to Sri Lanka. Twenty-one species of endemic amphibians have not been recorded during the past 100 years, and these species could, for most purposes, be considered extinct.
One in every 12 species of inland indigenous vertebrates of Sri Lanka is currently facing an immediate and extremely high risk of extinction in the wild.
2Experts suggest that this trend will continue unless more systematic and stringent corrective measures are taken.
3. The Government’s 10-year development framework aims at accelerating growth with an emphasis on equitable development. At the same time, it gives priority to a “land in harmony with nature.”
3The framework commits Sri Lanka to a path of sustainable development and identifies the country’s unique biodiversity as part of the country’s natural heritage and a high conservation priority.
Protection of the environment is observed in Sri Lanka, although not as comprehensively as needed. Sri Lanka was the first country in Asia to prepare a national environmental action plan. The original 1992 plan was subsequently updated as the document “Caring for the Environment 2003–2007: The Path to Sustainable Development.” More than 80 legislative enactments related to environmental management are in place. The legislation led to the present system of protected areas that covers 14 percent of the country’s total land area. Though this is large by the standards of South Asia it is completely insufficient to ensure protection of the country’s natural heritage and provide the habitat needed for the protection of large iconic species such as Sri Lanka’s elephants and leopards. Sri Lanka also demonstrates a commitment to conservation in terms of administrative structure. The three government agencies directly responsible for environment and protected area (PA) management—the Department of Wildlife Conservation, Forest Department, and the Central Environmental Authority—
have remained within the ministry in charge of environment, despite the commonplace fragmentation of other sectors and ministries, until the recent election in April 2010 saw the Department of Wildlife
1
Biodiversity Conservation in Sri Lanka—A Framework for Action, Ministry of Forestry and Environment, 1998.
The concept of a biodiversity hotspot is due to the celebrated biologist Myers analysis and is now used globally to identify conservation areas at high risk. To qualify as a hotspot, a region must meet two strict criteria: it must contain at least 0.5 percent or 1,500 species of vascular plants as endemics, and it has to have lost at least 70 percent of its primary vegetation. Around the world, at least 25 areas qualify under this definition, with nine others possible candidates. These sites support nearly 60 percent of the world's plant, bird, mammal, reptile, and amphibian species, with a very high share of endemic species.
2
IUCN Sri Lanka and the Ministry of Environment and Natural Resources (2007), The 2007 Red List of Threatened Fauna and Flora of Sri Lanka, Colombo, Sri Lanka.
3
The Government’s framework called the Mahinda Chintana (MC): Vision for a New Sri Lanka was presented at
the Sri Lanka Development Forum in 2007.
Conservation (DWC) moved to the Ministry of Economic Development due to DWC’s potential for nature based tourism . Furthermore, all three institutions have recently undergone institutional reforms with a move toward decentralization and empowerment of field staff, market-based incentives, more accountability and transparency, and wider stakeholder participation in planning and decision making.
4. With undeveloped land becoming increasingly scarce, Sri Lanka’s natural forests and protected areas are under constant and unrelenting pressure. Despite reforms, conventional command-and- control approaches are becoming less and less effective in addressing these problems, since they do little to tackle the fundamental causes of environmental degradation. To address the root causes there is a need to create economic incentives for sustainability in ways that harmonize competing interests and create win-wins for conservation and poverty alleviation.
5. Experience in countries as diverse as Australia, New Zealand, Costa Rica, Tanzania, and Kenya has shown that if judiciously managed, nature-based tourism can play a crucial role in providing the resources and economic incentives needed for environmental stewardship. It presents an opportunity to go beyond simply mitigating the industry’s “footprint” by providing revenue for the management and conservation of natural assets. By generating local employment and growth, it can create additional constituencies in support of sustainability and harmonize potentially conflicting interests on the use of forests and biodiversity.
6. It is often argued that Sri Lanka is well endowed with natural assets and able to reposition itself as a more attractive tourist destination. The proximity and juxtaposition of national parks to cultural attractions and beaches presents an opportunity to forge new links of “nature, culture, and beaches”
and lure a more lucrative segment of the tourist market. Unlike its regional competitors, Sri Lanka has a uniquely high density of natural and cultural assets. These include the renowned “cultural triangle”
4and a rich array of “charismatic” and celebrated species, such as elephants and leopards that can form the basis of a highly lucrative ecotourism industry. Sri Lanka has the highest density of elephants in Asia and provides the best opportunities of viewing wild Asian elephants in the world, and Yala National Park is reported to have the highest density of leopards per unit area in the world. Globally, nature-based tourism is displaying a rate of growth far in excess of the beach and sun product lines.
And yet in Sri Lanka, less than 10 percent of foreign tourists ever visit any of the country’s national parks, which are considered to be among the best in Asia.
7. It is in this context that this policy note seeks to examine the scope for enhancing protection of Sri Lanka’s natural assets through nature based tourism as an instrument for conservation with a specific focus on elephant conservation. Nature based tourism is defined for the purposes of this study as tourism within the protected area network of the country. The study begins with a brief overview of the tourism sector and recent trends. It then reports on the results of a contingent valuation exercise that assesses the earning potential of the national parks sector as a tourism asset. This is followed by a more detailed analysis of human-elephant conflict and the scope for remedying the problem through revenues generated by tourism. A key objective is to explore two seemingly distinct , but in fact related issues - the extent of economic benefits that can be derived from conservation and determine ways of
4
Sri Lanka’s Cultural triangle is situated in the centre of the island and covers an area which includes the World
Heritage cultural sites of the Sacred City of Anuradhapura, the Ancient City of Polonnaruwa, the Ancient City of
Sigiriya, the Ancient City of Dambulla and the Sacred City of Kandy. Due to the constructions and associated
historical events, some of which are millennia old, these sites are of high universal value; they are visited by many
pilgrims, both laymen and the clergy (prominently Buddhist), as well as by local and foreign tourists.
addressing one of the main perceived problems and costs of elephant conservation – the human
elephant conflict.
Chapter 2 Nature-Based Tourism: Prospects and Potential
2.1 Introduction
8. Tourism is a significant contributor to the economy of Sri Lanka. It ranks fourth in the country in terms of foreign exchange earnings (US$384.4 million in 2007), employs more than 60,000 workers directly and perhaps as many as 300,000 indirectly, and accounts for more than 2.3 percent of gross domestic product (GDP). It is viewed as a growth sector whose contribution could substantially increase with improved promotion and the creation of niche markets that capitalize upon the country’s rich natural assets. The aim of this chapter is to explore the revenue potential and economic prospects of nature-based tourism in a small cluster of national parks in the Southern Province as an indicator of the potential for nature based tourism financing management of protected areas with a special emphasis on conservation of the Asian elephant which is a flagship species and the main attraction in protected areas. As in most developing countries, Sri Lanka too has limited funding for conservation of protected areas. However, if the natural asset base of the protected area network can be utilized to generate revenue through nature tourism towards management of the protected areas and the charismatic species living in the national parks, sustainable financing of conservation would not be a problem any longer.
9. The chapter begins with a brief overview of the industry and an analysis of the tourists who visit.
It identifies visitor perceptions of the nature-tourism experience in these parks and explores ways to further promote tourism opportunities in the national park system. The assessment is based on a tourism survey undertaken between October 2008 and January 2009 in four national parks (Bundala, Minneriya, Uda Walawe, and Yala) and one forest reserve (Singharaja). Section 2.2 then identifies the opportunities and challenges the Government may face in raising further revenue from these parks.
10. Nature-based tourism has direct impacts on the economy through tourist spending in the immediate vicinity of the park, as well as indirect effects through the many linkages between the tourism sector and the rest of the economy. These are captured through an input-output (I-O) matrix that provides estimates of the impacts of tourist spending on gross value-added, wages, and tax revenue.
511. The focus is largely on the most lucrative segment of the tourist market—international arrivals, which constitute the majority of revenues generated across a wide variety of activities and in numerous settings, including the national park system. Also included in the analysis are tourists who did not visit the parks. They represent the majority of tourist arrival to the country and are seen as an un-tapped source that could be harnessed in a first step of an overall tourism strategy for the country.
2.2 Tourism in Sri Lanka
12. Tourism in Sri Lanka has displayed considerable resilience to both conflict and natural disasters, such as the 2004 tsunami. The period between 2002 and 2004 was the high point for tourism, with arrivals reaching more than 500,000 per year by 2003. This trend began to reverse through 2005 and 2006 with the escalation of the civil war and the tsunami, which devastated the region. Still, numbers have not plunged to the lows of 1998 and 2001 (Figure 2.1).
5
Unfortunately, a similar matrix could not be constructed for employment.
Figure 2. 1 International tourist arrivals to Sri Lanka, 1998-2008
Source: Sri Lanka Tourism Development Authority (2004, 2005, 2006, 2007).
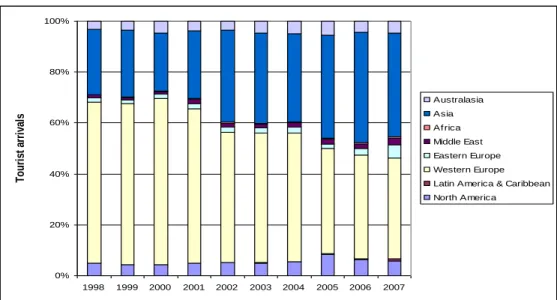
13. There is a gradual change in the geographic composition of tourist arrivals, with an ever- increasing number of visitors from South Asia. Figure 2.2 and Figure 2.3 present total arrivals by region. Significant and increasing shares are from Asia, while the numbers and portion of Western European arrivals have decreased; represented more than 60 percent in 1998 and a low of 40 percent by 2007. Fifty percent of the Asian arrivals are from India, and nearly half of the Western European arrivals are from the United Kingdom. This trend has been stable over time and is unlikely to change.
Other significant arrivals appear from the Maldives and Germany. Many of the other regions experienced only modest growth in terms of arrivals.
Figure 2.2 Tourist arrivals by region, total
Source: Sri Lanka Tourism Development Authority (2004, 2005, 2006, 2007).
- 100,000 200,000 300,000 400,000 500,000 600,000
1998 1999 2000 2001 2002 2003 2004 2005 2006 2007 2008
Tourist arrivals
- 100,000 200,000 300,000 400,000 500,000 600,000
1998 1999 2000 2001 2002 2003 2004 2005 2006 2007
Tourist arrivals
Australasia Asia Af rica Middle East Eastern Europe Western Europe Latin America & Caribbean North America
Figure 2.3 Tourist arrivals by region, percent
Source: Sri Lanka Tourism Development Authority (2004, 2005, 2006, 2007).
14. The main reason for travel, according to a resounding 67 percent of respondents, is “pleasure,”
which includes recreation, sun-and-sand, spas, cultural, natural, ecotourism, and wildlife tours (Annex 2: Table A2.1). This is true even with the negative backdrop of the war. Recommendations by friends or family and package deals rounded off the top reasons for visiting Sri Lanka, which also provides evidence that prior experience is important and that tour operators feel confident in packaging Sri Lanka with other places of interest. The vast majority arrive on a package tour and spend 8 to 14 days, with the median visitor moving closer to the 14-day mark. Repeat visits are common too. Those who stayed for 1 to 3 nights in the past were staying a bit longer, and some were staying beyond three weeks. The data indicate that the “two-week rule” was even more pronounced, with more than half of the respondents claiming trips with an 8 to 14 day interval.
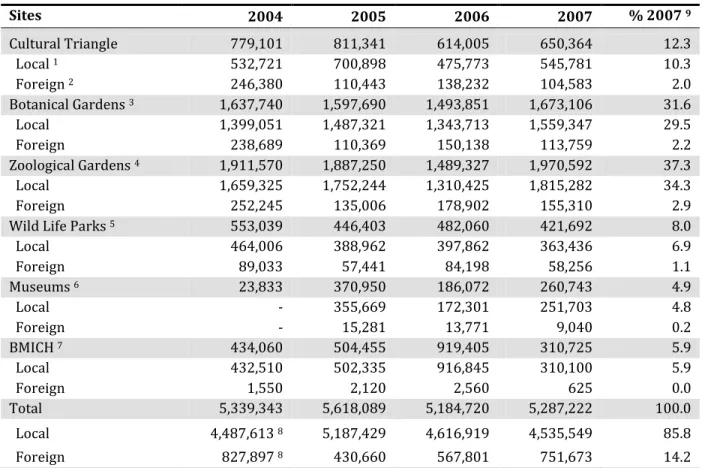
15. Beyond the beaches, the most visited sites are the zoological and botanical gardens. These are followed by trips to the Cultural Triangle, which include tours of ancient cities, tanks (man-made reservoirs), and spiritual sites (Table 2.1). The next most frequented sites, by locals and foreigners alike, are the wildlife parks on safari-like experiences featuring observation of elephants, leopards, exotic birds, reptiles, and marine biodiversity. Site preferences have remained fairly stable over time.
Of the noticeable patterns, visitation to wildlife parks appears to have fallen since 2004, whereas visits to museums have risen dramatically. Conferences in the capital, Colombo, also provide important visitor activities, albeit primarily for the local population.
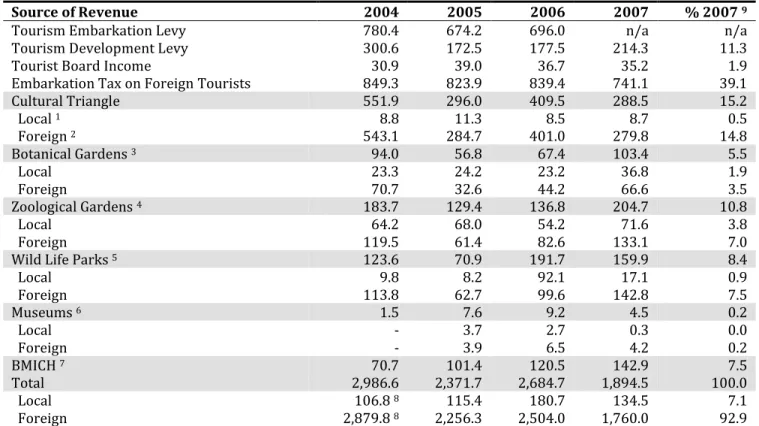
16. Increasing visitation is the first step in fostering greater income from the tourism sector; the next is increasing the expenditures of tourists. Table 2.2 summarizes visitor information in terms of the revenue generated from these tourism activities.
6The most striking observation is that the majority of public revenues are generated from international tourists, with levies and taxes comprising over half of
6
Note that, strictly speaking, the totals in the table should not include revenue from the local population— since spending by the local population is just a redistribution of wealth and not new money coming into the economy from abroad.
0%
20%
40%
60%
80%
100%
1998 1999 2000 2001 2002 2003 2004 2005 2006 2007
Tourist arrivals
Australasia Asia Af rica Middle East Eastern Europe Western Europe Latin America & Caribbean North America
the annual revenue. Under the current pricing regime, foreign tourists are responsible for nearly 93 percent of the revenues generated by these tourist activities.
Table 2.1 Visitation at major attractions
Sites 2004 2005 2006 2007 % 2007
9Cultural Triangle 779,101 811,341 614,005 650,364 12.3
Local
1532,721 700,898 475,773 545,781 10.3
Foreign
2246,380 110,443 138,232 104,583 2.0
Botanical Gardens
31,637,740 1,597,690 1,493,851 1,673,106 31.6
Local 1,399,051 1,487,321 1,343,713 1,559,347 29.5
Foreign 238,689 110,369 150,138 113,759 2.2
Zoological Gardens
41,911,570 1,887,250 1,489,327 1,970,592 37.3
Local 1,659,325 1,752,244 1,310,425 1,815,282 34.3
Foreign 252,245 135,006 178,902 155,310 2.9
Wild Life Parks
5553,039 446,403 482,060 421,692 8.0
Local 464,006 388,962 397,862 363,436 6.9
Foreign 89,033 57,441 84,198 58,256 1.1
Museums
623,833 370,950 186,072 260,743 4.9
Local - 355,669 172,301 251,703 4.8
Foreign - 15,281 13,771 9,040 0.2
BMICH
7434,060 504,455 919,405 310,725 5.9
Local 432,510 502,335 916,845 310,100 5.9
Foreign 1,550 2,120 2,560 625 0.0
Total 5,339,343 5,618,089 5,184,720 5,287,222 100.0
Local 4,487,613
85,187,429 4,616,919 4,535,549 85.8
Foreign 827,897
8430,660 567,801 751,673 14.2
1 – Includes Alahana Museum, Jethavana Museum, Abeygiriya Museum, Dambulla (Museum). and Sigiriya.
2 – Includes Anuradhapura, Polonnaruva, Kandy, and Sigiriya, 3 – Includes Peradeniya, Hakgala, and Gampaha.
4 – Includes Dehiwala and Pinnawala.
5 – Includes national parks listed in Table A2.2 (Annex 2), with the exception of Singharaja Forest Reserve.
6 – Includes Colombo National Museum, National History Museum, Kandy National Museum, Ratnapura National Museum, Galle National Museum, Anuradhapura Folk Museum, and the Dutch Museum.
7 - Conferences held at Bandaranaike Memorial International Conference Hall (BMICH).
8 – Includes same proportion of Museum revenue as 2005 since local and foreign division was not available.
9 – Numbers may not add to 100 percent due to rounding.
Source: Sri Lanka Tourism Development Authority (2004, 2005, 2006, 2007).
Table 2.2 Public sector revenue from tourism (in SL Rs millions)
Source of Revenue 2004 2005 2006 2007 % 2007
9Tourism Embarkation Levy 780.4 674.2 696.0 n/a n/a
Tourism Development Levy 300.6 172.5 177.5 214.3 11.3
Tourist Board Income 30.9 39.0 36.7 35.2 1.9
Embarkation Tax on Foreign Tourists 849.3 823.9 839.4 741.1 39.1
Cultural Triangle 551.9 296.0 409.5 288.5 15.2
Local
18.8 11.3 8.5 8.7 0.5
Foreign
2543.1 284.7 401.0 279.8 14.8
Botanical Gardens
394.0 56.8 67.4 103.4 5.5
Local 23.3 24.2 23.2 36.8 1.9
Foreign 70.7 32.6 44.2 66.6 3.5
Zoological Gardens
4183.7 129.4 136.8 204.7 10.8
Local 64.2 68.0 54.2 71.6 3.8
Foreign 119.5 61.4 82.6 133.1 7.0
Wild Life Parks
5123.6 70.9 191.7 159.9 8.4
Local 9.8 8.2 92.1 17.1 0.9
Foreign 113.8 62.7 99.6 142.8 7.5
Museums
61.5 7.6 9.2 4.5 0.2
Local - 3.7 2.7 0.3 0.0
Foreign - 3.9 6.5 4.2 0.2
BMICH
770.7 101.4 120.5 142.9 7.5
Total 2,986.6 2,371.7 2,684.7 1,894.5 100.0
Local 106.8
8115.4 180.7 134.5 7.1
Foreign 2,879.8
82,256.3 2,504.0 1,760.0 92.9
1 – Includes Alahana Museum, Jethavana Museum, Abeygiriya Museum, Dambulla (Museum), and Sigiriya.
2 – Includes Anuradhapura, Polonnaruva, Kandy, and Sigiriya.
3 – Includes Peradeniya, Hakgala, and Gampaha.
4 – Includes Dehiwala and Pinnawala.
5 – Includes national parks listed in Table A2.2 (Annex 2), with the exception of Singharaja Forest Reserve.
6 – Includes Colombo National Museum, National History Museum, Kandy National Museum, Ratnapura National Museum, Galle National Museum, Anuradhapura Folk Museum, and the Dutch Museum.
7 - Conferences held at Bandaranaike Memorial International Conference Hall (BMICH).
8 – Includes same proportion of Museum revenue as 2005 since local and foreign division was not available.
9 – Numbers may not add to 100 percent due to rounding.
Source: Sri Lanka Tourism Development Authority (2004, 2005, 2006, 2007).
17. The current trends in tourism emphasize the high volume and low value-added, sun-and-sand type of tourism. Although this is a lucrative segment of the market that has been captured, it is reasonable to ask whether there are other areas that could be further promoted to grow the sector. The national park system and cultural areas offer major attractions that appear to be underutilized.
Strategic investments could be important in this area. To assess the revenue-generating potential of these assets, a tourism survey was conducted to determine tourists’ willingness to pay for the national park experience.
2.3 The Approach
18. A tourist survey was conducted across a sample of nearly 2,000 respondents, who were interviewed in hotels and lodges as well as at the park gates.
7The targeted population included resident and nonresident tourists staying in the hotels and lodges along the southwest coastline of Sri Lanka and near the parks (Bundala, Minneriya, Singharaja Forest Reserve, Uda Walawe, and Yala). The survey was designed to elicit information about the tourist profiles, trip characteristics, satisfaction levels, and the willingness to pay for park-related activities. The interviews were typically conducted following a respondent’s trip into the park to ensure an informed response. Annex 2 contains details of the sampling methodology used and the caveats that apply in generalizing the results.
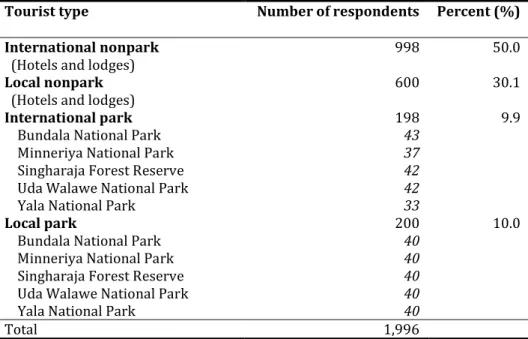
19. Table 2.3 shows the final distribution of tourists in the sample by location. The largest shares were international tourists who did not visit the parks (“nonpark”) (50 percent), followed by local residents who did not visit the parks (30 percent). Park visitors, taken together, represented just less than 20 percent of the sample. The latter reflects the purposive sampling approach guided by the need to capture a sufficient number of visitors to the parks.
Table 2. 3 Distribution of tourists, by type and location
Tourist type Number of respondents Percent (%) International nonpark
(Hotels and lodges) 998 50.0
Local nonpark
(Hotels and lodges) 600 30.1
International park 198 9.9
Bundala National Park 43
Minneriya National Park 37
Singharaja Forest Reserve 42
Uda Walawe National Park 42
Yala National Park 33
Local park 200 10.0
Bundala National Park 40
Minneriya National Park 40
Singharaja Forest Reserve 40
Uda Walawe National Park 40
Yala National Park 40
Total 1,996
Source: World Bank Tourist Survey (2008).
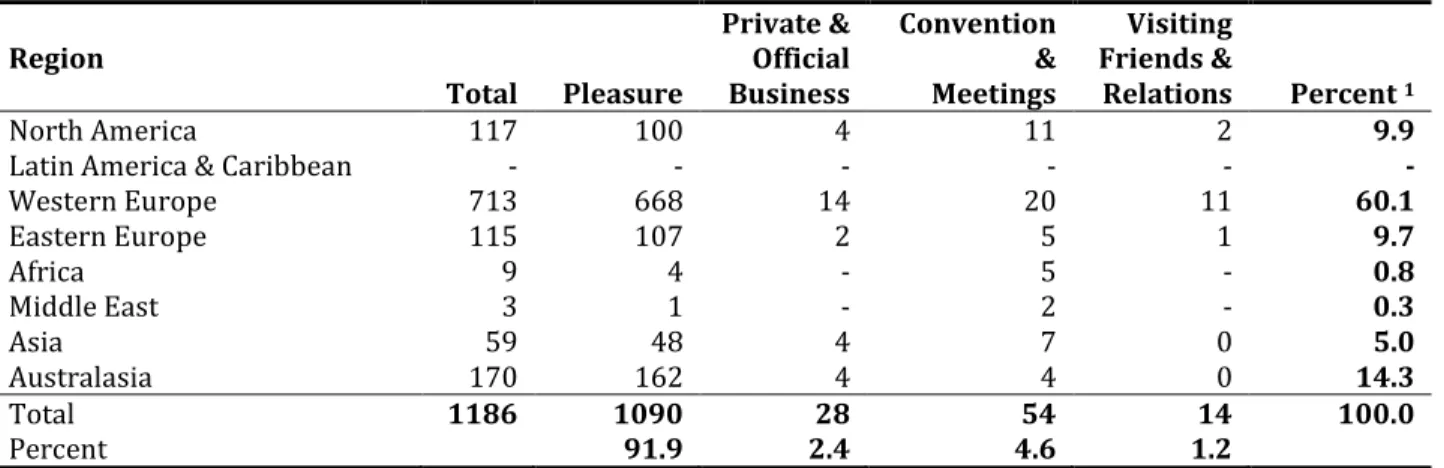
20. Table 2.4 summarizes basic characteristics of the sampled population of tourists. Mirroring national trends, recreation and pleasure travel are the main reasons for visiting Sri Lanka. However, the arrival categories may not be mutually exclusive, and it is likely that the pleasure category includes religious and cultural trips. There would also likely be seasonal variation in other forms of tourism, such as conferences, which the survey was not able to capture. Low numbers in the nonrecreational categories could also reflect the consequences of the civil conflict at the time of the sampling. The bulk
7
The survey identified (1) the socioeconomic characteristics of the different types of tourists who frequent the
island, )2) purpose of the visit, (3) duration of stay and number of sites visited, (4) perceptions of park quality,
and (5) willingness to pay for visits to the national parks and for improvements in their conservation and
management. The final number of completed questionnaires was 1,996. The survey was conducted over several
months in the last quarter of 2008 and into January of 2009 (survey appended in Annex 2).
of tourists in the sample (about 60 percent) are from Western Europe, followed by Australasia (14 percent) and North America (10 percent).
21. The number of arrivals is one indicator of potential revenue generation. Length of stay is a second.. More than 42 percent of international tourists stay for 4 to 7 nights and more than 51 percent stay 8 to14 nights, with an average visit of 7.2 days.
Table 2.4 Number of international tourists by country of residence and purpose of visit, 2007
Region
Total Pleasure
Private &
Official Business
Convention
&
Meetings
Visiting Friends &
Relations Percent
1North America 117 100 4 11 2 9.9
Latin America & Caribbean - - - - - -
Western Europe 713 668 14 20 11 60.1
Eastern Europe 115 107 2 5 1 9.7
Africa 9 4 - 5 - 0.8
Middle East 3 1 - 2 - 0.3
Asia 59 48 4 7 0 5.0
Australasia 170 162 4 4 0 14.3
Total 1186 1090 28 54 14 100.0
Percent 91.9 2.4 4.6 1.2
1 – Numbers may not add to 100 percent due to rounding.
Source: World Bank Tourist Survey (2008).
2.4 The Economic Impacts of Tourism: Spending Patterns
22. The questionnaire elicited information on expenditures for goods and services such as airfare, hotels, transport, food, shopping, and other activities, both inside and outside the country. An important distinction that emerges is in the spending patterns of package tourists and those who visit a park. Packages typically capitalize on volume pricing and other arrangements that make the overall cost of the trip less expensive, so it is no surprise that the package tourists spend significantly less than the nonpackage travelers.
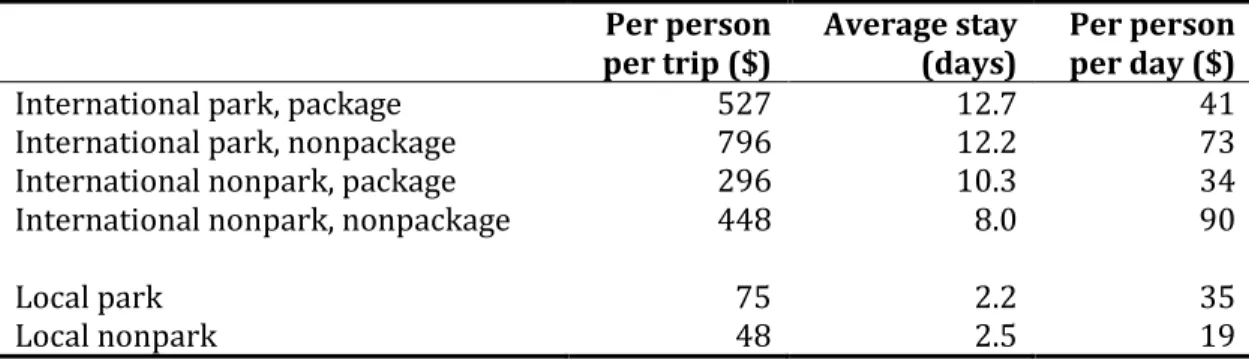
823. Expenditure patterns differ considerably by tourist type and also whether there has been a visit to a national park (Table 2.5). Those who travel on packages and do not visit a park spend the least.
The typical package tourist who does not visit a park stays in Sri Lanka for about 10 days and spends on average a meager $34 per person per day. In contrast, the highest spenders are individual (nonpackage) travelers who visit a park. These stay in the country for slightly longer—about 12 days—
and spend on average $73 per person per day. The policy implication of this finding is very clear:
promoting individual travel provides a potentially more lucrative strategy for creating high-value niche markets and raising revenue from the sector. Of the surveyed international individuals, more than 76 percent were on packaged tours, 8 percent had some items packaged, and 15 percent purchased items separately (nonpackage). Among the package tourists, 96 percent were purchased outside Sri Lanka in their resident country, indicating the possibility of significant revenue leakages.
8
One aspect about packages to note in the Sri Lankan context is that local residents quite often do not travel as
part of any package. In fact, none were found during this survey.
Table 2.5 Tourist expenditures per person, excluding airfare Per person
per trip ($)
Average stay (days)
Per person per day ($)
International park, package 527 12.7 41
International park, nonpackage 796 12.2 73
International nonpark, package 296 10.3 34
International nonpark, nonpackage 448 8.0 90
Local park 75 2.2 35
Local nonpark 48 2.5 19
Source: World Bank Tourist Survey (2008).
24. A breakdown of spending patterns further reinforces this conclusion. Table 2.6 gives the per- person, per-trip average expenditures for each spending category. Each of these goods or services represents a sector in the economy. The nonpackage park tourists again represent the highest spenders in most categories (except transport).
Table 2.6 Breakdown of expenditures per person per trip ($)
International park International nonpark Category Package Nonpackage Package Nonpackage
Hotels 185 484 197 177
Transportation 116 83 33 121
Food and beverages 76 120 38 95
Shopping 59 48 13 30
Other activities 62 61 14 23
Source: World Bank Tourist Survey (2008).
2.5 Economic Impact of Nature Tourism
25. Average expenditures provide the basic information required to calculate the economic impact of nature tourism. The average tourist spends from $296 (package variety) to $796 (nonpackage park visitor) on each trip in Sri Lanka, distributed across each of the sectors in Table 2.6.
9This information is combined with the 2000 input-output table for Sri Lanka to estimate the economy-wide impacts of nature tourism on gross value-added, wages, tax revenues, and imports.
10I-O models make the strong assumption that factor inputs are fixed in proportion, but they have the unique property of being able to trace sectoral inter-linkages in great detail. A full computable general equilibrium analysis that allows for factor substitution is clearly beyond the scope of this report.
26. The methodology employed is to “close” the I-O table to households. As an example, when a tourist spends, say, $484 on hotels and restaurants, this generates a certain amount of wage income
9
“Other activities” was mapped to the sector “Tourist Shops and Travel Agents” in the I-O matrix.
10
I-O tables are constructed around a matrix of intersectoral flows detailing how much of the intermediate
demand for goods and services in a given production sector is met by other sectors in the economy. Information
on value-added is broken down into wages, indirect taxes, and operating surplus complete the production
accounting system.
and net surplus that accrues to households, who then spend this income by consuming goods and services. In addition, when the hotel and restaurant sector produces $484 worth of output, it must purchase inputs of food, beverages, water, electricity, communications, manufactures, and so on. These inputs to the sector are either imported or produced by other sectors in the Sri Lankan economy. When all transactions are added up it is possible to arrive at a total measure of the direct plus indirect production, value added, wages, tax revenues, and imports required to meet this demand.
Impact on the economy
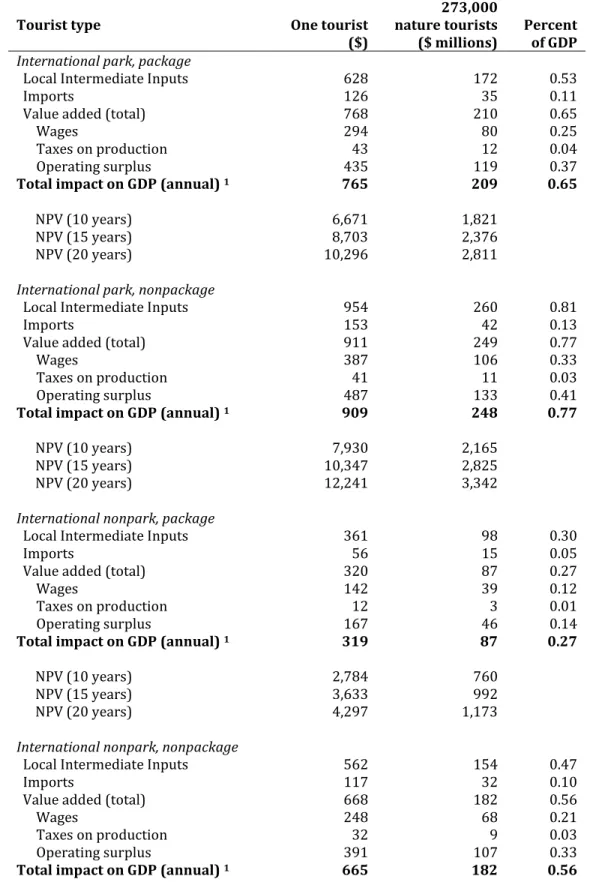
27. Table 2.8 displays the economic impact of each type of nature tourism spending in Sri Lanka.
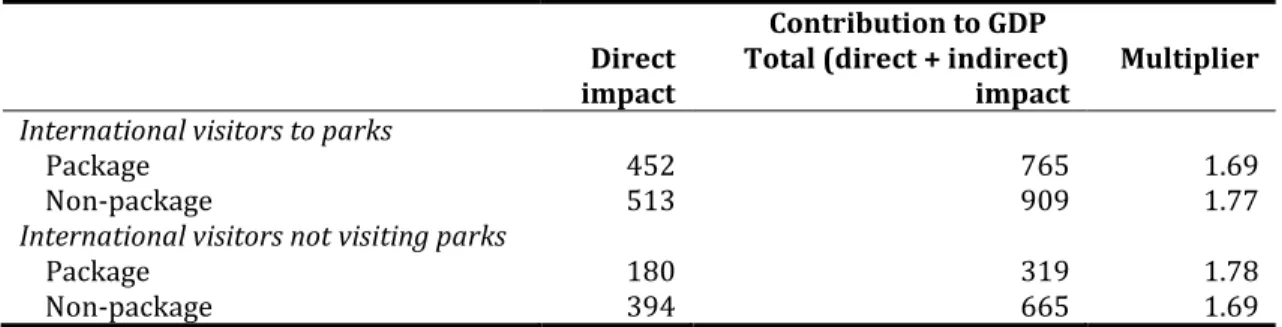
Consider first the high-spending international park tourist, with no package spending. With the average spending pattern of this type of tourist, $796 in overall spending generates a total of $909 worth of GDP (value-added) in the economy. The tourism multiplier in this case is 1.77: that is; $1.00 spent by the tourist generates an additional $1.77 in revenue for the economy. The benefits accrue in the form of an additional $387 in wages and $487 in operating surplus to businesses, $41 in tax revenue, and $153 worth of imported goods and services. Overall multiplier effects for each tourist type are summarized in Table 2.7.
Table 2.7 Direct and indirect economic impact of nature-based tourists in 2007
1Contribution to GDP
Direct
impact Total (direct + indirect)
impact Multiplier International visitors to parks
Package 452 765 1.69
Non-package 513 909 1.77
International visitors not visiting parks
Package 180 319 1.78
Non-package 394 665 1.69
1 – Simulated using the expenditure by one tourist.
Source: Author’s calculation.
28. The total number of international tourists who indicated they were in Sri Lanka for “pleasure”
was more than 331,000 (Annex 2: Table A2.1), and more than 58,000 visitors were recorded at the park gates in 2007 (Table 2.1). The difference, 273,000, represents potential park visitors. If the 273,000 tourists were to visits parks and more generally follow this spending pattern (an average amount of $796), it would translate to more than $248 million, or 0.77 percent of GDP, to the Sri Lankan economy (Table 2.8).
29. This estimate is an annual figure. Were these revenue flows sustained for 10 years (using a 5
percent discount rate) the revenue streams would amount to a net present value (NPV) of $2.2 billion in
a decade and $3.3 billion in 20 years. These figures are, of course, indicative of only an extreme
hypothetical scenario that is unlikely to occur. But they do illustrate that even more modest measures
that increase tourism spending could yield tremendous gains. This could be achieved either by
measures that increase the time spent in the country or by improving the quality of (and hence
willingness to pay for) the experience.
Table 2.8 Economic impacts of nature-based tourism spending in 2007
Tourist type One tourist
($)
273,000 nature tourists
($ millions) Percent of GDP International park, package
Local Intermediate Inputs 628 172 0.53
Imports 126 35 0.11
Value added (total) 768 210 0.65
Wages 294 80 0.25
Taxes on production 43 12 0.04
Operating surplus 435 119 0.37
Total impact on GDP (annual)
1765 209 0.65 NPV (10 years) 6,671 1,821
NPV (15 years) 8,703 2,376 NPV (20 years) 10,296 2,811 International park, nonpackage
Local Intermediate Inputs 954 260 0.81
Imports 153 42 0.13
Value added (total) 911 249 0.77
Wages 387 106 0.33
Taxes on production 41 11 0.03
Operating surplus 487 133 0.41
Total impact on GDP (annual)
1909 248 0.77
NPV (10 years) 7,930 2,165
NPV (15 years) 10,347 2,825
NPV (20 years) 12,241 3,342
International nonpark, package
Local Intermediate Inputs 361 98 0.30
Imports 56 15 0.05
Value added (total) 320 87 0.27
Wages 142 39 0.12
Taxes on production 12 3 0.01
Operating surplus 167 46 0.14
Total impact on GDP (annual)
1319 87 0.27
NPV (10 years) 2,784 760
NPV (15 years) 3,633 992
NPV (20 years) 4,297 1,173
International nonpark, nonpackage
Local Intermediate Inputs 562 154 0.47
Imports 117 32 0.10
Value added (total) 668 182 0.56
Wages 248 68 0.21
Taxes on production 32 9 0.03
Operating surplus 391 107 0.33
Total impact on GDP (annual)
1665 182 0.56
Tourist type One tourist ($)
273,000 nature tourists
($ millions) Percent of GDP
NPV (10 years) 5,800 1,583
NPV (15 years) 7,567 2,066
NPV (20 years) 8,952 2,444
1 – The total annual impact is not the sum of value-added, indirect taxes, corporate taxes, wages and imports. It is the total impact on GDP. The separate line items are shown since they are major components of GDP and of interest to policymakers.
Source: Author’s calculation.
2.6 Increasing the Economic Impact of Nature Tourism
30. One simple way to increase tourism revenue would be to increase the average length of stay. The average number of days tourists spend in Sri Lanka is around 8 to 13 days for international tourists, depending on whether they were traveling on a package or not (Table 2.5). To gain a sense of the magnitudes involved, a simple example can illustrate the potential earning capacity. If a low-spending international package tourist that did not visit a park spent an extra day in the country then (multiplying the expenditure figure by the potential 273,000 nature tourists) this would result in a potential annual increase of $9.3 million per day. The corresponding figure for the higher spending international nonpackage tourists who did visit a park is $19.9 million per day. Hypothetically if one were to extend the typical park trip by two days, this would of course double the contribution to nearly
$40 million. With a tourism multiplier of 1.77, the overall impact could be as large as 0.22 percent of GDP or $70 million annually, with just this simple intervention. Over the span of 10 years this would represent a net present value of more than $614 million at a 5 percent discount rate.
31. Increasing a nature tourist’s duration of stay could be accomplished through better marketing of the national parks. Currently the vast majority of tourists do not visit the parks. Among the international tourists who did not go to a park and were on a package, only 48 percent said that park options were available. There appears to be a strong latent desire among these to visit the national parks. In the survey, nonpark tourists were asked if they were willing to pay to visit a park with the concomitant increase on transport and accommodation costs. The results were highly favorable, with 90 percent indicating that they would be willing to add a park visit to the trip. Needless to say, it is unlikely that all tourists who currently visit would extend their stay by one or two days, but the exercise is useful in indicating the likely contribution that such an intervention could make to the economy.
Quality of the tourist experience
32. The absolute number of arrivals and the length of stay determine the quantity of tourism, but another important aspect is the quality of the experience. If the visitor is dissatisfied, repeat visits are unlikely. More importantly, with more than 12 percent of the sample arriving on the recommendation of friends, relatives, or evaluative books, there is an important reputational risk to the quality of the experience that the industry should be aware of. Although the Sri Lankan national park network is abundant with charismatic faunal species such as the elephant, leopard and sloth bear, the visitor experience needs significant improvement.
33. Table 2.9 presents the overall visitor satisfaction for the five sites in the sample. Uda Walawe is
the lowest in terms of overall satisfaction, with only 58 percent of respondents describing their
experience as being “quite good” or “very good.” The highest was the Singharaja Forest Reserve with more than 90 percent of visitors rating it as “quite good” or “very good.” However, these broad averages conceal considerable variation in attitudes and satisfaction with service quality. Closer scrutiny unearthed a consistent pattern of visitor experiences.
Table 2.9 Overall site satisfaction by park tourists, percent
Site Quite good Very good
Bundala National Park 30 41
Minneriya National Park 63 21
Singharaja Forest Reserve 62 28
Uda Walawe National Park 53 5
Yala National Park 20 46
Source: World Bank Tourist Survey (2008).
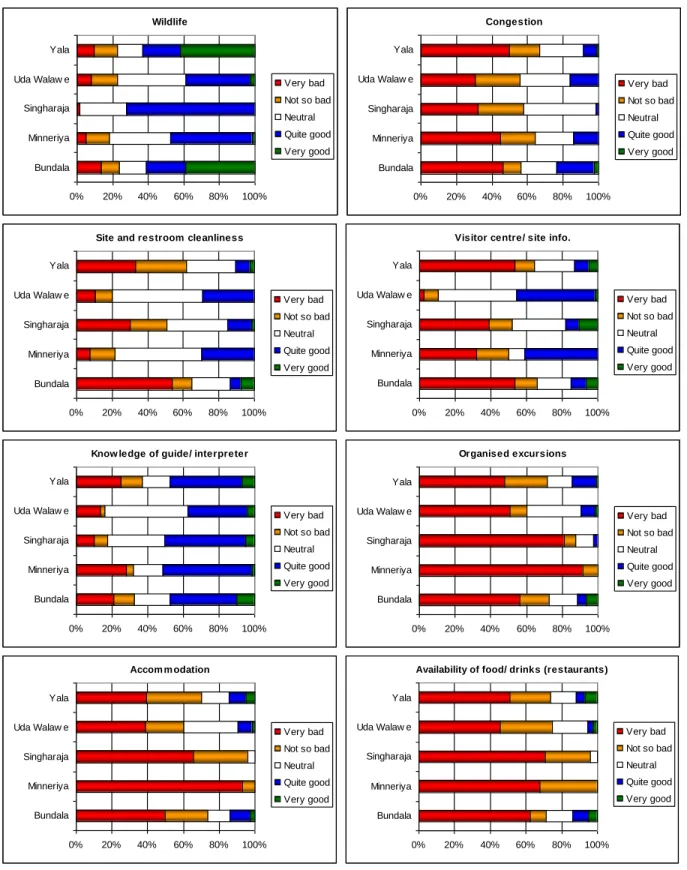
34. Figure 2.4 shows the perceptions across a wide variety of site attributes for each of the parks.
There is remarkable consistency in the results. There is uniformly high satisfaction with the wildlife experience—the primary attraction to a nature reserve. But regrettably, this is where the positive perceptions end. There is concern and dissatisfaction with traffic congestion in the parks, suggesting that limits may have been reached. There is also dissatisfaction with organized excursions, accommodation, activities for children, availability of restaurants, diversity of activities, and shopping opportunities. In short, the lack of visitor services are a common problem, though there is appreciation of infrastructure facilities (for example, toilets) when these are available in some of the parks.
Minneriya and Singharaja fair the worst on average, in most categories. When respondents were asked
to assess their overall experience, individual attribute trends diminish greatly, especially for Minneriya
and Singharaja, as the wildlife and nature attributes dominate perceptions of satisfaction (see “Overall
experience,” the last graph in Figure 2.4).
Figure 2.4 Perceptions of park attributes
Wildlife
0% 20% 40% 60% 80% 100%
Bundala Minneriya Singharaja Uda Walaw e Yala
Very bad Not so bad Neutral Quite good Very good
Congestion
0% 20% 40% 60% 80% 100%
Bundala Minneriya Singharaja Uda Walaw e Yala
Very bad Not so bad Neutral Quite good Very good
Site and restroom cleanliness
0% 20% 40% 60% 80% 100%
Bundala Minneriya Singharaja Uda Walaw e Yala
Very bad Not so bad Neutral Quite good Very good
Visitor centre/ site info.
0% 20% 40% 60% 80% 100%
Bundala Minneriya Singharaja Uda Walaw e Yala
Very bad Not so bad Neutral Quite good Very good
Know ledge of guide/ interpreter
0% 20% 40% 60% 80% 100%
Bundala Minneriya Singharaja Uda Walaw e Yala
Very bad Not so bad Neutral Quite good Very good
Organised excursions
0% 20% 40% 60% 80% 100%
Bundala Minneriya Singharaja Uda Walaw e Yala
Very bad Not so bad Neutral Quite good Very good
Accom m odation
0% 20% 40% 60% 80% 100%
Bundala Minneriya Singharaja Uda Walaw e Yala
Very bad Not so bad Neutral Quite good Very good
Availability of food/ drinks (restaurants)
0% 20% 40% 60% 80% 100%
Bundala Minneriya Singharaja Uda Walaw e Yala
Very bad Not so bad Neutral Quite good Very good
Figure 2.4 Perceptions of park attributes (continued)
Facilities for children
0% 20% 40% 60% 80% 100%
Bundala Minneriya Singharaja Uda Walaw e Yala
Very bad Not so bad Neutral Quite good Very good
Diversity of activities
0% 20% 40% 60% 80% 100%
Bundala Minneriya Singharaja Uda Walaw e Yala
Very bad Not so bad Neutral Quite good Very good
Friendliness of staff
0% 20% 40% 60% 80% 100%
Bundala Minneriya Singharaja Uda Walaw e Yala
Very bad Not so bad Neutral Quite good Very good
Shopping opportunities
0% 20% 40% 60% 80% 100%
Bundala Minneriya Singharaja Uda Walaw e Yala
Very bad Not so bad Neutral Quite good Very good
Value for m oney
0% 20% 40% 60% 80% 100%
Bundala Minneriya Singharaja Uda Walaw e Yala
Very bad Not so bad Neutral Quite good Very good
Transport experience to/ from park
0% 20% 40% 60% 80% 100%
Bundala Minneriya Singharaja Uda Walaw e Yala
Very bad Not so bad Neutral Quite good Very good
Overall experience
0% 20% 40% 60% 80% 100%
Bundala Minneriya Singharaja Uda Walaw e Yala
Very bad Not so bad Neutral Quite good Very good
35. The impressions that tourists leave the country with can be highly influential in future vacation decisions. Although the impressive statistics above reveal a good overall trip experience, this does not necessarily imply that tourists would return in the future, since there may be other more attractive international destinations. To get an indication of a repeat visit, tourists were also asked whether they would visit Sri Lankan natural sites again in the future. As Figure 2.5 shows, over 95 percent who visited these parks would return.
Figure 2.5 Percentage of park visitors who would return to Sri Lanka
Source: World Bank Tourist Survey (2008).
2.7 Opportunities for Financing National Parks and Forest Reserves
36. The tourist survey was also used to elicit the willingness to pay park entrance fees as another possible means of raising additional revenue (see Box 2.1) for conservation. A high willingness to pay would indicate high levels of consumer satisfaction and provide scope to raise entrance fees.
Conversely a low willingness to pay would suggest the need for investments to improve the park experience. Nature tourists were asked a series of questions on their willingness to pay (1) to enjoy the national parks as they currently stand and (2) for specific improvements in the each of the parks.
1.3 3.3 95.5
Yes No Don't know
Willingness to pay by international visitors for national parks (or forest reserves)
37. Figures 2.6 to 2.9 summarize the results from the WTP survey, for each tourist type and development scenario. On average, the international tourists indicate that the entrance fee of $14 is close to what they are willing to pay for the current experience (with Minneriya and Singharaja being worth a little less, perhaps, because of some dissatisfaction with some specific site attributes as shown in Figure 2.4). The fiscal implication is also clear. In the absence of improvements in infrastructure and quality of interpretation services there is perhaps little scope to raise park entrance fees without substantially sacrificing visitor numbers.
38. If improvements are made to the parks, as suggested in the hypothetical scenarios (see Box 2.2), willingness to pay increases by about 28 percent or more per trip. In the case of international nonpark tourists, the differential between the current entrance fee and what they would be willing to pay to visit a park is even more striking. On average, international nonpark tourists were willing to pay about $18 for the current situation and up to $23 or 64 percent more for the improved conditions (Figure 2.7).
Figure 2.6 International park tourists’ willingness to pay park entrance fees Box 2.1 Willingness to pay
Willingness-to-pay (WTP) studies are not as straightforward as they may seem, since they are essentially creating a hypothetical market for an environmental good, which may have some arbitrary price already associated with it (e.g.
entrance fee). Since the good in question is likely to possess some nonmarket services, the description of the quantity and quality must be carefully thought out and presented to the respondent. Due to the hypothetical nature of WTP studies, there are certain sets of “rules” or guidelines that should be followed in order to elicit a reliable and consistent willingness to pay—and avoid a plethora of possible biases that could distort the value given by the tourist.
The WTP section of the tourist survey used five out of six guidelines from the "Report on the NOAA Panel on Contingent Valuation" (Arrow et al 1993, Randall 1997). The survey used personal interviews, probability sampling, careful pretesting, and reminders of budget constraints and the availability of substitutes. A common criticism of contingent valuation (CV) analysis is that CV estimates are gross overestimates. Studies show that, under plausible conditions, when asked to value quasi-public goods where the effective trade-off is a quality change against a cost change, and public goods are to be provided by means of an increased tax, it is in the strategic interest of the respondents to truthfully reveal their WTP (Carson et al 1999). The survey in this study used a menu of multiple choices presented to the respondent in the form of a payment card. However, this question format is likely to bias WTP responses downward for three reasons (Carson 1997): (1) the optimal strategy for respondents whose WTP is less than the expected cost is to state a WTP of $0; (2) open-ended and payment card questions indicate uncertainty about future costs for the respondent and result in a lower WTP response; and (3) if the respondent believes that the government is capable of capturing part of any available surplus for unproductive purposes, the WTP reported would be lower. Thus, WTP reported in the survey may be lower than the actual WTP of the respondents and should be considered a lower bound.
The survey took these principles into account along with other important considerations such as the following: (1)
tourists were interviewed after they had enjoyed their trip to a national park, making the questions seem less
hypothetical; 2) the scenarios used to elicit willingness to pay were described in precise terms, rooted in the
experience the respondent has just had; and (3) the means of eliciting willingness to pay was through a payment card,
giving the respondent a menu of potential amounts to pay for the experience just enjoyed (or enhancements to the
experience). The questions were asked in terms of a maximum willingness to pay once reminded of the current
entrance fee to the park.
Source: World Bank Tourist Survey (2008).
Figure 2.7 International nonpark tourists’ willingness to pay park entrance fees
International park tourist
14 14.6 14 14 14 14
13.4 13.5
14.6 14.7
18.9
17.5 17.0
18.0 18.5
0.00 5.00 10.00 15.00 20.00 25.00
Bundala NP Minneriya NP Singharaja FR Uda Walawe NP Yala NP Current No improvement With improvement
International non-park tourist
14 14 14 14 14
18.3 18.3
17.6 18.6 18.6
22.8 22.9
22.0
23.7 23.6
0.00 5.00 10.00 15.00 20.00 25.00
Bundala NP Minneriya NP Singharaja FR Uda Walawe NP Yala NP Current No improvement With improvement