Report No. 1
South Asia Human Development Sector
A Review of Educational Progress and Reform in
The District Primary Education Program (Phases I & II)
September 1, 2003
37832
Public Disclosure AuthorizedPublic Disclosure AuthorizedPublic Disclosure AuthorizedPublic Disclosure Authorized
A REVIEW OF EDUCA A REVIEW OF EDUCA A REVIEW OF EDUCA A REVIEW OF EDUCA
A REVIEW OF EDUCATIONAL PR TIONAL PR TIONAL PR TIONAL PROGRESS AND REFORM TIONAL PR OGRESS AND REFORM OGRESS AND REFORM OGRESS AND REFORM OGRESS AND REFORM IN THE DISTRICT PRIMARY EDUCA
IN THE DISTRICT PRIMARY EDUCA IN THE DISTRICT PRIMARY EDUCA IN THE DISTRICT PRIMARY EDUCA
IN THE DISTRICT PRIMARY EDUCATION PR TION PR TION PR TION PR TION PROGRAM OGRAM OGRAM OGRAM OGRAM (Phases I and II)
(Phases I and II) (Phases I and II) (Phases I and II) (Phases I and II)
September 1, 2003 September 1, 2003 September 1, 2003 September 1, 2003 September 1, 2003
Human Development Sector Human Development Sector Human Development Sector Human Development Sector Human Development Sector
South Asia Region South Asia Region South Asia Region South Asia Region South Asia Region
The W The W The W The W
The World Bank orld Bank orld Bank orld Bank orld Bank
A A A
A ACKNOWLEDGEMENTS CKNOWLEDGEMENTS CKNOWLEDGEMENTS CKNOWLEDGEMENTS CKNOWLEDGEMENTS
This report was jointly task managed by Vandana Sipahimalani-Rao and Prema Clarke. It was collaboratively written by the task managers with Vandana Sipahimalani-Rao focusing on the section on project outcomes and Prema Clarke on the section on project interventions. Renu Gupta provided editorial and logistical support.
This report is based primarily on a literature review of studies on DPEP I and II. An annotated bibliography of the studies was done by two consultants: Kamal Gaur and Vijayalakshmi Hebbare. The report also draws on a quantitative study using available household data done by Jyotsna Jalan and Elena Glinskaya.
The authors are grateful for extensive comments provided by the peer reviewers, Robert Prouty and Vicente Paqueo.
The report also benefited from detailed comments given by Michelle Riboud, Sajitha Bashir, Elena Glinskaya, Venita Kaul, Anil Deolalikar, N.K. Jangira and from guidance provided at various stages by Charles Griffin, Emmanuel Y. Jimenez, Edward Heneveld, Barbara Bruns and Keith Hinchliffe. It has further benefited from discussions with officers from the Ministry of Human Resource Development at a presentation based on an earlier draft.
APPEP - Andhra Pradesh Primary Education Programme
AS - Alternative School
AWPB - Annual Work Plans and Budget BAS - Baseline Achievement Survey BEP - Bihar Education Program BRC - Block Resource Center
CAG - Comptroller and Auditor General CEO - Chief Executive Officer
CDR - Cohort Dropout Rate CRC - Cluster Resource Center
DFID - Department for International Development
DIET - District Institute of Education and Training
DOE - Department of Education
DPEP - District Primary Education Program
EC - European Commission
ECE - Early Childhood Education
Ed. Cil - Education Consultants India Limited EGS - Education Guarantee School
EMIS - Education Monitoring Information System
GER - Gross Enrolment Ratio GOI - Government of India
GOUP - Government of Uttar Pradesh
ICDS - Integrated Child Development Scheme IGE - Index of Gender Equity
IIM - Indian Institutes of Management MAS - Midterm Assessment Survey
MHRD - Ministry of Human Resource Development
MLL - Minimum Levels of Learning
NCERT - National Council for Educational Research and Training
NER - Net Enrolment Ratio NET - National Evaluation Team NFE - Non Formal Education
NGO - Non Government Organisation NPE - National Policy for Education NSS - National Sample Survey OBC - Other Backward Classes POA - Programme of Action PRI - Panchayati Raj Institutions
PTA/MTA - Parent/Mother Teacher Association PTR - Pupil Teacher Ratio
SAR - South Asia Region
SC/ ST - Schedule Castes/ Schedule Tribes SCERT - State Council of Education Research
and Training
SDMC - School Development and Management Committee
SIEMAT - State Institution of Educational Management and Training
SIS - State Implementation Society SMC - School Management Committee SPO - State Project Office
TAS - Terminal Assessment Survey TLM - Teaching Learning Material TSG - Technical Support Group
UEE - Universalization of Elementary Education
UPBEP - Uttar Pradesh Basic Education Program VEC - Village Education Committee
ABBREVIATIONS AND ACRONYMS
CONTENTS CONTENTS CONTENTS CONTENTS CONTENTS
EXECUTIVE SUMMARY 7
I. INTRODUCTION 10
II. ASSESSMENT OF THE PROGRESS TOWARDS OUTCOMES 14
A. Progress in enrolment 14
B. Progress in reducing repetition/ dropout and improving retention/completion 23
C. Progress in improving learning achievement 26
III. THE STATUS AND EFFECTIVENESS OF DPEP INTERVENTIONS 37
A. Community mobilization and participation 37
B. Access and classroom space and size 41
C. Textbook recreation 44
D. The professional development of teachers 47
E. Classroom processes 52
F. Early Childhood Education 55
G. Management of the program 55
IV. CONCLUSION 61
A. Project Outcomes 66
B. Project Interventions 68
C. Critical aspects to be considered in Future Programs 72
REFERENCES 78
LIST OF TABLES
Table 1: DPEP I : Enrolment Trends 16
Table 2: DPEP II : Enrolment Trends 17
Table 3: Changes in CDR: 1997-98 TO 1998-99 24
Table 4: Status of VEC, SMC, MTA and PTA in the DPEP States 39
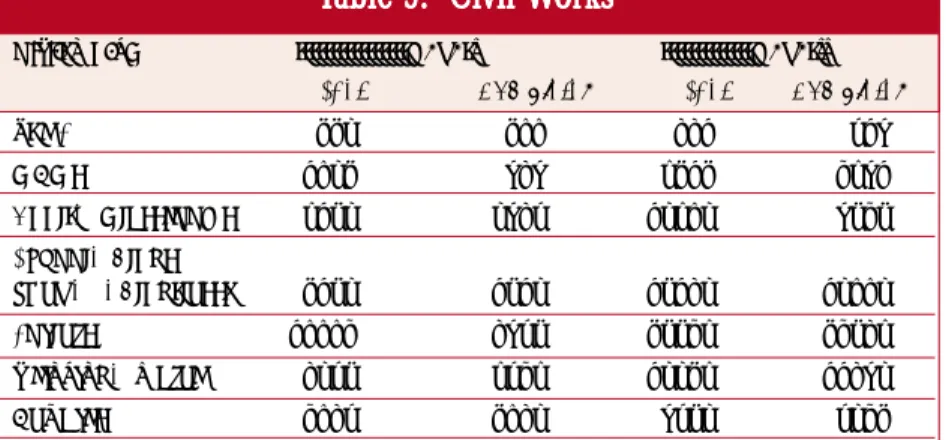
Table 5: Civil Works 42
Table 6: Alternative Schools in the DPEP I and II states 44
Table 7: Participation in textbook renewal 46
Table 8: Teacher training provided 48
Table 9: Distribution of studies done by states across themes 60
Table 10: Summary of progress: Project Outcomes and Interventions 63 LIST OF FIGURES
Figure I: Enrolment Trends: DPEP I 17
Figure II: Enrolment Trends: DPEP II 18
Figure III: Trends On Total Enrolment: DPEP I 20
Figure IV: Trends In Total Enrolment: DPEP II 21
Figure V: Frequency Distribution Of Achievement Scores: Class I Mathematics: DPEP I (TAS) 28 Figure VI: Frequency Distribution Of Achievement Scores: Class I Language: DPEP I (TAS) 28 Figure VII: Frequency Distribution Of Achievement Scores: Class III/IV Language: DPEP I (TAS) 29 Figure VIII: Frequency Distribution Of Achievement Scores: Class III/IV Mathematics: DPEP I (TAS) 29 Figure IX: Percent Change In Achievement Scores: DPEP I: Class I Language (Proportion of Districts) 31 Figure X: Percent Change In Achievement Scores: DPEP I: Class I Mathematics (Percent of districts) 31 Figure XI: Percent Change In Achievement Scores: DPEP I: Class III/IV Language (Percent of districts) 32 Figure XII: Percent Change In Achievement Scores: DPEP I: Class III/IV Mathematics (Percent of districts) 32 Figure XIII: Percent Change In Achievement Scores: DPEP II: Class I Language (Percent of districts) 34
Figure XIV: Percent Change In Achievement Scores: DPEP II: 35
Class I Mathematics (Percent of districts) 35
Figure XV: Percent Change In Achievement Scores: DPEP II: Class III/IV Language (Percent of districts) 35 Figure XVI: Percent Change In Achievement Scores: DPEP II: Class III/IV Mathematics (Percent of districts) 36
ANNEXURE 1 75
ANNEXURE II 77
(i) The District Primary Education Program (DPEP) is a centrally sponsored scheme launched by the Government of India in partnership with the state governments and external donor agencies seeking to expand the opportunities for poor and disadvantaged children to receive quality primary education. The program interventions ranged from enrolment drives, community mobilization campaigns, establishing academic resource centers, to inservice teacher training, school and classroom construction, textbook and curriculum renewal, and decentralized planning and monitoring. This report assesses the progress made in terms of outcomes and processes in the first two DPEP programs: The District Primary Education Project I (DPEP I) and the Districts Primary Education Project II (DPEP II).
(ii) The salient objectives of both projects were to:
u Reduce differences in enrolment, dropout and learning achievement between boys and girls and between the general category and SC/ST children to less than five percent1
u Reduce primary dropout rates to less than 10 percent
u Increase average learning achievement levels by over 25 percent above the baseline
u Provide access to all children for formal or equivalent non-formal primary schooling; and
u Establish capacity at the district, state and national level to plan, manage and monitor the program
(iii) For this report, a comprehensive literature review was undertaken to consolidate available evidence on both projects. The literature review is complemented by a limited quantitative study using available household data on the impact of DPEP I on select outcome variables i.e.
enrolment and primary school completion.
(iv) The original intent of this report was to evaluate the impact of DPEP I and II based on an exhaustive literature review of the many studies conducted under the aegis of the program.
Unfortunately, however, this review revealed that, with the exception of Jalan and Glinskaya, none of the studies could qualify as true impact evaluations. It has thus evolved to become an assessment of the progress made with regard to
project outcomes and interventions. Future programs will need to be designed with a stronger monitoring and evaluation component so as to enable better evaluation studies to be done.
(v) Project data make universal access, defined as universal enrolment, difficult to measure.
However, it is clear that universal access has not been achieved for DPEP I and II as a whole, although substantial progress has been made in terms of increasing enrolment, particularly in the states of Karnataka, Gujarat, Madhya Pradesh and Uttar Pradesh. Most districts achieved the DPEP goal of reducing gender differences in enrolment to less than five percent. However, many districts did not achieve the second goal of reducing social disparities, particularly in the case of scheduled tribe children.
(vi) In addition, a rigorous impact evaluation of DPEP I using household data done by Jalan and Glinskaya (2002) concluded that the projects net impact on enrolment using the propensity matching technique for impact evaluation was positive, but much smaller than its gross impact. While more impact evaluations of this kind need to be done to the extent possible ex-post, it must be kept in mind that it is difficult to isolate the impact of DPEP since the program was intended to act as a catalyst in introducing reforms in primary education and several of its interventions were introduced in non- project districts as well.
(vii) The DPEP goal of having a cohort dropout rate, which is less than 10 percent has been achieved in very few districts (except in Kerala where 5 of 6 districts have achieved this goal). Gender disparities in dropout rates have been successfully reduced in about three quarters of DPEP I and II districts. In addition, future programs will need to build much better data systems (cohort studies and household data based systems) in order to compute dropout rates and completion rates which are currently not available, for the most part. It will also be important for future programs to identify differential targets for the various Indian states. It is likely that some of the objectives of DPEP I and II, such as reducing the dropout rate to less than 10 percent across the board for all districts was too ambitious to begin with.
EXECUTIVE SUMMARY EXECUTIVE SUMMARY EXECUTIVE SUMMARY EXECUTIVE SUMMARY EXECUTIVE SUMMARY
1 Differences in enrolment implies differences in enrolment rates but this was not clear in the original guidelines.
(viii) The achievement surveys conducted in the project districts reveal that the DPEP goal of attaining a minimum of 40 percent score was achieved in Grade I in most DPEP I and II districts. However, less than five percent of the districts achieved this goal for grades III/IV. Only one half to three quarters of the districts achieved the second objective of raising achievement levels by at least 25 percent over baseline figures for Class I. A negligible proportion of districts achieved this goal for the higher classes. The third DPEP objective of reducing gender differences in achievement levels to less than five percent has been attained in most districts. The success has been more limited in reducing differences in achievement levels between the general
category of students and SC students and the gaps in achievement remain quite substantial in the case of ST children. Here again, the question of whether the original targets were achievable can be raised. For many of the districts, achieving a 25 percent increase in achievement levels was too ambitious.
(ix) The project interventions in DPEP have been numerous and complex involving a variety of institutions and governments (center, state, district and local). While no analysis has been done linking specific interventions with outcomes, the connections are discernable between the performance on project outcomes described above and the unevenness in project implementation discussed below.
(x) Community involvement in DPEP has had two dimensions. The first dimension, namely the mobilization of the community has been successful and could explain the increase in enrolment in the initial years of the project. The second dimension is the establishment of Village Education Committees or user groups. On the one hand, the involvement of these groups in school construction has been successful and on the other hand, their participation and effect on improving school quality limited..
(xi) The quality component in DPEP consisted of several aspects. First, the textbooks were revised across DPEP states and this has been a fairly successful intervention putting in place a rigorous process and involving various levels of society.
The elimination of gender stereotypes in textbooks is documented. However, it is not clear whether this is the case with stereotyping of SC and ST children. Evaluation of textbook content and its
use in classrooms has only been done in a few states and these evaluations are positive.
(xii) Second, a large number of teachers have been provided systematic inservice training in DPEP.
The analyses of the training itself are unavailable.
However, the several studies available on classroom process indicate the limited impact of training in classrooms instruction in classrooms, by and large, remain traditional.
However, changes are evident in two areas: in the limited use of activities to aid teaching and in the relationship between teachers and students becoming more nurturing and supportive.
(xiii) State Implementation Societies and the councils and resource groups that support its activities have been crucial for implementation. The planning process has clearly improved through the process of conceptualizing AWPBs, though the role and effectiveness of the AWPBs in achieving project outcomes is unclear. States are now focusing on the development of institutions at the state level (SCERT and SIEMATs) to support the management and planning of education in the state. Sub-district level structures such as the District Institutes of Education and Training (DIETs), have been revitalized to some extent and Block Resource Centers (BRCs) and Cluster Resource Centers (CRCs) are in place.
However, the future of BRCs and CRCs will depend upon understanding their impact on inservice training and improving classroom practice.
(xiv) The financial performance of the projects has been fairly satisfactory though a more detailed analysis of budgets and expenditures are required.
The introduction of the Education Monitoring and Information System (EMIS) certainly marks an important step towards building data systems for planning and monitoring, though it will be critical to strengthen this system which has many limitations and also incorporate household data in the future. Research and evaluation, has been weak in project districts and at the state levels, and relatively stronger at the national level.
However, the literature review reveals that very little impact evaluation has been done.
(xv) Based on the lessons learned from the DPEP I and II, five aspects critical to the implementation of future programs in elementary education are identified better targeting, improved flexibility, focus on accountability, stronger linkages and evaluative research and monitoring.
1.1 The District Primary Education Program (DPEP) is a centrally sponsored scheme launched by the Government of India in collaboration with external donor agencies seeking to expand the opportunities for poor and disadvantaged children to receive quality primary education.2 The program was developed in the early 1990s in response to both global and national attention and concern for the countrys level of literacy. The global compulsions converged at Jomtiens World Conference on Education for All held in March 1990. National pressure for the Government of India to raise literacy is represented at the policy level and in the numerous innovative programs in education across the country. The guidelines for the program were developed based on the National Policy of Education (NPE), 1986, and the accompanying Programme of Action (POA), 1992, focusing on Indias commitment to the Universalization of Elementary Education (UEE).
The experiences gained in small-scale initiatives within the country such as the Lok Jumbush and Shiksha Karmi programs in Rajasthan, the APPEP program in Andhra and the BEP program in Bihar coalesced in designing DPEP.
1.2 DPEP represents a partnership between the Government of India and several state governments, aided by external agencies. In fact, DPEP in India is one of the largest donor-supported programs in the world. Financing of the program was based on a 85:15 ratio with 85 percent passed on as grant to the states by the Central government and 15 percent provided by the state governments.
Districts were chosen on the basis of low female literacy and participation in the Total Literacy Campaign. The programs interventions ranged from enrolment drives, community mobilization campaigns, activating Village Education Committees, establishing block and cluster academic resource centers, to inservice teacher training, school and classroom construction, textbook and curriculum renewal, and decentralized planning and monitoring. Ceilings were place on civil works funding (24 percent) and management costs (6 percent). The first pilot program was launched in 17 districts of Uttar Pradesh as a state project (UPBEP I).
1.3 This report assesses the progress made in terms of outcomes and processes in the first two DPEP
programs: The District Primary Education Project I (DPEP I) and the District Primary Education Project II (DPEP II). The first phase of the program, DPEP I, was a multi-state project launched in 1994 and made effective in 1995.
This included forty two selected districts in the states of Assam, Haryana, Karnataka, Kerala, Madhya Pradesh, Maharashtra, and Tamil Nadu.
Twenty three of these districts were funded by the World Bank. Nineteen districts in Madhya Pradesh were funded by the EC. The second phase of the program, DPEP II, was also a multi- state project made effective in 1996. This included expansion districts in these states as well as selected districts in the states of Gujarat (funded by the Netherlands Government), Himachal Pradesh, Orissa, Uttar Pradesh, and West Bengal (funded by the DFID). The current program has seven projects including several single state ones in Bihar, Rajasthan and Uttar Pradesh that were initiated after DPEP I and II. DPEP is now operational in 272 districts in 18 states, serving over 30 million children. World Bank funds invested in the program (for all the different projects including the state specific credits) amount to US dollars 1.3 billion.
1.4 The salient objectives of both projects were to:
u Reduce differences in enrolment, dropout and learning achievement between boys and girls and between the general category and SC/ST children to less than five percent3
u Reduce primary dropout rates to less than 10 percent
u Increase average learning achievement levels by over 25 percent above the baseline
u Provide access to all children for formal or equivalent non-formal primary schooling;
and
u Establish capacity at the district, state and national level to plan, manage and monitor the program.
INTR INTR INTR
INTR INTRODUCTION ODUCTION ODUCTION ODUCTION ODUCTION
2 Donors supporting this program include the World Bank, the European Commission (EC), the U.K. Department for International Development (DFID), UNICEF, and the Royal Government of the Netherlands.
3 Differences in enrolment implies differences in enrolment rates but this was not clear in the original guidelines.
1.5 The total project costs for DPEP I were US Dollars 310.5 million and for DPEP II were US dollars 534.4 million; both over a seven year period.
DPEP I was subsequently extended by a year.
1.6 This report assesses, on the basis of available project data and studies conducted on DPEP I and II, the progress made by these projects in providing access and good quality primary education. A comprehensive literature review was undertaken to consolidate available evidence for this purpose. The literature review included studies done and commissioned by the Ministry of Human Resource Development (MHRD), studies conducted at the state level and commissioned by State project offices, and the few studies done by independent researchers and donor agencies. Later in this section a summary critique of the studies reviewed is provided and the basis for including evidence from select studies in this report is explained.
The literature review is complemented by a quantitative study (Jalan and Glinskaya, 2002) using available household data evaluating the impact of DPEP I on select outcome variables i.e. enrolment and primary school completion, targeting which were among the key objectives of the program.
1.7 The original intent of this report was to evaluate the impact of DPEP I and II based on an exhaustive literature review of the many studies conducted under the aegis of the program. A genuine impact evaluation would assess the magnitude of the change in development objectives of the project that can be clearly attributed to the project itself, net of the effect of other programs and external factors. Such an evaluation study would attempt to construct a counterfactual to answer the question, What would have happened if DPEP had not been implemented? Typical impact evaluation studies, for programs such as DPEP, which are not nation wide but have partial coverage, and where certain pre-determined criteria were used to select the project districts (i.e. selection was non-random), use statistical methodologies (quasi-experimental or non-experimental designs) to compare project and non-project districts. These statistical techniques attempt to control for other factors that could affect project outcomes. This report is, however, limited to research already done as evident in the literature review. Unfortunately, however, this review
revealed that, with the exception of Jalan and Glinskaya, none of the studies could qualify as true impact evaluations. The literature review suggests that DPEP has certainly inculcated a spirit of doing research on primary education, which did not exist in the country prior to the program. However, most studies are limited to studying trends in processes and outcomes in DPEP districts. A few studies do compare DPEP and non-DPEP districts in terms of achievement against outcomes (for example, Agarwal, 2000).
However, even these studies are not impact evaluations since they do not statistically control for non-project related factors when comparing outcomes across project and non-project districts.
Thus, this report is unable to measure accurately the magnitude of the net impact of DPEP based on this literature review, except to a limited extent for DPEP I based on Jalan and Glinskaya. It has thus evolved to become an assessment of the progress made by DPEP I and II in achieving its objectives and understanding the successes and limitations of its program of interventions in order to inform future initiatives in educational reform.
1.8 Nevertheless, it must be kept in mind that the 1990s was a period of considerable progress in educational indicators for India. The net primary enrolment ratio, for example, rose from 72 percent in 1992-93 to 83 percent in 1998-99 (National Family Health Surveys). The primary school completion rate also rose from 55 percent in 1992-93 to 60 percent in 1998-99. DPEP was one of the few programs that undertook major non-recurrent expenditure on and a wide range of interventions in primary education. This allowed educational administrators to innovate and focus on improving education in a context where 95 percent of states expenditures on education were and continue to be on salaries.
The only other major centrally sponsored scheme for this sector was the Midday Meal Program, which in most states was a dry grains distribution scheme, and in a few states, was a cooked noon meal scheme which would probably have had some impact on enrolment as well. Given this context, and the progress made in educational indicators during the 1990s, DPEP did contribute to this progress. In addition, it has played an important role in changing processes such as community mobilization and textbook revision that would have longer term impact on educational indicators.
1.9 The concluding section of this report discusses a few possible impact evaluation studies that could be done to be able to get, ex-post, further evidence on the net impact of DPEP. However, it is clear from available project data and the literature review that a better monitoring and evaluation design of the projects ex-ante would have certainly enabled them to be evaluated more effectively. The major limitation in doing ex post evaluation studies when these were not kept in mind while designing the project are that they have to be based on available data. There are no comparable quantitative or qualitative data/studies, either baseline or end term, for example, across project and non-project districts on learning achievement, classroom practices, or planning and management systems, improving all of which were objectives of DPEP I and II. For the other objectives on improving and reducing gender and social disparities in enrolment and completion rates, household data may be used to compare across project and non-project districts as done for DPEP I in Jalan and Glinskaya. Even to be able to do systematic evaluations of the impact of specific components such as a study on the impact of teacher training on classroom processes within DPEP districts, baseline data on classroom processes would need to be available and these are not. Lessons learnt for designing the monitoring and evaluation component of future programs are also discussed in the concluding section of this report.
1.10 Since there is considerable variation in the quality of the studies and therefore the reliability of their conclusions, the report draws on those studies that the authors felt were to some extent rigorous.
These studies are explicitly mentioned in the text of this report. Most of the studies that are not explicitly drawn upon and mentioned in the report were found to be methodologically unsound and therefore unreliable.4 Most of the quantitative studies, for example, use descriptive statistics to report on findings, making their interpretation very limited. In other cases, findings and policy recommendations in some studies are not linked clearly to the analysis undertaken and seem to be based on the authors personal biases. For most of the qualitative studies that have not been directly used in this report, the methodologies used are not clear. The report also tends to focus on the findings of more recent studies, indicative of the current performance of the project, rather than studies done earlier on during the project period. The way in which the studies
are used depends on the type of study. For instance, the results from national studies, particularly those that are quantitative and evaluative, are generalized for the projects. In the section on project interventions since most of the studies are qualitative, the cumulative evidence is used to indicate the impact of project interventions. Some state level studies, both quantitative and qualitative, are used to draw out inter-state differences.
1.11 The financial design of the program was that state governments were supposed to contribute 15 percent of the cost of the project for their state to the pool of resources allocated to the project. The remaining 85 percent has been funds from external funding agencies routed via the Government of India (as a centrally sponsored scheme). The total amount of funding under DPEP is on the order of two percent relative to the total elementary education spending by the central and state governments. However, DPEP is different from other centrally sponsored schemes in elementary education in that it has allowed far more flexible allocation of financial resources across the components of the projects, within the overall upper limit of Rs. 40 crores at the district level (Bashir, 2000). An important feature of the design of DPEP was that it attempted to enhance the financial allocations to elementary education by the government. DPEP project funds increased the allocation for elementary education by about 17.5 to 20 percent (Pandey, 2000). In addition, the legal agreements of the projects specified that the state governments had to maintain at least their existing levels of expenditure on elementary education. Bashir and Ayyar (2001) comment on whether this has occurred in reality. They conclude that, in general, state governments have fulfilled this condition. Real elementary expenditures have increased relative to the first year of the projects.
However, they also find that plan expenditures on elementary education by state governments have fluctuated considerably over the project period. Thus, state governments continue, by and large, to depend on centrally sponsored schemes to fund investments in improving the quality of primary education. State governments
expenditures fund primarily teachers salaries.
4 All studies that were reviewed are, however, mentioned in the references
A. Progress in enrolment A. Progress in enrolment A. Progress in enrolment A. Progress in enrolment A. Progress in enrolment
2.1 A key objective of DPEP was to increase the enrolment of six to eleven year old children in primary school. While no specific targets were set for the increase in enrolment for DPEP I and II (besides stating that universal access would be provided), the guidelines and the Staff Appraisal Reports emphasized reducing gender and social disparities in enrolment rates and specified that these differences would be reduced to less than 5 percent in project districts. It is unclear what is meant by providing universal access. An Education Monitoring Information System (EMIS) was set in place in all project districts to enable states to collect fairly reliable data on enrolment and related parameters.
These data are collected annually from schools in September. As mentioned earlier, a critical limitation of these data is that they were collected only for project districts making any comparison with non-DPEP districts based on these data not possible. For enrolment, available household data could be used to do such impact evaluations. However, while a few of the studies reviewed do draw interesting conclusions about reasons for increasing or declining enrolment, they do not compare and evaluate the changes in educational outcomes within DPEP districts to those in non-project districts. The analysis in this section is thus limited to assessing the progress made towards increasing enrolment and reducing gender and social differences in enrolment in project districts. Only one study by Jalan and Glinskaya (2002) uses household data for DPEP I districts to do a rigorous impact evaluation. Results from this study are discussed later in this section.
2.2 The analysis in this section is based on EMIS data received directly from the states. These data (upto 2001) have also been analyzed by Agarwal
in his report, Progress towards Universal Access and Retention. This section draws on his analysis as well as other studies done at the national and state level on enrolment. However, it was felt that it would be useful to get raw data from the states so as to directly compute updated enrolment trends as well as analyze the raw data directly in addition to reviewing existing analyses.
This section first studies the trends in total enrolment as a whole and for the target groups in DPEP I and II. Next, the differences amongst states are highlighted drawing on data and a few existing studies that were reviewed. Finally, this section draws upon a study by Jalan and Glinskaya (2002) to illustrate the net impact of DPEP I on enrolment outcomes.
2.3 How successful were DPEP I and II in raising enrolments and reducing gender and social enrolment gaps? The data reveal that total enrolments have risen considerably in both DPEP I and II. The total enrolment in DPEP I states (for which EMIS data were available from states) rose by about 6 percent between 1996-97 and 2001- 02 excluding MP since MP Phase I data were not available from the state. Agarwal (2002) finds an overall increase of almost 13 percent in total enrolment in DPEP I districts when Madhya Pradesh was included. The corresponding rise in DPEP II states (for which EMIS data were available from states) was higher at almost 19 percent between 1997-98 and 2001-02.5 Figures 1.1 and 1.2 illustrate the rise in total enrolment in DPEP I and DPEP II over the project period using data obtained from the states.
However, the rise has been concentrated heavily in a few states: Gujarat, Karnataka, Madhya Pradesh, and Uttar Pradesh.
II. ASSESSMENT OF THE PR II. ASSESSMENT OF THE PR II. ASSESSMENT OF THE PR II. ASSESSMENT OF THE PR
II. ASSESSMENT OF THE PROGRESS OGRESS OGRESS OGRESS OGRESS T
T T
T TOW OW OW OWARDS OUTCOMES OW ARDS OUTCOMES ARDS OUTCOMES ARDS OUTCOMES ARDS OUTCOMES
1.12 This report first assesses progress made towards project outcomes in DPEP I and II, namely enrolment, retention and learning achievement.
Next it discusses the inputs and processes in the program and the extent to which they were successfully implemented. The concluding
section of the report brings together the outcomes, the inputs and the processes and summarizes important dimensions to be considered in future programs. In addition it outlines the areas, which require further analysis and research.
5 DPEP II does not include Bihar and Jharkhand which was a separate project. Agarwals reports include districts from Bihar and Jharkhand in DPEP II. Thus he finds a lower increase in enrolment for DPEP II than what is reported here since enrolments in Bihar and Jharkhand actually fell during the project period.
2.4 Total enrolment for all categories except Scheduled Tribes (ST) for DPEP I i.e. total, boys, girls and Scheduled Castes (SC) rose for the first three years of the project (i.e. until 1998-99), but then stagnated and declined. For the ST children in DPEP I enrolment rose until 1999- 2000 and then declined. In DPEP II districts, as a whole, total overall enrolment, boys enrolment, and girls enrolment rose until 2000-01 but declined in the last year, 2001-02. For SC and ST children in DPEP II, total enrolment rose until 1999-2000 quite substantially, but declined after that. Also, the ST enrolment in many districts still remains low compared to their share of the population, particularly due to the stagnation/
decline in enrolment over the last three years (Agarwal, 2001).
2.5 Absolute increases in enrolment do not, of course, capture the growth in enrolment relative to population growth. Unfortunately, age disaggregated population numbers are not available as yet from the 2001 census in order to compute updated gross and net enrolment figures. While the objectives of DPEP I and II had universal access as an objective, it is not clear what is meant by this term. A benchmark to judge against would be universal enrolment.
From National Family Health Survey household data of 1998-99 (latest available education related household
data), the net enrolment ratio was 83 percent. However, these numbers are not available for the DPEP I and II districts s e p a r a t e l y . N e v e r t h e l e s s , Aggarwal (2001) does compute GERs and NERs for DPEP districts
but asks the reader to treat these with extreme caution keeping the limitations of not having data on p r i v a t e u n r e c o g n i z e d schools and u p d a t e d p o p u l a t i o n numbers in mind.
For DPEP I districts, the GER increased from 92.5 percent for recognized schools to 98.2 percent for recognized plus alternative schools over the project period. For DPEP II, however, except for Gujarat and Madhya Pradesh, the GER did not increase significantly over the project period and was about 85.5 percent in 2000-01 (In UP, the other state where enrolments rose considerably, however, only three districts reported these data).
2.6 There was higher growth in girls enrolment on the order of 6.6 percent (excluding MP for Phase I) and as high as 25 percent in DPEP I and DPEP II respectively. Agarwal (2002) also demonstrates that the share of girls enrolment to total enrolment increased from 45.6 percent in 1995-96 to 47.8 percent in 2001-02 for Phase I districts. For Phase II districts this increase was from 43.6 percent in 1996-97 to 46.1 percent in 2001-02. The trends for girls enrolment in both DPEP I and II districts in the various states has followed the same pattern as overall enrolment described above. In states where enrolment increased, girls enrolment increased faster (except in Phase I districts in Karnataka).
Similarly in states where enrolment decreased, girls enrolment decreased less (except in Phase I districts in Maharashtra and Phase II districts in Haryana and Kerala). Since girls were a
T T T T
Table 1: DPEP I : Enr able 1: DPEP I : Enr able 1: DPEP I : Enr able 1: DPEP I : Enr able 1: DPEP I : Enrolment T olment T olment T olment T olment Trrrrrends ends ends ends ends (in thousands)
(in thousands) (in thousands) (in thousands) (in thousands)
1996-97 1997-98 1998-99 1999- 2000-01 2001-02 Percentage
2000 increase
Total Enrolment 4882.4 5227.4 5408.8 5362.9 5253.4 5166.7 5.82
Boys enrolment 2548.9 2715.1 2805.6 2779.4 2716.9 2679.4 5.12
Girls enrolment 2333.5 2512.3 2603.2 2583.5 2536.5 2487.3 6.59
SC enrolment 1055.5 1127.1 1152.6 1149.3 1101.6 1117.1 5.83
ST enrolment 483.0 613.9 663.0 669.4 594.2 610.3 26.35
T T T T
Table 2: DPEP II : Enr able 2: DPEP II : Enr able 2: DPEP II : Enr able 2: DPEP II : Enr able 2: DPEP II : Enrolment T olment T olment T olment T olment Trrrrrends ends ends ends ends (in thousands)
(in thousands) (in thousands) (in thousands) (in thousands)
1997-98 1998-99 1999-2000 2000-01 2001-02 Percentage increase Total Enrolment 11531.7 12493.5 13913.4 14272.8 13714.7 18.93 Boys enrolment 6447.9 6932.1 7639.8 7843.8 7366.3 14.24 Girls enrolment 5083.8 5561.4 6273.5 6429.1 6348.4 24.88
SC enrolment 2465.0 2713.6 3124.5 3086.8 2936.8 19.14
ST enrolment 1343.5 1449.3 1551.5 1512.1 1617.7 20.42
0 2000000 4000000 6000000 8000000 10000000 12000000 14000000 16000000
Total enrollment
Boys' enrollment
Girls' enrollment
SC enrollment
ST enrollment
1997-98 2001-02
Number Enrolled
FFFFFigur igur igur igur igure II : Enr e II : Enr e II : Enr e II : Enr e II : Enrolment T olment T olment T olment T olment Trrrrrends: DPEP II ends: DPEP II ends: DPEP II ends: DPEP II ends: DPEP II
Source: EMIS data obtained from states.8
0 1000000 2000000 3000000 4000000 5000000 6000000
Total enrollment
Boys' enrollment
Girls' enrollment
SC enrollment
ST enrollment
Number enrolled
1996-97 2001-02
FFFFFigur igur igur igure 1 : Enr igur e 1 : Enr e 1 : Enr e 1 : Enr e 1 : Enrolment T olment T olment T olment T olment Trrrrrends: DPEP I ends: DPEP I ends: DPEP I ends: DPEP I ends: DPEP I
Source: EMIS data obtained from states.7
6 Index of Gender Equity (IGE) is the proportion of girls enrolled relative to the proportion of girls in the relevant population, expressed in percentage terms. The Index of Social Equity for SC and ST children is used. However the meaning of this index is questionable since this index represent the proportion of students enrolled rather than the proportion of students from these communities in the population. For example, the index could be very high for SC but this could indicate that most non-SC students are going to private schools rather than the enrolment of SC students in the population.
7 EMIS data for Chattisgarh and Madhya Pradesh were not available at this time.
8 EMIS data for Chattisgarh, Orissa, and West Bengal were not available at this time.
specific target group in both projects, it is encouraging that their enrolment, for the most part, increased by a greater percentage than that of boys. A study by Ed.Cil (2002) on strategies to increase girls participation in primary school in DPEP I and II also concludes that DPEP has been, in general, successful in this regard as the numbers indicate. Pandey states that over 95 percent of Phase I districts have achieved an Index of Gender Equity of over 95 percent thus reaching the stated DPEP goal.6
2.7 Children with mild to moderate disabilities were also a target group in DPEP I and II. Guidelines for their integrated education were developed three years after DPEP I began and, initially, efforts were concentrated in one or two blocks in each district. Funds were available to hire and train three teachers per block in three different disabilities (Pandey, 2000). Some states, such as Haryana, have made better progress in this area but much still needs to be done. Disabled students currently constitute 1 percent of total enrolment in all DPEP projects put together. Of these almost half are orthopaedically disabled, another 14 percent are blind, about 13 percent are dumb, another 13 percent are mentally challenged, about 9 percent are deaf, and the remaining 7 percent have other kinds of disabilities (Agarwal, 2002). However, there is very little information and only a handful of studies that focus on disabled children in DPEP.
Much more work needs to be done to gauge the success of the program in reaching out to disabled children and providing integrated education.
2.8 There were wide variations across states in enrolment trends during the project period (see
Figures III and IV below). Enrolments rose substantially in Karnataka in Phase I districts by as much as 24 percent and Phase II districts by 11.5 percent. The Indian Institute of Management (IIM) study on DPEP, Karnataka, concludes that the total non enrolled population in DPEP I districts in Karnataka is below 5 percent indicating that universal access has almost been achieved here. (Sherry Chand, 2002). The slight decline in Class I enrolment after 1998 is attributed in the IIM study to falling child population. In DPEP II, Gujarat also had a significant increase in enrolments of almost 25 percent. Both Madhya Pradesh and Uttar Pradesh (DPEP II) had a sizeable surge in enrolments not only for the overall child population but also for all the target groups (boys, girls, SC and ST). The study on DPEP I in Madhya Pradesh conducted by IIM (Singh, Sridhar, and Bhargave, 2002) also concludes that M.P. has done commendable work as far as access and enrolment is concerned. M.P. also launched the Education Guarantee Scheme in 1997 where communities from habitations without schools within a one kilometer radius and with 40 children in the 6-11 year old age group have the right to demand a school and this demand has to be met in 90 days. This is the form that
alternative schooling has taken in M.P. and this has been a major success in terms of increasing enrolment and reaching out to the DPEP target groups.
2.9 In contrast, total enrolments fell in Kerala (Phase I and II), Maharashtra (Phase I) and slightly in Haryana (Phase II). While in Kerala this decline is explained by declining child population, there were no available studies that correlated the child population decline with declining enrolment.
Aggarwal (2001) does explain that states like Kerala and Tamil Nadu have reported decline in age specific population. In Maharashtra, this decline is more puzzling though it may be explained partly by less successful implementation of some project components (discussed in more detail in Section III on project interventions). One study (Pillai, 1999) does record declining enrolments in DPEP I districts in a sample she studies. However, the study does not attempt to explain the reasons for the decline. In Haryana, a study by Aggarwal (2000) found that a key reason for the declining enrolment in government schools was the mushrooming of private unrecognized schools, data from which were not included in EMIS.
2.10 In Assam and Tamil Nadu, enrolments rose in Phase I districts but fell in Phase II districts. This is particularly surprising since Phase II districts, were, in general, more advanced districts. Once again in Tamil Nadu this may be explained by declining child population. One study by Ed.Cil (Ed.Cil, 2000) found that there was evidence of a declining child population in Tamil Nadu.
However, a statistical analysis of the extent of population and enrolment decline and the correlation between these was not done. This
study also found that there was a spurt in enrolment in several districts in UP, Maharashtra and Tamil Nadu in 1997 which included a large number of underage children. The study asserts that this explained some of the decline in the following years in these states. Another study (Panneerselvam, 2002) in two districts of Tamil Nadu found that in the years that Class I enrolment fell in government and aided schools, enrolment rose in private unaided schools, indicating that this is the reason for declining enrolment in the EMIS data.
2.11 The 20 percent decline in Phase II districts of Assam, however, is not easily explained. A possible explanation is the movement from government to private schools since enrolment in private schools was not captured by EMIS data.
An analysis of the data from individual districts reveals that the decline occurred in all of the Phase II districts in Assam. In addition, the decline was primarily in Class I i.e. in intake rather than due to falling number of repeaters or higher dropouts. In some districts in Assam, numbers of venture schools (a type of alternative school) have increased rapidly. Since these data are not systematically included in EMIS, some studies (Meridian Consultancy, 1999) indicate that this is one of the reasons for apparently declining enrolment in Assam in EMIS data.
Sarma (2001) finds that the declining enrolment is due to an increase in the number of private schools in DPEP II districts.
Source: EMIS data obtained from states.10
150000 1150000 2150000 3150000 4150000 5150000 6150000
1997-98 1998-99 1999-2000 2000-01 2001-02 Year
M.P.
U.P.
Haryana Orissa HP Assam Kerala Maharashtra Karnataka Tamil Nadu Gujarat
Number enrolled
FFFFFigur igur igur igur igure IV e IV e IV e IV e IV: T : T : T : Trrrrrends In T : T ends In T ends In T ends In T ends In Total Enr otal Enr otal Enr otal Enr otal Enrolment: DPEP II olment: DPEP II olment: DPEP II olment: DPEP II olment: DPEP II
250000 450000 650000 850000 1050000 1250000 1450000 1650000 1850000
1996-97 1997-98 1998-99 1999- 2000
2000-01 2001-02
Year
M.P.
Haryana Assam Kerala Maharashtra Karnataka Tamil Nadu
Number enrolled
FFFFFigur igur igur igure III: T igur e III: T e III: T e III: T e III: Trrrrrends On T ends On T ends On T ends On T ends On Total Enr otal Enr otal Enr otal Enr otal Enrolment: DPEP I olment: DPEP I olment: DPEP I olment: DPEP I olment: DPEP I
Source: EMIS data obtained from states. 9
9 EMIS data for Chattisgarh and Madhya Pradesh were not available at this time.
10 EMIS data for Chattisgarh, Orissa, and West Bengal were not available at this time
2.12 In Himachal Pradesh (Phase II), total enrolment rose by 2.5 percent although it has remained almost stagnant for the last three years. Dev et al (2000) found that the declining enrolment in Class I in some districts was due to large numbers of underage children enrolled in the first few years of the project. In addition, there was a slight decline in the child population in the villages sampled.
2.13 The analysis above reveals that universal access, defined as universal enrolment, has not been achieved for DPEP I and II as a whole, although substantial progress has been made in terms of increasing enrolment, particularly in the states of Karnataka, Gujarat, Madhya Pradesh and Uttar Pradesh. Some anomalies remain unexplained in terms of declining enrolment in states like Assam (DPEP II districts). The DPEP goal of achieving less than five percent difference in enrolment rates between boys and girls was achieved for 95 percent of the districts.
However, the goal of reducing the social differences to less than five percent was not achieved for most districts For measuring the latter, the Index of Social Equity for SC and ST children is used. However, as explained earlier, the meaning of this index is questionable since it represent the proportion of students enrolled rather than the proportion of students from these communities in the population. The analysis also raises the issue that it is not appropriate to set uniform national targets in a large country like India, with wide inter-state and inter-district variations in terms of baseline enrolment and baseline gender and social differences in enrolment. The concluding section of this report talks more about the need for differential targets which are more realistic for different Indian states.
2.14 All the studies reviewed above and project data used here focus the analysis on what has happened within the project districts. Jalan and Glinskaya (2002) use household data from the National Sample Survey (Round 50, 1993-94 and Round 55, 1999-2000) for DPEP I districts to evaluate the net impact of DPEP I on enrolment and completion. They find that average school enrolment for children aged 6- 10 years increased from less than 75 percent to about 80 percent in DPEP I districts. They confirm Aggarwals finding that the rate of change was higher in DPEP I versus non DPEP districts. They also find that, within DPEP districts, the rate of
increase of enrolment of the 6-10 year olds was higher amongst girls than amongst boys. In addition, NSS data reveal that the rate of enrolment increase for SC children was much higher in DPEP when compared with non-DPEP districts. For ST children, however, this was not the case. Some figures from their analysis are included in the annex to this report. These results change substantially, however, once they use statistical methods to control for the impact of other factors on outcomes.
2.15 It is important, however, to assess the marginal impact of DPEP i.e. the additional impact on enrolment compared to the counterfactual hypothetical situation where the program was not implemented in the district. Jalan and Glinskaya (2002) attempt to measure the net
impact of DPEP I on several educational outcomes including enrolment i.e. they attempt to answer the hypothetical question What would have happened in a district in the absence of DPEP? Obviously there might have been some improvement in enrolment and other educational indicators even in the absence of DPEP. However, as the authors explain, one cannot just compare the average outcomes in project and non-project districts. However, since districts were selected for DPEP in a non-random manner (based mainly on the criteria of them having below average female literacy rates), this methodology would not yield accurate results.
2.16 The methodology of the propensity score matching technique used by the authors allows them to attempt to estimate the additional impact of DPEP. This methodology matches districts within a state based on certain characteristics which would have made their probabilities of being selected for the program very similar. These include factors such as female literacy rate, population density, SC/ST concentration, village and household infrastructure characteristics and educational facilities available. The propensity score matching estimator pairs each program participant with an observably equivalent non- participant and then interprets the difference in their outcomes as the mean effect of the program on the treated (p.10, Jalan and Glinskaya).
Further, they use a difference in difference (DID) matching estimator which computes the difference in outcomes before and after the program in project and non-project districts.
2.17 The authors conclude that DPEP I had a small positive net impact on enrolment (defined as enrolment rate) of 6-10 year old children, once other factors are controlled for. Thus they conclude that the net impact of the program is much smaller than the gross impact. In their analysis Madhya Pradesh stands out as the state where the program had the most dramatic impact. The net impact on all childrens enrolment rate is estimated to be about 1.32 percent overall and 3.03 percent for Madhya Pradesh alone. They find a larger positive impact for SC children as well and substantial impact for ST children in MP (sample sizes for ST children in other states were too small) and almost negligible impact for 6-10 year old girl children.
The study does conclude, however, that there was greater net impact of DPEP I on older girls and boys (11-13 year olds). This is interesting as it could indicate that there might be a higher proportion of overage children in DPEP I districts as compared with non-DPEP districts. This could be particularly relevant for the finding that DPEP has not had any net impact on younger girls.
This could be either because girls start school late or there are higher repetition rates amongst girls in project districts as compared with non- project districts. This needs further investigation to understand the implications of DPEPs impact on girls enrolment. The index of gender equity from project EMIS data, as described earlier, reveals that striking progress has been made with respect to increasing girls enrolment in DPEP.
Jalan and Glinskaya do not find this in terms of net impact for 6-10 year old girls. However, it is important to further investigate whether this is because the marginal impact has been mainly on older girls. Along the same lines, there are a large number of underage children who are enrolled in school (as we see from EMIS data) and the data used by Jalan and Glinskaya do not include five year olds. The authors conclude that while they do find positive net impacts of DPEP I on enrolment rates, these impacts are not as substantial as expected apriori. They also study the net impact of DPEP I on completion rates. This is discussed in the next section on dropout and completion.
2.18 It is difficult, of course, to isolate the impact of DPEP relative to other programs. To the extent that DPEP was supposed to act as a catalyst and complement other efforts to achieve its goals, the net impact of the program is not a true
estimate of its contribution. Indeed in many states, DPEP interventions such as inservice teacher training and textbook revision have been undertaken in non-DPEP districts. In some states, institutional structures like village education committees and academic support structures such as block and cluster resource centers were also set up in non-DPEP districts in the later years of the projects. These state-wide interventions which were a result of states consciously adopting policies of initiating DPEP interventions in non-DPEP districts, make it difficult to compare project and non-project districts. While the authors acknowledge this limitation, the magnitude of the implication of this on their results cannot be assessed. In many ways, the catalytic effect it has had might be the most important contribution of DPEP to elementary education in the country.
2.19 Nevertheless, it is important to understand the net impact to understand the additional direct impact of the program in the treatment districts.
It would also be useful to study the impact of DPEP separately for the six DPEP I states since states such as Kerala, Tamil Nadu and Maharashtra where enrolment was already high (and where project data also indicate stagnating/
declining enrolments largely due to declining child population or very hard to reach children left out of school) should ideally be separated from Haryana, Karnataka, Assam and MP.
However, due to limitations of sample size, the authors are unable to do this analysis. The concluding section of this report discusses possible extensions of this kind of impact evaluation.
B.
B. B.
B.
B. Progress in reducing repetition/ drop- Progress in reducing repetition/ drop- Progress in reducing repetition/ drop- Progress in reducing repetition/ drop- Progress in reducing repetition/ drop- out and improving retention/comple- out and improving retention/comple- out and improving retention/comple- out and improving retention/comple- out and improving retention/comple- tion.
tion. tion.
tion. tion.
2.20 Another central objective of both DPEP I and II was to reduce dropout rates to less than 10 percent i.e. increase completion rates to over 90 percent of all children enrolled. Further, a second objective was to reduce gender and social disparities in the dropout rates to less than 5 percent. In recent years some studies have been done both at the national level using EMIS data (Shrivastava, 2001; 1999) and in various states such as Tamil Nadu, Maharashtra, Karnataka using household data, to compute the cohort dropout rate and the retention/completion rates
T T T T Table 3: able 3: able 3: able 3: able 3:
Chang Chang Chang Chang
Changes in CDR: 1997-98 T es in CDR: 1997-98 T es in CDR: 1997-98 T es in CDR: 1997-98 T es in CDR: 1997-98 To 1998-99 o 1998-99 o 1998-99 o 1998-99 o 1998-99
No. of districts CDR fell CDR remained CDR rose the same
DPEP I 16 10 14
DPEP II 46 12 21
by using the reconstructed cohort method. The retention rate is defined in these studies as the percentage of children who, after entering Grade 1, complete the full cycle of primary school (Grade 5 in most states and Grade 4 in some).
The cohort dropout rate (CDR) is 100 minus the retention rate. The intake in Grade 1, grade- wise repetition and crude dropout rates from EMIS data are used to compute the CDR/retention rate.
2.21 Shrivastava (2001) concludes that in 1998-99, the DPEP goal of achieving a CDR less than 10 percent was achieved in very few districts (except in Kerala where five of the six districts had achieved this target). About 27 percent or 11 districts in Phase I had achieved this target by 1998-99. For Phase II districts, the study concludes that about 16 percent or 12 districts (of those for which data were available) achieved the target of a CDR below 10 percent. Of course in 1998-99 there were still four years left for DPEP II to close.
2.22 Shrivastava also examines the trends in the CDR between 1997-98 and 1998-99 (see Table 3 below). It is a real matter of concern that the dropout rate actually rose between the two years in as many as 14 districts in DPEP I and 21 districts in DPEP II. The reasons for this are not well understood/documented.
2.23 The CDR was still very high in some districts, particularly in Assam and Uttar Pradesh. In these states, over fifty percent of the districts have CDR greater than 50 percent, indicating that more than half the children enrolled in Grade 1 in these districts do not complete primary school.
Using latest available EMIS data from 2001-02, CDRs were calculated by Shrivastava for a few states. The CDRs seem to have risen even higher in several districts in UP and Assam. Overall, the number of districts that have achieved the 10 percent CDR goal of the program in both Phase I and II seems to have actually fallen relative to earlier years. Shrivastava proposes
some possible reasons why the dropout rate has not fallen in some states, particularly in Assam, UP and some districts of Orissa. One reason could be the enrolment of many underage children. Secondly, the EMIS data does not include data from private unrecognized and some alternate schools. It is possible that some of the dropouts actually attend one of these schools. There have been a few studies investigating the reasons for persistently high dropout and repetition rates in some districts/
states and the improvement in dropout rates in others. The variation in implementation of various interventions, particularly the extent of community mobilization, explains some of the variations across states and districts. These studies are discussed in the next section on project interventions.
2.24 There have, however, been problems with measuring dropouts and completion rates using EMIS data. Repetition data, in particular, from the EMIS, has been of variable quality and some of these results may not be very credible. A few states have therefore undertaken cohort studies using the true cohort method where the actual progression of students was followed in an attempt to develop alternative estimates of cohort dropout and completion rates. Agarwal (2001) summarizes the results from these studies in the states of Karnataka, Maharashtra and Tamil Nadu. In Maharashtra, the cohort study conducted in 1999-2000 found cohort dropout rates which were even higher than those calculated from the EMIS data (except in one district). The results from the cohort study in Karnataka conducted in the same year found more mixed results, where the cohort dropout rate was higher than that calculated from EMIS data for some of the districts but lower for others.
The Tamil Nadu cohort studies in 1999-2000 also found cohort dropout rates higher than those calculated from the EMIS data.
2.25 Districts in both phases I and II performed better in terms of achieving the second goal of reducing gender differences in dropout rates to less than 5 percent. 76 percent of Phase I districts and 73 percent of Phase II districts had achieved this target by 1998-99 for the difference in the CDR between boys and girls (Phase I became effective
11 These data will be updated with newer data once the report for 2001- 02 is finalized.