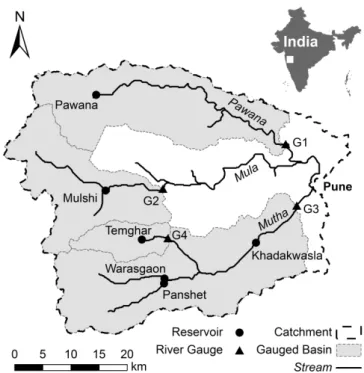
UPSTREAM OF P UNE , I NDIA ULA AND M UTHA R IVERS CATCHMENT ON THE WATER RESOURCES OF THE M I MPACTS OF CLIMATE CHANGE AND LAND USE CHANGE
119
0
0
Volltext
(2)
(3)
(4)
(5)
(6)
(7)
(8)
(9)
(10)(11)
(12)
(13)
(14)
(15)
(16)
(17)
(18)
(19)
(20)(21)
(22)
(23)
(24)
(25)
(26)
(27)
Abbildung
+7

ÄHNLICHE DOKUMENTE
Summary: Impacts of Climate Change on Natural Hazards and Land Use in the Saas and Zermatt Valleys Switzerland The aim of Swiss land use planning.. guarantee an expedient and
3 Results 3.1 Regional optimization of land management 3.1.1 Variability of model outputs We first analyzed the sensitivity of indicators of three important agricultural
extracted from Landsat images was developed to predict the snail habitats at a small scale. hupensis habitats were predicted around the three study lakes. In conclusion, our work
Then detailed modelling should be performed to study the impacts of the increased humidity of the basin on its climate (this task if out of the scope of this paper). With
Direct demand for land is the demand for land that is used directly for consumption of land, guided by market signals such as land prices and land rent regulating supply and demand
In the present analysis, three temperature scenarios (no change, +2°C, and +4°C) were combined with five precipitation scenarios (no change, ±10%, and ±20%) to make fifteen
The next step was t o construct the water balance scenario for 2 x C02 climate based on the mean monthly temperature increments and monthly ratios of 2 x COs and 1 x C02
Sensitivity of runoff t o climatic and other environmental changes is of particular interest t o water resource planners and decision makers because alterations in surface
