Role of neuronal IGF-1R signaling for the pathogenesis of Alzheimer’s disease
I n a u g u r a l - D i s s e r t a t i o n zur
Erlangung des Doktorgrades
der Mathematisch-Naturwissenschaftlichen Fakultät der Universität zu Köln
vorgelegt von Moritz M. Hettich
aus Rio de Janeiro Köln 2009
Berichterstatter:
Prof. Dr. Jens C. Brüning
Prof. Dr. Wilhelm Krone
Tag der letzten mündlichen Prüfung: 25.06.2009
Für Dich, Mama.
I
1 INTRODUCTION 1
1.1 ALZHEIMER`S DISEASE 2
1.2 HERITABLE CAUSES OF ALZHEIMER’S DISEASE 3
1.3 NEURITIC PLAQUES AND NEUROFIBRILLARY TANGLES 4
1.4 PROCESSING OF APP 5
1.5 CLEARANCE OF AMYLOID BETA (AΒ) 7
1.6 SECRETASES 8
1.7 IGF-1 SIGNALING CASCADE 9
1.7.1 INSULIN AND INSULIN-LIKE-GROWTH FACTOR-1 SIGNALING IN ALZHEIMER’S DISEASE 9
1.7.2 IGF-1 AND IGF-1R 10
1.7.3 IGF-1R/IR SIGNALING 11
1.8 MOUSE MODELS 13
1.8.1 CONDITIONAL IGF-1R KNOCK OUT (THE CRE/LOXP SYSTEM) 13 1.8.2 CRE RECOMBINASE EXPRESSION UNDER THE CONTROL OF THE SYNAPSIN-1 PROMOTOR 14
1.8.3 THE ALZHEIMER’S DISEASE MODEL TG2576 14
1.9 AIMS OF THIS THESIS 15
2 MATERIAL AND METHODS 16
2.1 CHEMICALS 17
2.1.1 BUFFER AND SOLUTION 19
2.1.2 KITS 20
2.1.3 PRIMARY ANTIBODIES 20
2.1.4 SECONDARY ANTIBODIES 22
2.2 MATERIALS 23
2.3 METHODS 24
2.3.1 ISOLATION OF GENOMIC DNA 24
2.3.2 QUANTIFICATION OF NUCLEIC ACID 24
2.3.3 POLYMERASE CHAIN REACTION (PCR) 24
2.3.4 ANIMALS, BREEDING AND GENOTYPING 25
2.3.5 HISTOLOGY AND IMMUNOSTAINING 25
2.3.6 METABOLIC CHARACTERIZATION, GLUCOSE, AND INSULIN TOLERANCE TESTS 26
2.3.7 ANALYSIS OF BODY COMPOSITION 26
2.3.8 ISOLATION OF CEREBELLAR GRANULE CELLS 26
2.3.9 IMMUNOBLOTTING 27
2.3.10 GEL ELECTROPHORESIS 27
2.3.11 WESTERN BLOT 28
2.3.12 SECRETASE ACTVITY ASSAYS 30
2.3.13 ELISA Β-AMYLOID1-40/42 31
2.3.14 STATISTICAL ANALYSIS 31
3 RESULTS 32
3.1 IGF1R EXPRESSION IN CEREBELLAR GRANULE CELLS OF NEURON-SPECIFIC IGF-1R
KNOCKOUT MICE (NIGF-1R-/-) 34
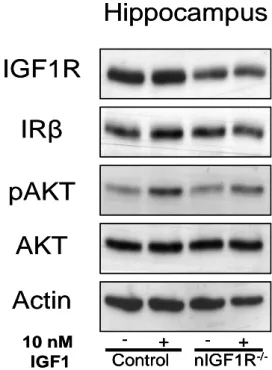
3.2 PATTERN OF SYNAPSIN-1 PROMOTER DRIVEN CRE RECOMBINASE ACTIVITY IN THE CNS 35 3.3 IGF-1R EXPRESSION IN THE CNS AND PERIPHERAL TISSUES OF NIGF-1R-/-MICE 36 3.4 IGF-1R SIGNALING IN HIPPOCAMPUS AFTER ACUTE IGF-1 STIMULATION 38
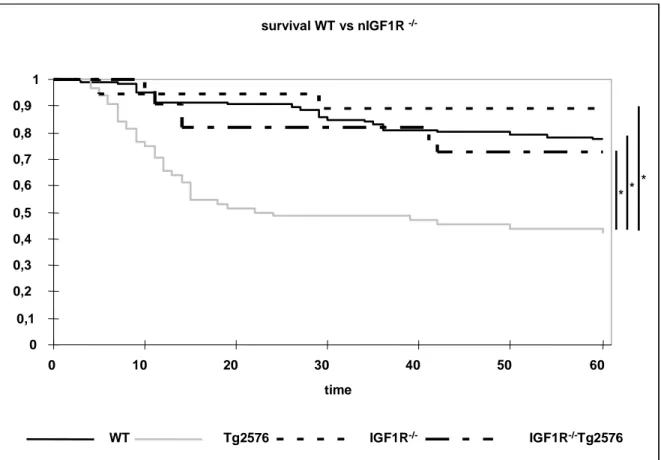
3.5 KAPLAN-MEIER ANALYSIS 39
3.6 METABOLIC AND SOMATIC CHARACTERISATION 42
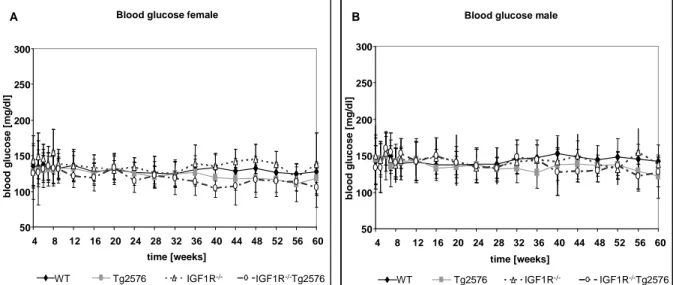
3.6.1 GLUCOSE HOMEOSTASIS 43
3.6.2 SOMATIC CHARACTERISATION 45
3.7 BIOCHEMICAL ANALYSIS OF 28 WEEKS OLD ANIMALS 51
3.7.1 ANALYSIS OF IGF-1R/IR SIGNALING 51
3.7.2 INVESTIGATION OF APP PROCESSING 52
3.8 BIOCHEMICAL ANALYSIS OF 60 WEEKS OLD ANIMALS 56
3.8.1 ANALYSIS OF IGF-1R/IR SIGNALING 56
3.8.2 INVESTIGATION OF THE APP PROCESSING 60
4 DISCUSSION 67
4.1 TG2576 MOUSE MODEL AND NEURON-SPECIFIC IGF1-R DELETION 68
4.2 METABOLIC CHARACTERISATION 69
4.3 SOMATIC CHARACTERISATION 70
4.4 SURVIVAL AND AGING 71
4.5 BIOCHEMICAL ANALYSIS OF THE IGF-1R/IR SIGNALING AND APP METABOLISM 72
4.6 PERSPECTIVES AND EXPERIMENTAL APPROACH 74
5 SUMMARY 76
6 ZUSAMMENFASSUNG 78
7 REFERENCES 80
8 SUPPLEMENTARY 93
III
8.1 ACKNOWLEDGMENTS 94
8.2 ERKLÄRUNG 95
8.3 CURRICULUM VITAE 96
Figure Index
Fig. 1-1 Illustration of APP processing by α-, β- and γ-secretases 6
Fig. 1-2 Illustration of IGF-1R/IR signaling cascade 12
Fig. 3-1 Illustration of the breeding strategy 33
Fig. 3-2 Cerebellar granule cells of nIGF-1R-/- mice 34 Fig. 3-3 β-Galactosidase staining representing Cre recombinase activity in synCre lacZ
reporter mice 35
Fig. 3-4 β-galactosidase staining representing Cre recombinase activity in the hippocampal
formation of synCre lacZ reporter mice 36
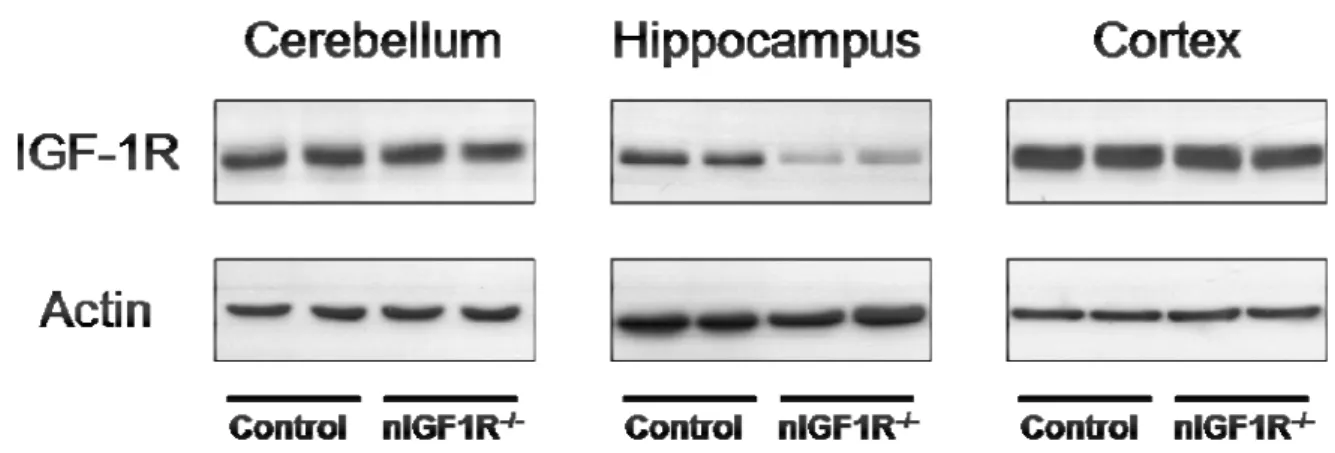
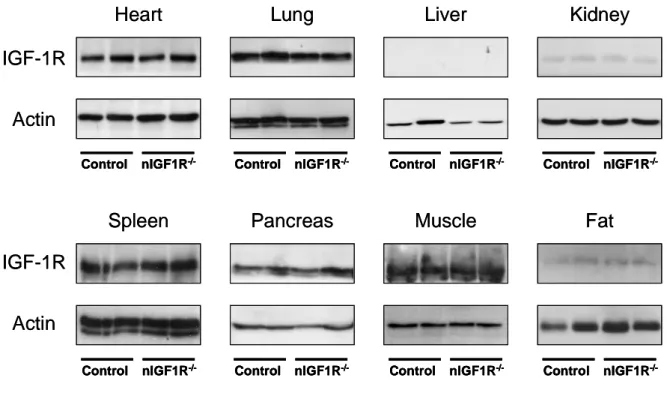
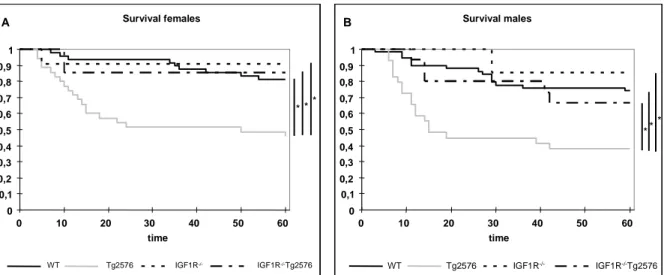
Fig. 3-5 Western blot analysis of IGF-1R protein expression in different brain regions 37 Fig. 3-6 Densitometric quantification of IGF-1R expression in the CNS 37 Fig. 3-7 Western blot analysis of IGF-1R protein expression in peripheral tissues 38 Fig. 3-8 Western blot analysis of IGF-1R expression of Hippocampus and Cortex 39 Fig. 3-9 Kaplan-Meier analysis of WT, Tg2576, nIGF-1R-/- and nIGF-1R-/-Tg2576 animals 40 Fig. 3-10 Kaplan-Meier analysis of WT, Tg2576, nIGF-1R-/- and nIGF-1R-/-Tg2576 females
and males 41
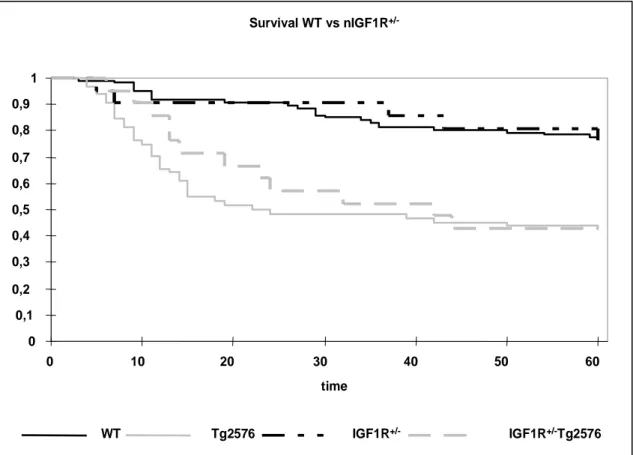
Fig. 3-11 Kaplan-Meier analysis of WT, Tg2576, nIGF-1R+/- and nIGF-1R+/-Tg2576 animals 42 Fig. 3-12 Blood glucose levels of male and female mice during 60 weeks of observation 43 Fig. 3-13 Glucose tolerance test of male and female mice 44 Fig. 3-14 Insulin tolerance test from male and female mice 44 Fig. 3-15 Body length of females and males of the study group 45 Fig. 3-16 Brain weight of females and males of the study group 46 Fig. 3-17 Body weight of 60 weeks old animals and growth curves of the different genotypes
47
Fig. 3-18 Fat content at 28 weeks 48
Fig. 3-19 Fat content at 60 weeks 48
ig. 3-20 Comparison of Fat content of 28 and 60 weeks old animals 49
Fig. 3-21 Brain-Body ratio of 60 weeks old mice 50
Fig. 3-22 Western blot analysis of IGF1-R/IR signaling of 28 weeks old mice I 51 Fig. 3-23 Western blot analysis of IGF1-R/IR signaling of 28 weeks old mice II 52
Fig. 3-24 Western blot and densitometric analysis of APP processing of 28 weeks old mice 53 Fig. 3-25 Western blot and ELISA analysis of Amyloid-β in 28 weeks old mice 54 Fig. 3-26 Western blot analysis of proteins involved in APP cleavage and Aβ clearance 55 Fig. 3-27 Western blot analysis of IGF1-R/IR signaling of 60 weeks old mice 56 Fig. 3-28 Densitometric quantification of IGF-1R, IRS-1 and IRS-2 protein expression in 60
weeks old mice 57
Fig. 3-29 Western blot analysis of ERK-1/2 58
Fig. 3-30 Western blot analysis of AKT and PTEN of 60 weeks old mice 58
Fig. 3-31 Western blot analysis of GSK-3 59
Fig. 3-32 Western blot analysis of Foxo1 59
Fig. 3-33 Western blot analysis of C-teminal fragments (CTFs) 60 Fig. 3-34 Quantification of Aβ1-40/42 in 60 weeks old Tg2576 and nIGF-1R-/-Tg2576 61
Fig. 3-35 Histochemical staining of Amyloid plaques I 62
Fig. 3-36 Histochemical stainings of Amyloid plaques II 62 Fig. 3-37 Western blot analysis of proteins involved in clearance of Aβ 63 Fig. 3-38 Western blot analysis of α-, β- and γ-secretases in hippocampus and cortex of 60
weeks old mice 64
Fig. 3-39 α-secretase activity assay 65
Fig. 3-40 β-secretase activity assay 65
Table Index
Table 2-1 Oligonucleotides used for genotyping 24
Table 2-2 SDS-PAGE mini gels (2 x) 28
V List of Abbreviations
AD Alzheimer's disease
ADAM A Disintegrin And Metalloprotease domain
AKT PKB synonym
α2M alpha 2 macroglobulin
apoE Apolipoprotein E
APP Amyloid Precursor Protein APS Ammonium‐persulfate
Aβ β‐Amyloid
BACE‐1 Beta‐site APP Cleaving Enzyme‐1 BBB Blood brain barrier
BME Basal medium eagle
BSA Bovine serum albumin
C83 83‐amino‐acid C‐terminal APP fragment C99 99‐amino‐acid C‐terminal APP fragment CNS Central Nervous System
CSF Cerebrospinal fluid ddH2O Double‐disalled water DMSO Dimethyl sulfoxide
eAD early onset Alzheimer's disease
ELISA Enzyme Linked Immunosorbent Assays
ER Endoplasmic reaculum
ERK Extracellular signal‐regulated kinase FAD familial Alzheimer's disease
FCS Fetal calf serum
GDP Guanosine‐diphosphate
GH Growth hormone
GRB2 Growth factor receptor binding protein 2 GSK‐3α/β Glycogen synthase kinase 3α/β
GTP Guanosine‐triphosphate HBSS Hank’s balanced salt solution
IDE Insulin degrading enzyme
IGF Insulin‐like growth factor
IGF‐1R Insulin‐like growth factor receptor type I
IR Insulin Receptor
IRa Insulin receptor isoform a
IRb Insulin receptor isoform b IRS‐1 Insulin receptor substrate 1 IRS‐2 Insulin receptor substrate 2 IRSs Insulin receptor substrates
kDA kilo Dalton
LOAD Late onset of Alzheimer's disease
mA milli Ampere
MAP‐kinase Mitogen‐acavated protein kinase
MEK Mitogen‐acavated protein kinase kinase NFTs Neurofibrillary tangles
NIDDM Non‐insulin‐dependent diabetes mellitus / type‐2 diabetes nIGF-1R-/- neuronal specific IGF-1R knockout
P/S Penicillin‐Streptomycin; Pen Strep
p3 Short pepade containing the C‐terminal region of Aβ PAGE Polyacrylamide gel electrophoresis
PBS Phosphate buffered saline
PDK1 Phosphoinosiade‐dependent protein kinase 1 PDVF Polyvinylidene difluoride
Pi3K Phosphaadylinositol‐tri‐phosphat kinase PIP2 Phosphaadylinositol‐di‐phosphat
PIP3 Phosphaadylinositol‐tri‐phosphat
PKB Protein kinase B
PP2A Protein phosphatase 2A
PSEN1 Presenilin 1
PSEN2 Presenilin 2
PTEN Phosphatase and tensin homolog
rpm Rotations per minute
sAPPα soluble APPα
sAPPβ soluble APPβ
SDS Sodium dodecyl sulfate
SDS‐PAGE Sodium dodecyl sulfate‐polyacrylamide gel electrophoresis SH2 Src‐homology 2
SHP2 SH2‐Phosphatase 2
SOS Son of sevenless
SPs Senile plaques
TACE Tumor necrosis factor-alpha converting enzyme TBS Tris buffered saline
VII TBS‐T Tris buffered saline 2% TWEEN 20®
TEMED N,N,N',N'‐tetramethylethylenediamine
Tg2576 Transgenig mouse model for Alzheimer’s disease TGN Trans‐Golgi network
TRkA Tyrosine kinase receptor A
TWEEN 20® Polyoxyethylene (20) sorbitan monolaurate (Polysorbate 20)
1 Introduction
Introduction
2 1.1 Alzheimer`s disease
In 1901 the german psychiatrist and neuropathologist Alois Alzheimer described a case of a middle aged woman called Auguste D. with strange behavioural symptoms and progressive loss of cognitive abilities. In 1906, after Auguste D. died, he published his first essay on this phenomenon and Auguste D. was the first person diagnosed with Alzheimer's disease (AD)1. AD is a chronic progressive neurodegenerativedisorder resulting in death after an average of 8–10 years after diagnosis2. Its clinical manifestation is typified by three groups of symptoms3.
o Cognitive dysfunction: In this group the symptoms include memory loss, language disabilities and executive dysfunction (that means, lossof higher level planning and intellectual coordination skills).
o Non-cognitivesymptoms: This group of symptoms comprises psychiatric symptoms and behaviouraldisturbance e.g. depression, hallucinations,delusions and agitation.
o The third group includes restrictions in performingactivities of everyday life (defined as "instrumental" for more complex activities such as driving and shopping and
"basic" for unaided dressingand eating).
The symptoms of AD progress from minor symptoms of memory loss, mild cognitive impairment to very severe dementia. Patients in their final stages of disease suffer from complete personality deterioration, incontinence and are dependent on others for basic activities of everyday life. Further criteria for AD are summarized in the Diagnostic and Statistical Manual of Mental Disorders4, criteria of the National Institute of Neurological and Communicative Disorders and Stroke and the Alzheimer's Disease and Related Disorders Association (now known as the Alzheimer's Association)5,6. In spite of that clinical diagnosis is still limited to “probable” or “possible” AD. Unequivocal diagnosis of definite AD continues to require post-mortem histological analysis of the brain.
Histopathological hallmarks of AD are neurofibrillary tangles (NFT) and senile plaques. The plaques are mainly composed of ~4 kDa peptides, the amyloid β peptides that are derived from proteolytic processing of a larger amyloid precursor protein molecule (APP).
Alzheimer’s disease is categorised according to its age of onset and/or mode of inheritance.
About 1–6% of all AD cases are early onset and are defined as having an age of onset before 65. About 60% of early-onset AD is familial, with 13% inherited in an autosomal- dominant fashion7,8. This type of Alzheimer’s disease is known as familial Alzheimer’s disease (FAD). Patients with FAD may develop symptoms as early as in their 30's or 40's.
Most cases of Alzheimer’s disease are part of the late onset type, occurring in individuals over 65 years of age, and are sporadic, without a family history.
The overall lifetime risk of any individual to develop dementia is approximately 10–12% but the highest risk factor for AD is advancing age9,10. First-degree relatives of a person with AD have a cumulative lifetime risk of developing AD of about 15–30%11,12. Disagreement exists as to whether the age of onset of the affected person changes the risk of first-degree relatives12,13. The number of additional affected family members probably increases the risk for close relatives, but the magnitude of that increase is unclear.
Sporadic AD is the most common cause of dementia among elderly people and the disease is associated with a significantly higher risk of death compared to other types of dementia14. Longitudinal studies provide rates of 10–15 per thousand persons per year for all dementias and 5–8 for AD. Hence, nearly 50% of new dementia cases each year belong to the Alzheimer’s type15,16. After the age of 65, the risk of acquiring the disease approximately doubles every five years, rising from 3 to 69 per thousand persons per year15,17. In 2000, there will be 4.5 million people in the United States suffering from AD. Only 0.3 million people (7%), were between the ages of 65 and 74 years whereas 2.4 million (53%) were between the ages of 75 and 84 years, and 1.8 million (40%) were 85 years of age and older18. The charging on the health care system of the United State is estimated to be greater than $100 billion per year, including direct and indirect medical and social service costs19. By 2050, the total number of AD patients will increase by almost 3-fold, to 13.2 million and due to the rapid growth of the oldest age groups of the US population, the number of people aged 85 years and older will more than quadruple to 8.0 million18. The charging on the health care system can be imagined.
1.2 Heritable causes of Alzheimer’s disease
Autosomal dominant gene mutations are potential triggers for AD. Three genes have been identified in which mutations result in early onset familial Alzheimer’s disease APP, presenilin 1 (PS-1), and the PS-2 gene.
The APP gene maps to chromosome 21q21.1 and mutations in this gene lead to early onset disease at an age of between 43 and 62 years20,21. Mutations in the APP gene might result in altered metabolism of APP, leading to increased production of the Aβ proteins.
The PS-1 locus was identified on chromosome 14q24.3 and mutations in this gene are thought to cause up to 80% of familial Alzheimer’s disease cases, with onset between 29 to 62 years of age22. PS-1 acts in the γ-secretase complex. However, the exact function of the PS-1 protein is unknown, but it is known to be a transmembrane protein and it is homologous to SEL-12 in Caenorhabditis elegans23,24. SEL-12 is known to be involved in cell signaling during development and the PS-1 gene knockout mice reveal skeletal deformations, impaired neurogenesis, and neuronal cell death, leading to death shortly after birth25,26. Most PS-1 mutations are gain of function.
Introduction
4 The PS-2 Gene locus was identified on chromosome 1q31–42,3427. Only two mutations have been identified in the PS-2 gene leading to Alzheimer’s disease with an onset between 40 and 88 years of age21. The PS-1 and PS-2 protein share 67% homology and are proposed to have a similar function although they are unable to compensate for each other.
Mutations in aforementioned genes lead to an increased production of the 42 amino acid form of Aβ (Aβ1–42)28,29,30,31.
An additional inheritable mutation involved in the pathogenesis of AD occurs in the Apolipoprotein E (ApoE) gene. It exists in 3 allelic forms ε2, ε3 and ε4. The ε2 allele is associated with the lowest late onset Alzheimer’s disease (LOAD) risk, whereas ε4 allele increases the risk of developing LOAD 5- to 15-fold32. ApoE plays a critical role in regulating brain Aβ peptide levels in the brain. There is evidence that apoE4 enhances Aβ aggregation by increasing the ratio of Aβ1‐42 to Aβ1‐40 and reducing Aβ clearance33,34.
A chromosomal cause for developing AD is found in person with Down Syndrome (DS). Due to the extra copy of the chromosome 21 a lifelong overexpression of the APP gene leads to overproduction of Aβ peptides in the brains of DS persons who are trisomic for this chromosome. DS persons develop neuropathologic hallmarks of AD after 40 years35,36.
Nonetheless, AD remains heterogeneous and complex. The disease does not display a simple mode of inheritance and several genes are known to influence onset and progress of AD.
1.3 Neuritic plaques and Neurofibrillary tangles
The histopathological hallmarks of AD are neuritic plaques and neurofibrillary tangles (NFT), these lesions are not distinctive to AD, and are found in other neurodegenerative disorders as well.
Classic neuritic plaques are spherical structures consisting of a central core of fibrous protein known as amyloid (Aβ) that is surrounded by degenerating or dystrophic nerve ends (neurites). Two types of amyloid-related plaques are recognized in the brains of AD patients:
o diffuse plaques, which contain poorly defined amyloid but no well-circumscribed amyloid core, and
o ‘‘burnt-out’’ plaques, which consist of an isolated dense amyloid core.
As mentioned above the amyloid-β contains mainly 40 to 42 amino acid peptides which are derived from proteolytic processing of APP, a type 1 integral membrane protein.
NFT are the other main histopathologic findings in AD. The structure of the NFT was first described by Terry in 196337. 1986 the microtubule associated protein tau (referred to as tau) was determined as the major protein component of NFTs38. Tau proteins are expressed predominantly in the axons of neurons in the CNS and peripheral nervous system and it
physiological function is to bind and stabilise microtubules39,40,41. The activity of Tau as a phosphoprotein is regulated by the balance of phosphorylation and dephosphorylation through different kinases and phosphatases.Key players in this mechanism are GSK3-β as the major tau kinase and PP2A as the major tau phosphatase42,43,44,45,46,47.
In AD brain there is as much normal tau as in agematched control human brain, but, in addition, the diseased brain contains 4–8-fold of abnormally hyperphosphorylated tau48,49. In this state, tau is the major component of the paired helical filaments in NFT38,50,51. The intracellular NFTs cause disruption of normal cytoskeletal architecture with subsequent neuronal cell death52.
Neuritic plaques and neurofibrillary tangles are not distributed evenly across the brain in AD but are concentrated in vulnerable neural systems responsible for learning, memory and survival e.g. the hippocampus.
1.4 Processing of APP
Amyloid-β precursor protein (APP) is a member of a conserved family of type I membrane proteins which in mammals includes also APP like protein 1 (APLP1) and 2 (APLP2). APP and APLP2 are ubiquitous with high expression in neurons, while APLP1 is brain-specific.
APP is an important protein that may play a role in recognition of extracellular signals, cell adhesion and apoptosis. In neurons APP is required for synaptogenesis, synapse remodeling and neurite outgrowth53,54. There exist three major isoforms of 695, 751, and 770 amino acids all of which are derived from alternative splicing of a single gene product55 on chromosome 21. In neurons, APP695 is the predominantly expressed form and is subject to N- and O-glycosylation within its extracellular/luminal domain. APP751 and APP770 are expressed mainly in non-neuronal cells of the CNS, especially in glial cells. During maturation APP gets N-glycosylated in the endoplasmic reticulum and early Golgi. In N- glycosylated state APP is not cleaved by secretases56. Further trafficking within the Golgi transforms N-glycosylated APP to O-glycosylated APP and reaches the trans-Golgi network where it enters the secretory pathway57. Here two possible APP processing pathways might occur.
Introduction
6 Fig. 1-1 Illustration of APP processing by α-, β- and γ-secretases
Non-amyloidogenic pathway: cleavages of APP by α-secretases produce α-CTFs and APPsα. Further cleavage by γ-secretases produce the p3 stubs and AICD’s. Amyloidogenic pathway: processing of APP by β-secretases produce β-CTFs and APPsβ. Cleavage of β-CTFs by γ-secretases produce the Aβ1-40/42. Abbreviations: APP, Amyloid precursor protein; CTF, C-terminal fragments; AICD, an intracellular C-terminal domain
a) Non- amyloidogenic pathway
In the non-amyloidogenic pathway APP is cleaved by the α‐secretase, within the Aβ domain between Lys‐16 and Leu‐17. This is the putative non toxic way of APP processing and generates a 83‐amino‐acid C‐terminal APP fragment (C83) and destroys the Aβ sequence. In addition, a large soluble N-terminal fragment (sAPPα) is released from the cell surface58. After subsequently cleavage in the intramembrane region by the γ-secretase a p3 fragment as well as an intracellular C-terminal domain (AICD) is generated59. Additional cleavage by caspase-3 between D664 and A665 of AICD produce a 31 aa C-terminal fragment (CTF)60. Currently, three members of the ADAM-protein family (a disintegrin and metalloprotease domain) are identified as putative α-secretases. ADAM-9, ADAM-10 and ADAM-17 (also referred as TACE) are suposed to have α-secretase activity allowing to initiate the non- amyloidogenic pathway.
b) amyloidogenic pathway
Amyloidogenic processing of APP requires sequential cleavage by β‐ and γ‐secretase. First APP is cleaved by β‐secretase, generating a 99‐amino‐acid C‐terminal APP fragment (C99) and a large soluble N-terminal fragment (sAPPβ). As candidates for β-secretases BACE-1 (β-site APP-cleaving enzyme1) was identified. Cleavage by β-secretase at Asp‐1 produces the N‐terminus of Aβ peptides. In addition, BACE‐1 may also cleave within the Aβ domain at
Glu‐11, an alternative cleavage site61. The Swedish FAD double mutation promotes β- secretase cleavage at Asp‐1 and hence increases Aβ production62. Further processing of C99 by γ‐secretase leads to Aβ-peptide production. γ-secretase is an intramembranous multimeric complex63 and its cleavage activity seems to be largely nonselective, occurring in at least 3 different sites: Val636, Ala638 and Leu645 of the APP molecule64. The resulting products range in length from 38 to 43 residues but the two major species are Aβ1‐40 and Aβ1‐42. The latter is considered to be more amyloidogenic because it was shown to be more prone to aggregate65.
Notably Aβ peptides are generated only by the cleavage of APP and not by the cleavage of other APP protein family members such as APL-1(amyloid precursor like) in Caenorhabditis elegans, Appl ( β-amyloid protein precursor like) in Drosophila, APP-like protein 1 (APLP1) and APLP2 in mammals, which all lack the Aβ domain66,67,68,69,70. The Aβ sequence is the least conserved part between the human and mouse APP sequences. Mouse APP is processed poorly by β-secretase, resulting in approximately threefold lower amounts of Aβ peptide71. Therefore in the present study transgenic mice were used carrying the human APP including amino acids exchanges known as the Swedish mutation (APPsw).
1.5 Clearance of Amyloid beta (Aβ)
Clearance of Aβ peptides is achieved by two different pathways: proteolytic degradation, aggregation and receptor-mediated transport from the brain.
A number of different molecules have been implicated in the process of removal of cerebral Aβ by proteolytic degradation. Key players in this mechanism are the enzymes Insulin degrading enzyme (IDE) and Neprilysin (NEP) but additionally, recent data suggest an involvement of endothelin converting enzyme (ECE) in the process of Aβ clearance.
IDE, a 110 kDa zinc metallo-endopeptidase, hydrolyzes several regulatory peptides72, including insulin, glucagon, atrial natriuretic factor, transforming growth factor α, β-endorphin, amylin, Aβ, and the AICD. IDE is localized in the cytosol, while only a small fraction resides in the plasma membrane. Recent data support a role for IDE in Aβ degradation. Amongst others IDE knockout mice show increased endogenous levels of Aβ and AICD in the brain73,74. Chronical overexpression of IDE in APP overexpressing mice diminish the Aβ plaque burden by 50 % and reveals a 50% reduction of soluble and insoluble fraction of Aβ1-
40 as well as Aβ1-42. Furthermore, IDE polymorphismus seems to be associated with late onset AD75,76. It is remarkable that IDE is only able to degrade Aβ monomers.
The second mentioned peptidase responsible for the degradation of Aβ is NEP. It is a type II membrane protein and is also referred to as neutral endopeptidase or enkephalinase. NEP, like IDE, hydrolyzes circulating biologically active peptides including enkephalin,
Introduction
8 neuropeptide Y and others77. Intracerebral injections of a lentiviral vector expressing human NEP in a transgenic mouse model of cerebral amyloidosis resulted in a remarkable 50%
decrease of cortical amyloid deposits78. NEP is localized in the plasmamembrane and owns an extracellularly catalytic site. Therefore NEP is best mounted to be a prime candidate for Aβ degradation on extracellular sites.
Cerebral Aβ is exported across the Blood brain barrier (BBB) via a receptor-mediated transport. The efflux results via low-density lipoprotein receptor-related protein (LRP)79. A transport of Aβ via LRP requires initial binding to the LRP ligands apoE and α2 Macroglobulin (α2M). In addition it has been shown that Aβ binds directly to LRP and is transported across the BBB80,81. In this case, Aβ1-40 is cleared more effectively than the Aβ1-42 . For that reason Aβ1-42 may still require prior binding to the LRP ligand apoE and α2M to be effectively transported out of the CNS.
1.6 Secretases
The processing of APP by the different pathways (amyloidogenic and non-amyloidogenic) requires cleavage by different secretases. In the initial step, α- and β-secretase compete for APP as substrate. These two enzymes cleave at different sites and thereby determine if the amyloidogenic pathway or non-amyloidogenic pathway occurs.
α-secretase
Three members of a disintegrin and metalloprotease domain (ADAM) family have been identified to possess α‐secretase activity ADAM-9, ADAM10 and ADAM 17 (also referred to as TACE)58. The exact sub‐cellular localization of α‐secretase remains unclear, however cleavage sites have been proposed to be the trans‐Golgi network (TGN) and the cell surface82,83. In the CNS ADAM-10 and ADAM-17 are most prominent.
β-secretase
BACE1 (β-site APP-cleaving enzyme1) is essential for initiating Aβ generation and cleaves at the APP Asp-1 residue to form the Aβ N-terminus. BACE1 is an aspartic, type 1 membrane protease with a single transmembrane domain near its C-terminus and a luminal active site that provides an optimal β-secretase site for APP cleavage61,84,85,86. Its maximal activity occurs at pH 4.5 and is thus localized within acidic compartments of the secretory pathway61. BACE1 is abundant in human cells and its mRNA levels are highest in the brain. Its maximal activity occurs in neurons and to less extend in astrocytes87. Like other pepsin family members, BACE1 has two active site motifs and mutation of either causes inactivity84,88. Aside from BACE1 there is a homologous molecule BACE2. BACE2 mRNA is expressed at
low levels in most human peripheral tissues and at very low or undetectable levels in human brain61.
γ-secretase
γ‐secretase complex is not a single enzyme but requires the interaction of 4 subunits:
presenilin (PS), anterior pharynx-defective- 1 (APH-1) , nicastrin, and presenilin enhancer-2 (PEN-2) which are mostly present in a 1:1:1:1 stoichiometry89.
PS is a polytopic membrane protein consisting of nine trans-membrane-domains (TMD) and pass through an endoproteolytic cleavage that ends in a ~30-kDa N-terminal and ~20-kDa C terminal fragment90. This cleavage occurs within the large cytoplasmic loop between TMD6 and TMD7. PS harbors the catalytical active site which is critically required for the aspartyl protease activity of γ-secretase. Apart from the catalytic subunit PS, three other integral membrane proteins, NCT, APH-1, and PEN-2, are essential γ-secretase complex subunits91,92. NCT is an ~100-kDa type I membrane glycoprotein with a large ectodomain, a short cytoplasmic domain and recognizes γ-Secretase substrates93,94. The other two components, the ~20-kDa seven- TMD protein APH-1 and the smallest subunit, the ~10-kDa hairpin PEN-2 protein, are highly hydrophobic subunits91,92. PEN-2 is required for the stabilization of the PS fragments in the complex, whereas the function of APH-1 is currently unclear95,96.
Presenilin mutations are genetically linked to FAD and increase the production of the aggregation-prone and neurotoxic Aβ1-42.
1.7 IGF-1 signaling cascade
1.7.1 Insulin and Insulin-like-growth factor-1 signaling in Alzheimer’s disease
Recent data have implicated insulin and insulin-like growth factor-1 (IGF-1) signaling (IIS) as being involved in the pathogenesis of AD. Current reports suggest that type 2 diabetes mellitus (T2DM) is a risk factor for AD, however, the underlying cellular mechanisms for this association are still unknown97,98,99,100
. It is conceivable that vascular complications of T2DM result in neurodegeneration101. Alternatively, neuronal insulin/IGF-1 resistance might represent the unifying link between T2DM and AD, characterizing AD as a "brain type diabetes"101,102,103,104. In agreement with this hypothesis is the observation that insulin receptor (IR) and insulin-like growth factor-1 receptor (IGF-1R) signaling is markedly disturbed in the central nervous system (CNS) of AD patients105,106,107. Post mortem investigations of brains from patients with AD revealed a markedly down regulated expression of IR, IGF-1R, and insulin receptor substrate (IRS) proteins102,108 and these
Introduction
10 changes progress with severity of neurodegeneration. One common feature in neurons from AD patients is a downregulation of IRS-2 and IGF-1R102,107. Other groups reported similar results in AD brains109. These findings raise the important question whether changes in IR/IGF-1R signaling (IIS) are cause, consequence, or maybe even compensatory counterregulation of neurodegeneration.
1.7.2 IGF-1 and IGF-1R
IGF-1 is a small molecule of 7500 Da that is found in most tissues. Structurally it is a member of a superfamily of related insulin-like hormones that include IGF-1, IGF-2, insulin and relaxin in vertebrates and bombyxin, locust insulin-related peptide, and molluscan insulin-like peptide in invertebrates109,110,111,112,113. A close relative of IGF-1 is insulin with sharing approximately 50% of amino acid homology114. IGF-1 is a major growth factor and is involved in proliferation, differentiation, malignant transformation as well as in protection from apotosis.
Insulin is predominantly responsible for glucose uptake, food intake and cellular metabolism115,116,117. The IGF peptides are single chain polypeptides and derive from a precursor hormone118,. The final peptide hormone results from processing of the prohormone consisting of A, B, C, and D domains119. The gene encoding IGF-1 is highly conserved among mammals, birds and amphibians118,120,121,122,123,124 and its expression is influenced by hormonal (e.g. growth hormone), nutritional and tissue-specific developmental factors125,126,127
. The bio-availability of IGFs is regulated by the IGF- binding proteins (IGFBP), a family of six members (IGFBP1 – 6) with a high binding affinity for both IGFs. Thus, they regulate and maintain the biological activity pool of circulating IGF128. The IGFBP in turn are regulated by IGFBP proteases which cleave the binding proteins, generating fragments with reduced or no binding affinity for the IGFs129,130.
The IGF-1 receptor is, like the IR, a member of the ligand-activated receptor tyrosine kinases.
Its gene is mapped on chromosome 15 q25-26 consisting of 21 exons spanning over 100kb of genomic DNA. IGF-1 and IR are heterotetrameric trans‐membrane glycoproteins consisting of two α‐ and β‐subunits that are covalently linked through disulfide bonds. The α‐ subunits reside extracellularly with the ligand-binding site and a transmembrane and the cytoplasmatic parts of the receptor are found in the β‐subunits131. Beside the transmembrane domain is the catalytic subunit with the juxtramembran tyrosine kinase domain located, which link the receptor via the Insulin-receptor-substrates 1-4 (IRS) to the two main downstream signaling cascade, the mitogen activated protein kinase (MAPK) and the phosphatidylinositol 3-kinase (PI3K) cascades132,133,134. IGFs and Insulin bind with low affinity to the non-cognate receptor but due to the homology of the IGF-1R and the IR they are able to form hybrid receptors (HR) consisting of IR isoforms and IGF-1R135. The HR bind IGF1 with high affinity
and insulin with lower affinity, and the relative affinities are dependent on the insulin-receptor isoform that is involved (IRa, IRb)136.Their physiological role is unknown but hybrid receptors may be involved in switching signaling from insulin to IGF-1 in certain situation.
1.7.3 IGF-1R/IR signaling
The IGF-1R/IR signaling starts with ligand binding to the corresponding α‐subunit of the receptor. This leads to a conformational change and activation of the intrinsic receptor tyrosine kinase followed by intracellular autophosphorylation137. For this purpose the ATP- binding site at Lys1003 and the tyrosine kinase domain are required for all functions of the IGF-IR. Trans-phosphorylation between the β-subunits involves Tyr1131, 1135 and Tyr1136 in the kinase domain and leads to full activation of kinase activity. Phospho-tyrosine residues in specific motifs are docking sites for Src homology 2 (SH2) domain-containing signaling proteins. This phosphotyrosin recognition motif containing proteins,like the IRS-proteins and Shc-proteins, function after being phosphorylated by the receptor tyrosine kinase as adaptor molecules linking the receptor to the PI3K- and MAPK-pathway138. IRS, a protein family has at least 4 members (IRS‐1 to IRS‐4) which are homologous in structure and function but show distinct tissue distribution. IRS‐1 and IRS‐2 are widely expressed and mediate insulin and IGF-1 action in most tissues including the brain. IRS‐3 is largely limited to rodent adipocytes and IRS‐4 is primarily and discretely expressed in the brain (hypothalamus) as well as in kidney and thymus139,140.
Introduction
12 P
P P
P P P
Grb2 SOS Ras
Raf
p85
p110 PI3 Kinase pathway PI
3,4P
PDK Akt/PKB IRS-Proteins
P P P P P P
MAP Kinase pathway
Gene-
Expression Protein- synthesis
Neuronal survival Cell
growth
Insulin receptor
GSK-3 ββββ FOXO-1
PTEN
Erk-1/2
PI
3,4,5P
P P P
P P P
IGF-1 receptor
P
P P P P P P
P P P P P P
Grb2 SOS Ras
Raf
p85
p110 PI3 Kinase pathway PI
3,4P
PDK Akt/PKB IRS-Proteins
P P P P P P
MAP Kinase pathway
Gene-
Expression Protein- synthesis
Neuronal survival Cell
growth
Insulin receptor
GSK-3 ββββ FOXO-1
PTEN
Erk-1/2
PI
3,4,5P
P P P P P P
P P P P P P
IGF-1 receptor
P
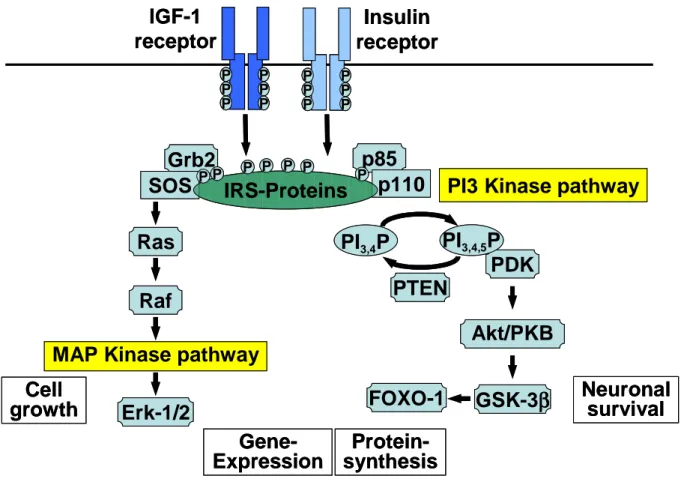
Fig. 1-2 Illustration of IGF-1R/IR signaling cascade
Binding of insulin/IGF‐1 ligand to their receptors induce trans-autophosphorylation of the β‐subunit and activation of RTK. Activtion leads to recruitment and subsequent phosphorylation of IRS proteins. Phosphorylation of IRS allow for binding of SH-2 domain containing proteins that ends in the activation of MAP‐ or PI3‐kinase signaling pathways. Abbreviations: IGF‐1, insulin‐like growth factor 1; IRS, insulin receptor substrate; p85/p110, regulatory/catalytic subunit of PI3‐kinase; PI3,4P/PI3,4,5P,phosphatidylinositol‐bi/tri‐phosphate; PDK, phosphoinositide‐dependent protein kinase; PKB, protein kinase b; GSK3β ,glycogen synthase kinase3β; Grb2, growth factor receptor binding protein2; SOS, son‐of‐sevenless; Ras, G‐protein; c‐Raf, proto‐oncogene; ERK, extracellular signal‐regulated kinase.
The PI3-kinase-pathway: Subsequently phosphorylation of tyrosine residues of IRSs evoke binding of p85 the regulatory subunit of PI3K resulting in the activation of the catalytically active PI3‐kinase subunit (p110). This leads to the production of phosphatidylinositol‐3,4,5
‐triphosphate (PIP3) from PIP2 at the plasma membrane, the initial step for activation of several downstream targets, such as the phosphoinositide‐dependent protein kinase(PDK)1, AKT (also known as protein kinase B; PKB). AKT phosphorylates glycogen synthase kinase (GSK)3α/β (at Ser21/9), which is thereby inhibited, and the forkhead transcription factor FoxO1141,142. This step triggers nuclear exclusion of FoxO1 and reduces the expression of its target genes which are involved in oxidative stress protection, apoptosis, metabolism and longevity143,144. Notably is that AKT is substrate of mTOR (mammalian target of rapamycin) and therefore mediate signals without activation by IIS. TOR is a Ser/Thr kinase highly conserved from yeast to mammals existing intracellularly in two distinct complexes145. When bound to raptor (regulatory-associated protein of mTOR) and GbL (G protein b subunit-like) mTOR regulates protein synthesis, cell growth, proliferation and autophagy in a nutrient- and
energy responsive manner. As part of a complex with rictor (rapamycin insensitive companion of mTOR) and GbL, mTOR phosphorylates AKT/PKB and regulates different proteins downstream of AKT. Studies in yeast, C. elegans, and Drosophila revealed the involvement of TOR in the regulation of life span. In a large-scale screen of single-gene- deletion strains of yeast, mutations in the TOR pathway were associated with an increased life span146,147. Thus not only IIS signaling might be responsible for activation of the downstream target of AKT and whose above mentioned impact.
MAP-kinase pathway: The second main pathway that is activated after phosphorylation of the receptors is the MAP-kinase pathway. Phosphorylation of Shc at Tyr950 on IRS proteins leads to the recruitment of Grb2 that binds son‐of‐sevenless (SOS) which in turn performs nucleotide exchange on Ras148. By inducing the exchange of guanosine‐diphosphate (GDP) with guanosine triphosphate (GTP), Ras is converted into its active conformation and subsequently recruits c‐Raf to the membrane. The increased c‐Raf activity is transduced through mitogen‐activated protein kinase kinase (MEK) in order to activate extracellular signal‐regulated kinase (ERK). ERK regulates transcription factors and thereby influences cell metabolism and proliferation149,150.
1.8 Mouse Models
In the presented thesis the influence of IGF-1R signaling on the pathogenesis of AD based on a neuronal specific knockout of the IGF-1R (nIGF-1-/-) in a transgenic model of AD (Tg2576) has been analyzed. Therefore, the cre/loxP system under the control of the neuron- specific synapsin I promoter has been used.
1.8.1 Conditional IGF-1R knock out (The cre/loxP system)
Originally, gene targeting implicated insertion of an exogenous DNA fragment into an exon critical for target gene function in mouse embryonic stem (ES) cells. The resulting knockout in genes occurs on the basis of homologous recombination151. However, mutant gene dysfunction is affected throughout the whole body, often yielding in undesired effects. In contrast to this technique, the Cre/loxP system is able to mediate sitespecific DNA recombination. Originally described in bacteriophage P1 two components are involved, first a 34-bp DNA sequence containing two 13-bp inverted repeats and an asymmetric 8-bp spacer region referred as loxP (‘‘locus of X-over in P1’’) that targets recombination and second a 343 amino acid monomeric protein called Cre recombinase that mediates the recombination event152. Any DNA sequence flanked by two loxP sites is either be excised (loxP sites in
Introduction
14 same orientation) or inverted (loxP sites in opposite orientation) in the presence of Cre recombinase153. The advantages of this system are: i) loxP target sites are small and easily synthesized, ii) no apparent external energy is required154,155 , iii) Cre is a very stable protein and any promoter can drive Cre recombinase expression in the tissue or even celltype of interest. Initiation of gene targeting in vivo, using the Cre/loxP system, requires two lines of mice. One mouse line carries the protein of interest flanked by loxP sites (‘‘floxed’’ gene).
These mice should be phenotypically normal because the loxP sites are inserted into introns where they theoretically do not affect gene function. The other mouse line expresses Cre recombinase under the control of a tissue on cell-specific promoters. Cross-breeding of the two mouse lines should result in Cre-mediated gene disruption only in those cells in which the promoter is active.
1.8.2 Cre recombinase expression under the control of the synapsin-1 promotor Synapsin I (also known as brain protein 4.1), is a neuronal phosphoprotein associated with the membranes of small synaptic vesicles. The synapsin family is composed of synapsin I and synapsin II, which are products of alternative splicing of transcripts from two distinct genes156. Two main characteristics distinguish synapsins from most other synaptic vesicle- associated proteins. Firstly they are rather peripheral than integral membrane proteins and secondly they are specific for the nervous system, as there are apparently no homologous proteins in non-neuronal tissues. Injection of synapsin I into Xenopus blastomeres accelerates the structural and functional development of neuromuscular synapses157,158. In embryonic hippocampal neurons of synapsin I-deficient mice outgrowth of predendritic neurites and severely retarded axons are observed. Furthermore, synapse formation was significantly delayed indicating that synapsin I plays a role in regulation of axono- and synaptogenesis159. Privious use of synapsin-1promoter for Cre recombinase expression determines its activity in cortical and spinal cord neurons but predominantly in the hippocampus160. For that reason synapsin I promoter is a good candidate for controlling the cre recombinase to get neuronal specific cre recombinase expression.
1.8.3 The Alzheimer’s disease model Tg2576
As mentioned above several mutations affecting APP are capable of inducing FAD. APP695SW mice express transgenic human APP with the two-point mutation (Lys670Asn, Met671Leu).
This mutation was originally described in a Swedish family suffering from FAD and is therefore called “Swedish” mutation. These mice show age-dependent memory impairments, generally starting in age of 40 weeks of age and several histopathological features, including amyloid plaques, neuritic dystrophy, astrogliosis, reactive microgliosis and to lesser extend abnormal tau phosphorylation161,162,163. The 695-amino acid isoform the mutant form of
human amyloid precursor protein (APP) was inserted into mice using a hamster prion protein cosmid vector, in which APPsw replaced the prion protein open reading frame. Expression of APP is driven by the hamster prion protein gene promoter. Depending on the genetic background, APP-SW (Tg2576) transgenic mice die early. Since nearly all Tg2576 on a pure C57BL/6 background die within the first months of age it is impossible to investigate amyloid accumulation or IGF-1R signaling in this pure background164. Therefore, Taconic APP-SW colony is maintained in a B6/SJL hybrid background. Offsprings of these mice were used in this thesis to investigate APPsw induced lethality, amyloid accumulation as well as IGF-1R signaling during aging in different brain regions165.
1.9 Aims of this thesis
Recent data show a disturbed Insulin/IGF signaling in patients suffering on AD. To directly address the importance of IGF-1R signaling in the pathogenesis of AD, neuron-specific IGF- 1R deleted mice (nIGF-1-/-) were crossed with mice expressing the Swedish mutation of human APP695 harbouring the double mutation Lys670 Asn, Met671 Leu which was found in a Swedish family with early onset AD (APPsw, Tg2576 mice). Survivals as well as metabolic and somatic factors of the offspring were measured during an observation period of 60 weeks. Biochemical and histophathological analysis of these mice were performed at two different time points to investigate the influence of the neuronal IGF-1R signaling in the pathogenesis of AD.
2 Material and methods
2.1 Chemicals
Acetic acid Merck, Darmstadt, Germany
Acrylamide / Bis-acrylamide 30% Rotiphorese® Gel 30 (37.5/1)
Carl Roth GmbH + Co. KG, Karlsruhe, Germany
Agarose Invitrogen Corporation, Carlsbad CA, USA
Aprotinin Sigma‐Aldrich Chemie GmbH, Steinheim, Germany
APS Ammonium‐persulfate
AppliChem GmbH, Darmstadt, Germany
AraC Cytosine arabinoside, Sigma‐Aldrich Chemie GmbH, Steinheim, Germany
Avertin Sigma‐Aldrich Chemie GmbH, Steinheim, Germany Benzamidine Sigma‐Aldrich Chemie GmbH, Steinheim, Germany β‐mercaptoethanol Sigma‐Aldrich Chemie GmbH, Steinheim, Germany Bradford reagent Bio‐Rad Laboratories GmbH; Germany
Bromophenol blue AppliChem GmbH, Darmstadt, Germany BSA > 96 % Bovine serum albumin
Sigma‐Aldrich Chemie GmbH, Steinheim, Germany Desoxy-Ribonucleotid-Triphosphate Fermentas GmbH, St. Leon-Rot, Germany
(dNTPs)
DMSO Dimethyl sulfoxide
Sigma‐Aldrich Chemie GmbH, Steinheim, Germany
DNase Roche, Mannheim, Germany
DTT Dithiothreitol
AppliChem GmbH, Darmstadt, Germany
EDTA Ethylenediaminetetraacetic acid
AppliChem GmbH, Darmstadt, Germany
Ethanol AppliChem GmbH, Darmstadt, Germany
Ethidium bromide Sigma‐Aldrich Chemie GmbH, Steinheim, Germany
Glycerol Glycerin, AppliChem GmbH, Darmstadt, Germany
Glycine AppliChem GmbH, Darmstadt, Germany
HEPES Sigma‐Aldrich Chemie GmbH, Steinheim, Germany
Material and methods
18
IGF Sigma‐Aldrich Chemie GmbH, Steinheim, Germany
Isopropanol AppliChem GmbH, Darmstadt, Germany Kaiser’s glycerol gelatine Merck, Darmstadt, Germany
KCl potassium chloride, Sigma‐Aldrich Chemie GmbH,
Steinheim, Germany
Methanol 99% Carl Roth GmbH + Co. KG, Karlsruhe, Germany Magnesium chloride Merck, Darmstadt, Germany
NP‐40 Polyglycol ether (Nonidet® P40 Substitute) FLUKA Chemika/Biochemika Chemie AG, Buchs, Switzerland PMSF Phenylmethylsulphonylfluoride Sigma‐Aldrich Chemie
GmbH, Steinheim, Germany Potassium hexacyanoferrat II Merck, Darmstadt, Germany Potassium hexacyanoferrat III Merck, Darmstadt, Germany
Proteinase K Roche, Mannheim, Germany
SDS Sodium dodecyl sulfate
AppliChem GmbH, Darmstadt, Germany
Sodium bicarbonate Carl Roth GmbH + Co. KG, Karlsruhe, Germany Sodium chloride Carl Roth GmbH + Co. KG, Karlsruhe, Germany Sodium orthovanadate Sigma‐Aldrich Chemie GmbH, Steinheim, Germany
TEMED N,N,N',N'‐Tetramethylethylenediamine
Sigma‐Aldrich Chemie GmbH, Steinheim, Germany Thioflavin S Sigma‐Aldrich Chemie GmbH, Steinheim, Germany
Tris AppliChem GmbH, Darmstadt, Germany
TritonX-100 AppliChem GmbH, Darmstadt, Germany
Trypsin Roche, Mannheim, Germany
TWEEN 20® Polyoxyethylene (20) sorbitan monolaurate, Caesar and Lorentz GmbH, Bonn, Germany
X-gal PEQLAB Biotechnologie GmbH, Erlangen, Germany
Xylol AppliChem GmbH, Darmstadt, Germany
2.1.1 Buffer and solution
BME Basal medium eagle, Invitrogen Corporation, Carlsbad CA, USA
Cell lysis buffer 150 mM NaCl
50 mM Tris‐HCl (pH 7.4) 5 mM EDTA
1 % Nonidet® P40 Substitute Organ lysis buffer 50 mM HEPES (pH 7.4)
50 mM NaCl 1 % Triton X-100 10 mM EDTA 0.1 M NaF
17 µg/ml Aprotinine 2 mM Benzanidine 0.1 % SDS
1 mM Phenylmethylsulfonyl fluoride (PMSF) 10 mM Na3VO4
HBSS Hanks’ balanced salt solution, Invitrogen Corporation, Carlsbad CA, USA
SDS‐PAGE running buffer 194 mM Glycine 25 mM Tris 0.1 % SDS
4 x SDS sample buffer 250 mM Tris‐HCl (pH 6.8) 200 mM DTT
40 % Glycerol 8 % SDS
0.01 % Bromophenol blue Stripping solution 62.5 mM Tris‐HCL pH 6.8
100 mM β‐mercaptoethanol 2% SDS
TBS buffer (pH 7.6) 137 mM NaCl 20 mM Tris TBS‐T buffer (pH 7.6) 137 mM NaCl
20 mM Tris 0.1 % Tween 20®
Western Blot antibody solution 137 mM NaCl 20 mM Tris
5 % Western Blocking Reagent (Roche)
Western Blot blocking solution 137 mM NaCl 20 mM Tris
10 % Western Blocking Reagent (Roche)
Material and methods
20 Western Blot transfer buffer 194 mM Glycin
25 mM Tris
20 % Methanol (99%) 0.05 % SDS
– ECL; Amersham ECLTM Western Blotting Detection Reagents, GE Healthcare UK Ltd;
England
– Fetal bovine serum (FBS); Invitrogen GmbH; Germany
– Pen/Strep; Penicillin Streptomycin (P/S); 10,000 Units/ml Penicillin, 10,000 µg/ml Streptomycin; Invitrogen GmbH; Germany
– Phosphate buffered saline 10 fold (pH 7.2); Invitrogen GmbH; Germany
– Protein Standard Ladder; Precision Plus Protein Kaleidoscope Standards; Bio‐Rad Laboratories GmbH; Germany
– Trypsin; Roche, Mannheim, Germany
– Western Blocking Reagent; Roche Diagnostics GmbH; Germany
2.1.2 Kits
– α‐Secretase Activity Kit R&D Systems, Inc., USA; Catalog # FP001 – β‐Secretase Activity Kit R&D Systems, Inc., USA; Catalog # FP002
ELISA Aβ1-40 Invitrogen Corporation, Carlsbad CA, USA Cat#
KHB3481
ELISA Aβ1-42 Invitrogen Corporation, Carlsbad CA, USA Cat#
KHB3441
2.1.3 Primary Antibodies
– Actin Antibody; Monoclonal mouse antibody raised against an epitope conserved in human actin; MP Biomedicals, USA; Item # 69100; Western Blotting Dilution 1:5000
– ADAM 10 Antibody; Polyclonal rabbit antibody raised against human ADAM10 (H‐300);
Santa Cruz Biotechnology, Inc., USA; Item # sc‐25578; Western Blotting Dilution 1:1000 – ADAM 17/TACE Antibody; Polyclonal rabbit antibody raised against human ADAM17/
TACE; Assay Designs, Inc., USA; Item # 905249; Western Blotting Dilution 1:1000
– AKT Antibody; Polyclonal rabbit antibody raised against endogenous levels of total AKT1, AKT2 and AKT3 proteins; Cell Signaling Technology, Inc., USA; Item # 9272; Western Blotting Dilution 1:1000.
- ApoE Antibody; Polyclonal goat antibody raised against a peptide mapping the C-terminus of apoE of mouse origin; Santa Cruz Biotechnology, Inc., USA; Item # sc‐6384; Western Blotting Dilution 1:1000
– APP C‐Term (Amyloid Precursor Protein, C‐Term) Antibody; Synthetic peptide developed in rabbit raised against the C‐terminal of human APP 695 (amino acids 676‐695);
Sigma‐Aldrich, USA; Item # A8717; Western Blotting Dilution 1:1000
- α2M Antibody Polyclonal goat antibody raised against epitope mapping near the N-terminus of α-2M of human origin Santa Cruz Biotechnology, Inc., USA; Item # sc‐8513; Western Blotting Dilution 1:1000
– BACE‐1 (Beta Site APP Cleaving Enzyme 1) Antibody; Polyclonal rabbit antibody raised against amino acids 458 to 501 of human BACE; Chemicon (Millipore), USA; Item # AB 5832;
Western Blotting Dilution 1:1000
– Beta Amyloid Antibody; Polyclonal rabbit antibody raised against several isoforms of β‐amyloid peptide (Aβ), such as Aβ1‐40, Aβ1‐42 etc, regardless of phosphorylation state;
Cell Signaling Technology, Inc., USA; Item # 2454; Western Blotting Dilution 1:1000
– Erk Antibody; Polyclonal rabbit antibody raised against endogenous levels of total p44/42 MAP kinase (Erk1/Erk2) protein; Cell Signaling Technology, Inc., USA; Item # 9102; Western Blotting Dilution 1:1000
- Foxo1 Antibody; Polyclonal rabbit antibody raised against epitope corresponding to amino acids 471-598 of FKHR of human origin Santa Cruz Biotechnology, Inc., USA; Item # sc‐11350; Western Blotting Dilution 1:1000
– GSK‐3‐β Antibody; Monoclonal rabbit antibody raised against endogenous levels of total GSK‐3β protein; Cell Signaling Technology, Inc., USA; Item # 9315; Western Blotting Dilution 1:1000
– Holo APP Antibody; Polyclonal rabbit antibody raised against endogenous levels of several isoforms of both mature and immature amyloid β (A4) precursor protein, including APP695, APP770 and APP751; Cell Signaling Technology, Inc., USA; Item # 2452; Western Blotting Dilution 1:1000
- IDE Antibody; Polyclonal rabbit; Millipore Corporation 290 Concord Road, Billerica, MA 01821, USA; Item # AB9210; Western Blotting Dilution 1:1000
– IGF‐1 Receptor β Antibody; Polyclonal rabbit antibody raised against endogenous levels of IGF‐IR β. Does not cross‐react with insulin receptor; Cell Signaling Technology, Inc., USA;
Item # 3027; Western Blotting Dilution 1:1000
– IR‐β Antibody; Polyclonal rabbit antibody raised against a peptide mapping at the Cterminus of insulin Rβ (C19) of human origin; Santa Cruz Biotechnology, Inc., USA; Item # sc‐711; Western Blotting Dilution 1:1000
– IRS‐1 Antibody; Monoclonal rabbit antibody raised against C‐terminal 14 amino acid peptide ([C]YASINFQKQPEDRQ) of rat liver IRS‐1. Rat, mouse and human crossreactivity;
Upstate Cell Signaling Solutions, USA; Catalog # 06‐248; Western Blotting Dilution 1:1000 – IRS‐2 Antibody; Polyclonal rabbit antibody raised against endogenous levels of total IRS‐2 protein; Cell Signaling Technology, Inc., USA; Item # 4502; Western Blotting Dilution 1:1000
Material and methods
22 - Nepriliysin Antibody; Polyclonal rabbit; Millipore Corporation 290 Concord Road, Billerica, MA 01821, USA; Item # AB5458; Western Blotting Dilution 1:1000
– Phospho‐AKT Antibody; Polyclonal rabbit antibody raised against endogenous levels of AKT1 only when phosphorylated at Ser473. Also recognizes AKT2 and AKT3 when phosphorylated at the corresponding residues; Cell Signaling Technology, Inc., USA; Item # 9271; Western Blotting Dilution 1:1000
– Phospho‐p44/42 MAP Kinase (Thr202/Tyr204) Antibody; Polyclonal rabbit antibody raised against endogenous levels of p44 and p42 MAP Kinase (Erk1 and Erk2) when phosphorylated either individually or dually at Thr202 and Tyr204 of Erk1 (Thr185 and Tyr187 of Erk2); Cell Signaling Technology, Inc., USA; Item # 9101; Western Blotting Dilution 1:1000
– Phospho‐GSK‐3β (Ser9) Antibody; Polyclonal rabbit antibody raised against endogenous levels of GSK‐3β only when phosphorylated at serine 9; Cell Signaling Technology, Inc., USA; Item # 9336; Western Blotting Dilution 1:1000
– Phospho‐GSK‐3α/β (Ser21)/(Ser9) Antibody; Polyclonal rabbit antibody raised against endogenous levels of GSK‐3α/β only when phosphorylated at serine 21 or 9; Cell Signaling Technology, Inc., USA; Item # 9327; Western Blotting Dilution 1:1000
- Phospho-Foxo1 (Ser 256) Antibody Polyclonal rabbit Antibody detects endogenous levels of Fox01 only when phosphorylated at serine 256 Cell Signaling Technology, Inc., USA; Item
# 9336; Western Blotting Dilution 1:1000
– Presenelin 1 (C20) Antibody; Polyclonal goat antibody raised against a peptide mapping at the C‐terminus of Presenilin 1 of human origin; Santa Cruz Biotechnology, Inc., USA; Item # sc‐1244; Western Blotting Dilution 1:1000
- PTEN Polyclonal Rabbit mAb detects endogenous levels of total PTEN protein; Cell Signaling Technology, Inc., USA; Item # 138G6; Western Blotting Dilution 1:1000
2.1.4 Secondary Antibodies
– Anti Goat IgG (whole molecule), peroxidase conjugated; Affinity isolated antigen specific antibody obtained from rabbit anti‐goat antiserum by immunospecific purification;
Sigma‐Aldrich, USA; Item # A5420; Western Blotting Dilution 1:1000
– Anti Mouse IgG (Fab specific), peroxidase conjugated; Developed in goat using purified mouse IgG Fab fragment as immunogen, the antibody is isolated from goat anti‐mouse IgG antiserum by immunospecific purification; Sigma‐Aldrich, USA; Item # A9917; Western Blotting Dilution 1:15000
– Anti Rabbit IgG, peroxidase conjugated; Developed in goat using purified rabbit IgG as immunogen, the antibody is isolated from goat anti‐rabbit IgG antiserum by immunospecific purification; Sigma‐Aldrich, USA; Item # A6154; Western Blotting Dilution 1:1000
2.2 Materials
Blotting chamber Trans‐Blot® Semi‐Dry Transfer Cell Bio‐Rad Laboratories, USA
Blotting membrane Immun‐BlotTM PVDF Membrane for Protein Blotting Bio‐Rad Laboratories, USA
Blotting paper Whatman® Gel Blotting Paper Schleicher & Schuell, Germany
Cover‐slips Cover glasses 24 x 50 mm VWR International GmbH, Germany 6-well culture dishes poly-L-lysine coated Nunc – Thermo Fisher Scientific, Denmark iCycler Thermocycler
Bio‐Rad Laboratories, USA Gewebe-Homogenisator
VWR International GmbH, Germany
Microplate reader Mithras LB 940 multimode microplate reader Berthold Technologies GmbH & Co. KG, Germany
Microscope Fluorescence Microscope Eclipse E800 Nikon Instech Co., Ltd. Kanagawa, Japan
Microscope slides Microscope slides 76x26 mm Menzel GmbH &Co KG, Braunschweig, Germany
Minigel‐Twin Gel Electrophoresis Apparatus, Minigel‐Twin Biometra GmbH, Germany
NanoDrop NanoDropTM Spectrophotometer ND 1000 ThermoFisher Scientific, USA
NMR Analyzer minispec mq7.5 Burker Optik, Ettlingen, Germany
Photo‐paper Amersham HyperfilmTM ECL GE Healthcare UK Ltd, England;
Powerpac Biometra Standard Power Pack P25 Biometra GmbH, Germany
Thermomixer
Eppendorf, Hamburg, Germany