• Keine Ergebnisse gefunden

Curie Point Pyrolysis Gas Chromatography

N/A
N/A
Protected

Academic year: 2021

Aktie "Curie Point Pyrolysis Gas Chromatography"

Copied!
8
0
0

Wird geladen.... (Jetzt Volltext ansehen)

Volltext

(1)

Research Collection

Journal Article

Curie Point Pyrolysis Gas Chromatography

Author(s):

Bühler, Ch.; Simon, W.

Publication Date:

1970

Permanent Link:

https://doi.org/10.3929/ethz-b-000422789

Originally published in:

Journal of Chromatographic Science 8(6), http://doi.org/10.1093/chromsci/8.6.323

Rights / License:

In Copyright - Non-Commercial Use Permitted

This page was generated automatically upon download from the ETH Zurich Research Collection. For more information please consult the Terms of use.

ETH Library

(2)

phase.

The results of these preliminary experiments fur- nish useful guidance for the development of this method. In order to shorten the time required for the separation at a high efficiency, faster mixing and therefore higher gyration speed (á is necessary. Once is determined, the optimal condition for both phase volume ratio and interfacial area can be satisfied by angle a for a given column. Thus, the major require- ments for the design of the apparatus will be finely adjustable radius of gyration, well-balanced system, and uniform speed of gyration to minimize carry-over of the stationary phase. Though high speeds of gyra- tion should be applied, the resultant centrifugal force is as small as several g values by selecting the proper radius r for the optimal angle

When the above requirements are fulfilled, the method will greatly extend the capability of gyration L.CCC. Because of the evenly distributed gyration effect and its low column pressure, the applicable col- umn length is almost limitless. The symmetrical cir-

cular stirring of the liquids enables a high partition efficiency of a few mm in HETP. The analytical ap- plication is possible with a fine column by the use of the centrifugal force to prevent plug flow, and the pre- parative scale-up is easily achieved on a wider column without loss of efficiency. With combination of a high flow rate and a fast gyration speed, time requirement for separation may be reduced to the order of 1 second per transfer corresponding to the conventional liquid extraction techniques.

Acknowledgments

We are indebted to Mr. H. Chapman for engineer- ing works and to Miss June Friedlander for prepara- tion of manuscript. n

Manuscript received March 20, 1970

Presented at the Sixth International Symposium on Advances in Chromatography held in Miami Beach, Florida, June 2-5, 1970.

Curie Point Pyrolysis Gas Chromatography

by Ch. Wilder and W. Simon, Swiss Federal Institute of Technology, Laboratory for Organic Chemistry, Zurich, Switzerland

Abstract

In Curie Point pyrolysis gas chromatography a ferromag- netic conductor in contact with the sample is heated inside a low volume glass capillary which is inserted into an rf coil with the carrier gas flowing through the capillary. The in- trinsic properties of the conductor permit a self-control of the temperature to the Curie Point. The optimum wire diameter for a rapid warm-up is a function of the rf frequency. In order to have a fast temperature drop after cutting the rf field, small wire diameters are preferable. For such conduc- tors relatively high frequencies are inherently necessary for a fast stabilization to the Curie Point. So far no differences in the self-controlled end-temperatures have been detected for wires of different origin.

In pyrolysis gas chromatography, the samples to be studied are thermally fragmented in a stream of a carrier gas and the reaction products are passed di- rectly into a gas chromatographic column where they are separated. There are two extreme possibilities for the application of this technique (1) :

a) The pyrolysis gas chromatogram is simply used

as a "fingerprint" of the starting material.

b) Correlations between the structure of the frag- ments and the structure of the starting material are worked out and used for structural elucidation, identifi- cation and quantitative analysis.

There is by now general agreement that adequate long term and inter-laboratory reproducibility in ther- mal fragmentation can only be achieved by using a highly reproducible temperature-time profile for the fragmentation process (1-5). For nonvolatile or slightly volatile compounds the application of a square-wave temperature-time profile to the highly diluted sample

1. Simon, W., VI. Symposium ober Gas-Chromato- graphie, Berlin, May 14-18, 1968.

2. Levy, R. L., and Fanter, D. L., Anal. Chem. 41, 1465 (1969).

3. Levy, R. L., J. Gas Chromatog. 5, 107 (1967).

4. Levy, R. L., Chairman of a panel discussion in "Gas Chromatography 1968," C. L. A. Harbourn, ed., Insti- tute of Petroleum, London, 1969.

5. Farré-Rius, F., and Guiochon, G., Anal. Chem. 40

1

998 (1968).

JOURNAL OF CHROMATOGRAPHIC SCIENCE • VOL 8 JUNE 1970 • 323

(3)

y .500 K Hz

yr100 KHz

[cal cm-2 sec- 1 N

IRON 0.1 mm

H •1170 Oe ,u r r 18

y S MHz

r 2 MHz

= 1 MHz 10,000-

7,500 -

5,000-

2,500-

Figure 1. Temperature

Tc [•C] 0

TEMPERATURE

dependence of the power consumption of iron conductors in a high frequency as a function of the oscillator frequency.

Tc [•C]

TEMPERATURE

induction field of 1170 Oe

seems to be ideal (1-15) ). We have shown earlier (6,7) that a fast and reproducible warm-up of samples in contact with cylindric ferromagnetic conductors can be obtained by high frequency induction heating. Con- ductors of 0.5 mm diameter can reach the Curie tem- perature of the ferromagnetic material in under 30 • 10

-3

sec (7). Although the use of high frequency induction heating in pyrolysis had been suggested earlier by H.

Szymanski et al., (16, ef 17) the possibility of limiting the temperature to the Curie Point and therefore achieving an inherently well-defined end temperature was not realized at that time.

The power consumption N [cal cm

-2

sec

-1

] per unit surface of a ferromagnetic conductor located along the axis inside a high-frequency induction coil (7,18-20) is given by

N = 2/2- V2

-

H

2

p (1/s) F(r,․) Eq. 1 where

S= VPI7r7ilogr Eq. 2

H: Magnetic field inside the coil r: Radius of the conductor

p: Specific electric resistance of the conductor s: Skin depth of the eddy current

F: Function of r/s; lim F (s,r) r1 s --> co = — V2 Relative permeability (>1 for ferromag- netic conductors below the Curie tempera- ture T

0

, for non-ferromagnetic conduc- tors)

p,,, = 47r • 10

-.9

V sec/Acm v: Frequency of the oscillator.

The relative permeability tt, of a ferromagnetic con- ductor suddenly drops when it reaches the Curie Point

(19). This usually results in a sudden increase in the skin depth s so that 1/s and F (s,r) become smaller and the power consumption of the conductor decreases.

A further increase in temperature may therefore be in- hibited. However, it is important to realize that is not only a function of the temperature but also of the magnetic field H. To illustrate the effect of the differ- ent parameters the power consumption for situations of practical importance (see Figures 1-4 and Table I)

6. Giacobbo, H., and Simon, W., Pharm. Acta Hely. 39, 162 (1964); Festschrift zum 60. Geburtstag von Jacob Bfichi (X. Perlia, ed.), Verlag Schweizer Apotheker- verein, Zilrich, 1963, S. 199.

7. Simon, W., and Giacobbo, H., Chemie-Ing.-Tech. 37, 709 (1965).; Angew. Chem. Internat. Edit. 4, 940

(1965).

8. Levy, R. L., Chromatog. Rev. 8, 48 (1966).

9. Perry, S. G., J. Gas Chromatog. 5, 77 (1967).

10. Noffz, D., and Pfab, W., Z. Anal. Chem. 228, 188 (1967).

11. Noffz, D., Pfab, W., and Benz, W., GDCh-Hauptver- sammlung, Fachgruppe Analytische Chemie, Berlin, 1967.

12. Brauer, G. M., J. Polymer Sci. Part C 8, 3 (1965).

13. Coupe, N. B., and McKeown, M. C., Pye Unicam Chromatography Bulletin 2, (4), 8 (1968).

14. Willmott, F. W., J. Chromatog. Sci. 7, 101 (1969).

15. Audebert, R., Ann. Chim. (Paris) 3, 49 (1968).

16. Szymanski, H., Salinas, C., and Kwitowski, P., Na- ture 188, 403 (1960).

17. Andrew, T. D., Phillips, C. S. G., and Semlyen, J. A., J. Gas Chromatog. 1, 27 (1963).

18. Brunst, W., "Die Induktive Vnrmebehandlung,"

Springer, Berlin, 1962.

19. Bozorth, R. M., "Ferromagnetism," Van Norstrand Company, Toronto, New York, London, 1951.

20. Biihler, Ch., Thesis ETH, Zllrich, 1970.

324 7 JUNE 1970 JOURNAL OF CHROMATOGRAPHIC SCIENCE • VOL. 8

(4)

0

1', [•C] 0 [°c]

TEMPERATURE TEMPERATURE

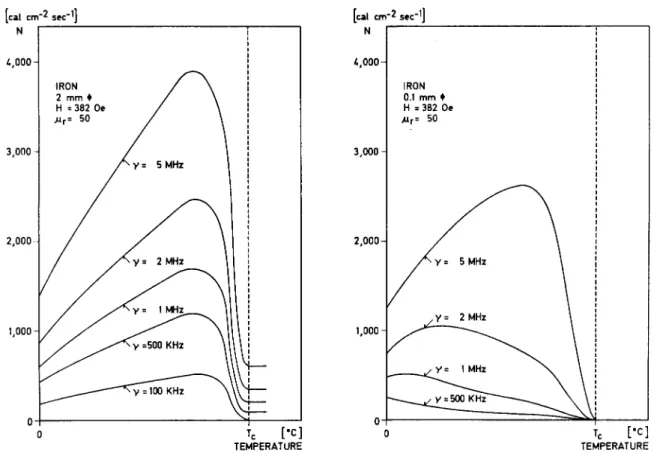
Figure 2. Temperature dependence of the power consumption of iron conductors in a high frequency induction field of 328 Oe as a function of the oscillator frequency.

IRON y 500 KHz H 382 Oe Air= 50

0- o-1

0 Tc PC 0 7, [°C]

TEMPERATURE TEMPERATURE

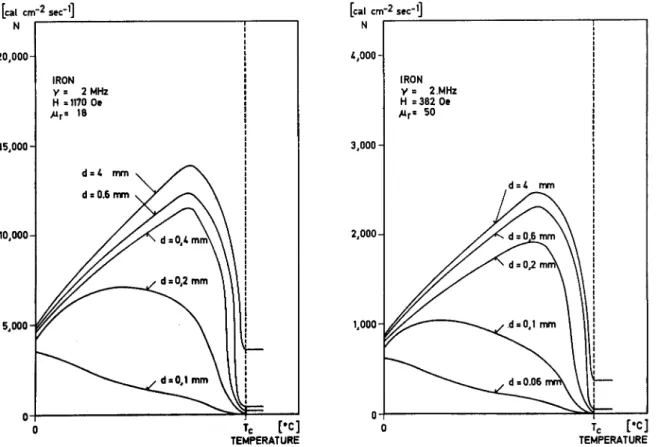
Figure 3. Temperature dependence of the power consumption of iron conductors in a high frequency induction of 1170 and 382 Oe as a function of the diameter of the conductor at an oscillator frequency of 500 KHz.

was calculated. On inspection of these figures it be- comes obvious that there is only a small change in power consumption at the Curie Point T e for wire diameters of approximately 0 1 mm and frequencies up to around 1 MHz. Wire diameters of more than 1

mm give a relatively high power consumption above the Curie Point T e ; this results in comparatively small heat losses and concurrently higher end temperatures, which may lie above T

0

. Considering radiation and con- duction heat losses warm up curves as given in Figures

JOURNAL OF CHROMATOGRAPHIC SCIENCE • VOL. 8 JUNE 1970 • 325

(5)

Applied Magnetic

Field [Oe]

Type of Oscillator

Frequency of Oscillator

v

[KHz]

Relative Permeability [0 ° C]

Fe Ni

Rise-time of an iron wire of 0.5 mm diam. to Curie Co temperature [sec]

[cal cm-2 sec-11 N

20,000- IRON y 2 MHz H .1170 Oe Ar' 18 15,000-

T c [eC] 0 Tc [•C]

TEMPERATURE TEMPERATURE

Figure 4. Temperature dependence of the power consumption of iron conductors in a high frequency induction field of 1170 and 382 Oe as a function of the diameter of the conductor at an oscillator frequency of 2 MHz.

[cal cm-2 sec' N 4,000-

IRON Y 2.MHz H =382 Oe g r . 50 3,000-

2,000-

1,000 - .7 ./

d =4 mm

d .0 6 rnm d =0,2 m

41.0,1 mm

0:1=0.06

Table I. Data for Different Oscillators Used in PGC.

ETH 171 480 1170 18 13.5 11.6 30 • 10 -3

Fischer* 1200 382 50 16.5 21 80 • 10 -3

Pye Unicam** 550 — — ca. 2

Packard*** — — — —

*Hochfrequenz-Pyrolyse, Fischer Labortechnik, 532 Bad Godesberg, Germany.

**Curie Point Pyrolyser, Pye Unicam Ltd., Cambridge, England.

***Model 891, Packard Instrument Company, Inc., Downers Grove, III.

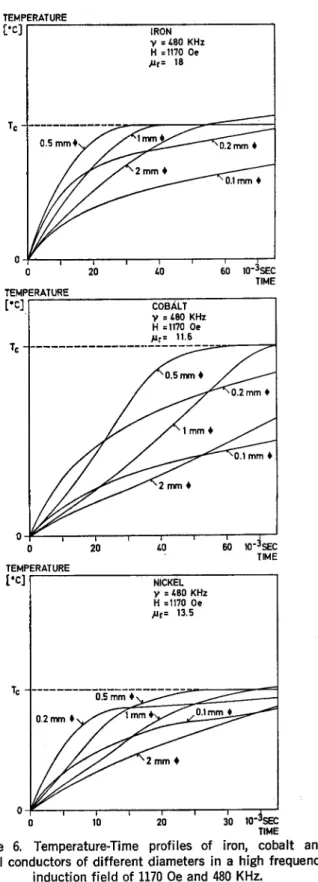
5 and 6 can be computed (21). These figures show that the optimal wire diameter for a fast warm-up and a constant end temperature decreases with increasing frequency and has to be defined for each and every oscillator used. For oscillators of about - 500 KHz and 1.2 MHz the wire diameters should be around 0.5 and 0.2 mm, respectively. Since the magnetic Field H within the coil depends on the output of the oscillator and the induction coil geometry, these two parameters are important for the rise-time (see Equation 1).

The computed rise times shown in Figures 5 and 6 are in perfect agreement with experimental values (7,22,23). An example of a warm-up of an iron con- ductor is given in Figure 7. It was recorded using a low-mass thermocouple and an oscilloscope as de-

scribed earlier (22). A low generator output obviously leads to small magnetic fields H and long rise-times (2,13). This, as well as unsuitable choice of conductor diameters and improper coupling of the coil to the oscillator, may have been the cause for some of the relatively long rise-times observed (2). In contrast to certain claims (14) there are only small differences in the temperature rise-times between the surface and cen- ter of a conductor at frequencies around 500 KHz

21. Schuster, R., Diss. Ilmenau, 1966.

22. Giacobbo, H., Diss. ETH, Ztirich, 1964.

23. Simon, W., Kriemler, P., Voellmin, J. A., and Steiner,

H., J. Gas Chromatog. 5, 53 (1967).

326 • JUNE 1970 JOURNAL OF CHROMATOGRAPHIC SCIENCE • VOL. 8

(6)

TEMPERATURE [•C]

0 0 TEMPERATURE [•C]

20 40 60 10-3SEC

TIME

Tc —

COBALT y =480 KHz H =1170 Oe Ik. 11.6 Tc

IRON y =480 KHz H =1170 Oe j.tr= 18

Ç °.5mmi mmi 2

0.2 mm

0.1 mm •

0 0 TEMPERATURE [•C]

20 40 60 10- SEC

TIME

NICKEL y =480 KHz H =1170 Oe pr= 13.5

10 20 30 10-iSEC

TIME

Figure 6. Temperature-Time profiles of iron, cobalt and nickel conductors of different diameters in a high frequency

induction field of 1170 Oe and 480 KHz.

Tc

0

0 50 100 10-35EC

TIME

Figure 5. Temperature-Time profiles of iron, cobalt and nickel conductors of different diameters in a high frequency

induction field of 382 Oe and 1.2 MHz.

(24). There are therefore no basic lhnitations to using ferromagnetic tubes in Curie Point pyrolysis and plac- ing the sample to be studied within this tube [see L.

Ettre in (4) and Figure 8].

F. Farré-Rius and G. Guichon (5) point out that there are polymers showing decomposition half-times at 600°C smaller than the rise-time of about 30 • 10

-3

sec of a typical Curie Point pyrolyzer so that most of the sample will be fragmented before the temperature equilibrium of the pyrolysis system is reached. For

such cases obviously either an alloy with a lower Curie Point (lower pyrolysis temperature) * or a faster warm

*Ferromagnetic materials with Curie-Points of 400, 500, 600, 700, 800°C (Hochfrequenz-Pyrolyse, Fischer Labor- tecknik, 532 Bad Godesberg, Germany) as welt as many other materials for the range 70-1000°C are available (7).

24. Hegewald, F., Brown-Boveri Company Nachrichten 434 (July/August) 1961.

TEMPERATURE [°C]

TEMPERATURE [° c]

50 100 1 10-3SEC

TIME

NICKEL y= 1.2 MHz H =382 Oe gr. 16.5

JOURNAL OF CHROMATOGRAPHIC SCIENCE • VOL 8 JUNE 1970 • 327

(7)

1 SEC

TEMPERATURE [°C]

0102 0104 0.06 SEC

TIME ON OFF

OSCILLATOR

Figure 7. Temperature-Time profile of an iron conductor of 0.6 mm diameter in a high frequency induction field of 1170 Oe and 480 MHz. Left: schematic diagram; Right: Oscillo-

scope trace.

Figure 8. Computed warm-up of an iron wire in high frequency induction field.

up has to be chosen. At constant magnetic field- strength inside the high frequency induction coil the temperature rise-time may be substantially decreased by using larger oscillator frequencies and/or smaller- diameter ferromagnetic conductors. At 10 MHz the rise- time of an iron wire of 0.05 mm diameter is reduced to 5 • 10

-3

sec. (3820e) .

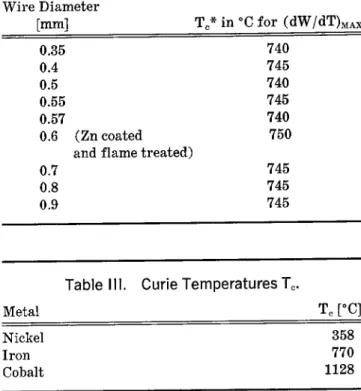
Although different systems giving short filament rise- times have been described recently (2) , there are un- certainties as to the end temperatures attained which is not the case with Curie Point systems. Table II shows results obtained in the determination of the Curie Point of materials of different origin. The values given in column two were obtained using a thermobal- ance (Mettler TAL Mettler Instruments AG, CH- 8606 Greifensee-Ztirich, Switzerland) and a permanent magnet a short distance from the sample pen. The temperature T o * of maximum weight change (dW/

dT) ma. given there is around 15°C lower than the tem- perature for (dW/dT) = 0. Samples with widely differ- ing histories give identical measurements; as Table II shows, T o * is 745 5°C, which is within the uncer- tainty-limits A repeated determination of the end tem- perature of a wire of 0 5 mm diameter using different oscillators gave 765 5°C, which is in good agreement with published data on Curie temperatures (Table III)

Table II. Curie Temperature T

c

* of Iron Wires of Different Origin.

Wire Diameter

[mm] Te* in °C for (dW/dT) MAX

0.35 740

0.4 745

0.5 740

0.55 745

0.57 740

0.6 (Zn coated 750

and flame treated)

0.7 745

0.8 745

0.9 745

Table III. Curie Temperatures T

c

.

T e [°C]

358 770 1128

Table IV. Distribution of Radioactivity after the Pyrolysis of 100 lig Labelled Sodium Salt of Benzoic

Acid.

Activity [%] out Source of Radioactivity of Benzoic Acid Salt

after Pyrolysis Ring-

14

C -140000

Ferromagnetic conductor 7 26

Pyrolysis glass capillary

(around conductor) 44 48

Components eluted from

Ge column 35 23

Losses 14 3

as well as the temperature of about 760°C for (dW/

dT) =0.

Although short temperature rise-times as well as constant and reproducible end temperatures may easily be obtained, the decrease in temperature after turning off the power is slow in comparison to the initial tem- perature rise (Figure 9) . In Figure 9 the computed decrease in temperature of wires of 2 cm length are given as a function of time. The lowest curve was com- puted for a wire having an electric connection to allow the temperature to be followed by resistance meas- urement. The agreement with experimental values (circles) is obvious. Since after pyrolysis a large per- centage of the pyrolysed material and the sample may remain on the conductor as well as on the glass walls surrounding the wire, a slow decrease in temperature must lead to irreproducible pyrolysis gas chromato- grams (see Table IV). Conductors of smaller diameter (around 0.05 mm) and therefore smaller mass may Metal

Nickel Iron Cobalt

328 JUNE 1970 JOURNAL OF CHROMATOGRAPHIC SCIENCE • VOL. 8

(8)

TEMPERATURE [°C]

WITHOUT AXIAL CONDUCTION WITH AXIAL CONDUCTION

0.6 mm • 0.6 mm$ 0 . 4 mm

20 1.0 SEC

TIME Figure 9. Decrease in temperature of iron wires

after warm-up to the Curie temperature.

0 0

give almost ideal square-wave temperature-time pro- files if adequate oscillator frequencies are used (1) . The problems connected with the slow decrease in temperature of conventional Curie Point pyrolysis sys-

tems may easily be overcome by by-passing the py- rolysis zone after turning off of the oscillator or by pyrolysing the sample in ferromagnetic tubes as will be shown later.

A detailed study of the surface of sample supports used in the pyrolysis GC by electron microscopy has shown that a control of the surface is of utmost im- portance to improve reproducibility. Details will be given elsewhere.

Acknowledgment

We thank Mettler Instruments AG, CH-8606 Grei- fensee-Z0rich, Switzerland, for the determination of Curie temperatures by thermogravimetry. The present work has been supported by the Schweizerischer Na- tionalfonds zur Foerderung der wissenschaftlichen For- schung (Research Project No. 5188.2). n

Manuscript received March 20, 1970

Presented at the Sixth International Symposium on Advances in Chromatography held in Miami Beach, Florida, June 2-5, 1970.

JOURNAL OF CHROMATOGRAPHIC SCIENCE • VOL. 8 JUNE 1970 • 329

Abbildung

Figure 2. Temperature dependence of the power consumption of iron conductors in a high frequency induction field of 328 Oe as a function of the oscillator frequency.
Figure 4. Temperature dependence of the power consumption of iron conductors in a high frequency induction field of 1170 and 382 Oe as a function of the diameter of the conductor at an oscillator frequency of 2 MHz.
Figure 6. Temperature-Time profiles of iron, cobalt and nickel conductors of different diameters in a high frequency
Figure 8. Computed warm-up of an iron wire in high frequency induction field.

Referenzen

ÄHNLICHE DOKUMENTE

Storage temperature Tstg °C -55 +100 Stored as bare product after unpacking. Solder heat resistance of the

We also show that reversal readily occurs where conventionally, a Stoner-Wohlfarth type barrier (KV/ kBT) would ensure thermal stability on a long

Measurement of T 1 and T 2 relaxation times from different brain regions of anesthetized mice may be used for a correct quantification of metabolite concentrations in

The propagator of two-dimensional Dirac oscillator in the presence of a constant magnetic field is presented by means of path integrals, where the spin degree-of-freedom is described

The propagator of two-dimensional Dirac oscillator in the presence of a constant magnetic field is presented by means of path integrals, where the spin degree-of-freedom is described

However, mainly in astrophysics [2 – 4], space physics [5, 6], and plasma physics [7,8], there arises very often the problem of the motion of a charged particle when the intensity

The fractions of hexane and dichloromethane extraction from marupa´ (Simaruba amara) and (Bertholletia excelsa) leaves were analyzed by HT-HRGC (high temperature high resolu- tion

Alberto dos Santos Pereira a , Moˆnica Freiman de Souza Ramos b , Elisa Suzana Carneiro Poc¸as a , Patricia Castro Moreira Dias b , Elisabete Pereira dos Santos b , Joaquim