LARGE-SCALE BIOLOGY ARTICLE 1 2
Zygotic Genome Activation Occurs Shortly After Fertilization in 3
Maize 4
5
Junyi Chen1+, Nicholas Strieder2+, Nadia G. Krohn1,3, Philipp Cyprys1, Stefanie 6
Sprunck1, Julia C. Engelmann2, and Thomas Dresselhaus1* 7
8
1Cell Biology and Plant Biochemistry, Biochemie-Zentrum Regensburg, University of 9
Regensburg, 93053 Regensburg, Germany.
10
2Institute of Functional Genomics, University of Regensburg, 93053 Regensburg, Germany.
11
3Present address: Department of Agriculture, Regional Campus of Umuarama, State 12
University of Maringa, 87507-190, Umuarama, PR, Brazil.
13
*Corresponding author: thomas.dresselhaus@ur.de 14
+Equal contributors 15 16
Short title: Zygotic gene activation in maize 17 18
One-sentence summary: Transcription profiles generated from maize gametes and zygotes 19
at different stages reveal a highly dynamic zygotic genome activation pattern, providing 20
insights into early embryo development.
21 22
The author responsible for distribution of materials integral to the findings presented in this 23
article in accordance with the policy described in the Instructions for Authors 24
(www.plantcell.org) is: Thomas Dresselhaus (thomas.dresselhaus@ur.de) 25 26
27
ABSTRACT 28
The formation of a zygote via the fusion of an egg and sperm cell and its subsequent 29
asymmetric division (ACD) herald the start of the plant’s life cycle. Zygotic genome activation 30
(ZGA) is thought to occur gradually, with the initial steps of zygote and embryo development 31
being primarily maternally controlled, and subsequent steps being governed by the zygotic 32
genome. Here, using maize (Zea mays) as a model plant system, we determined the timing 33
of zygote development and generated RNA-Seq transcriptome profiles of gametes, zygotes, 34
and apical and basal daughter cells. ZGA occurs shortly after fertilization and involves about 35
10% of the genome being activated in a highly dynamic pattern. In particular, genes 36
encoding transcriptional regulators of various families are activated shortly after fertilization.
37
Further analyses suggested that chromatin assembly is strongly modified after fertilization, 38
that the egg cell is primed to activate the translational machinery, and that hormones likely 39
play a minor role in the initial steps of early embryo development in maize. Our findings 40
provide important insights into gamete and zygote activity in plants, and our RNA-Seq 41
transcriptome profiles represent a comprehensive, unique RNA-Seq dataset that can be 42
used by the research community.
43 44
INTRODUCTION 45
The life cycles of animals and plants begin with the formation of a zygote, containing 46
the cytoplasm from two gametes, a large egg cell and a small sperm cell. This single 47
cell then develops via embryogenesis into an entire organism consisting of hundreds 48
of different cell types. In contrast to most animal systems, the flowering plant zygote 49
divides asymmetrically into daughter cells of completely different cell fates. While the 50
small, cytoplasm-rich apical daughter cell further develops into the embryo proper, 51
the highly vacuolated basal cell gives rise to the suspensor, which delivers nutrients 52
to the embryo and positions the embryo proper in the surrounding endosperm tissue 53
of the developing seed. Little is known about the establishment of zygote polarity and 54
the gene regulatory network that leads to asymmetric cell division and cell fate 55
determination in both daughter cells (Zhao et al., 2017). Due to the unequal 56
distribution of their cytoplasm, it is generally thought that maternal factors contributed 57
by the egg regulate zygote and early embryo development. The maternal-to-zygotic 58
transition (MZT) depends on both zygotic genome activation (ZGA) and the 59
degradation of maternal components. In animals, ZGA occurs after the first cell cycle 60
in mammals and as late as the sixth to eighth round of the cell cycle in insects, fish, 61
and amphibians (Schier, 2007; Lee et al., 2014). The time point at which ZGA occurs 62
in plants has long been debated. Currently, the zygote is thought to be in a relatively 63
quiescent transcriptional state, and ZGA is thought to occur gradually rather than as 64
an all-or-none process initiated before the first division (Baroux and Grossniklaus, 65
2015; Zhao and Sun, 2015). However, analyses of a few candidate genes have 66
indicated that ZGA in flowering plants occurs before zygotic division (Zhao et al., 67
2017).
68
To characterize the onset of ZGA at the whole-genome level, it is necessary 69
to determine the transcriptome profiles of both gametes and to identify de novo 70
generated transcripts from the zygotic genome. In the current study, we established 71
methods to manually isolate living male and female gametes, zygotes at different 72
stages, and their daughter cells using maize (Zea mays) as a model flowering plant.
73
We then generated RNA-Seq data from these cells and investigated the 74
transcriptome dynamics after fertilization. We compared the transcriptomes of maize 75
and Oryza sativa (rice) gametes and explored how the cell cycle, chromatin, and 76
auxin pathways are regulated after fertilization. Finally, we identified transcription 77
factor (TF) and receptor-like kinase genes associated with the various cell types and 78
zygotic stages and found that ZGA in maize occurs shortly after fertilization, 79
displaying a highly dynamic pattern.
80 81 82
RESULTS AND DISCUSSION 83
Manual cell isolation, RNA-Seq, validation, and data quality 84
Maize plants were grown in indoor walk-in growth rooms to reduce seasonal 85
variability in zygote development. We manually isolated cells of the inbred line B73 86
at 2-h intervals over a 2.5-day period as described in Methods. We used DAPI 87
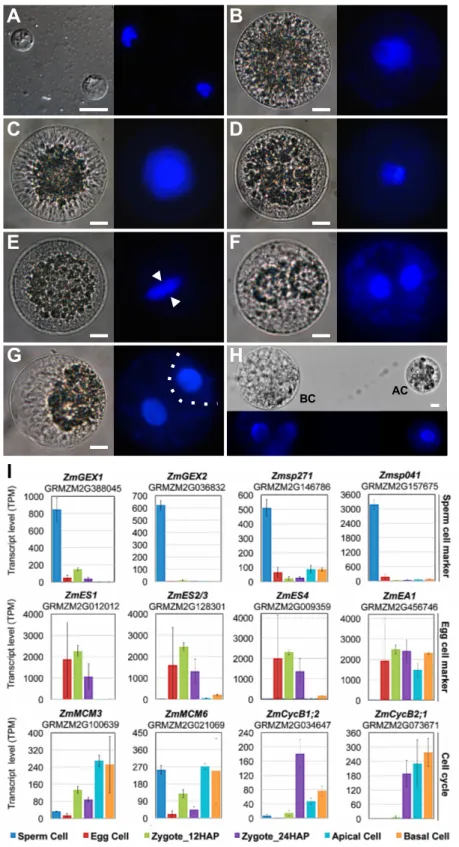
staining as a gross indicator to investigate cell cycle stages. As shown in Figure 1A, 88
sperm cells consist mainly of the nucleus, containing highly condensed chromatin.
89
Egg cell chromatin appeared less condensed than sperm cell chromatin and stained 90
very weakly with DAPI. The strongest DAPI staining was detected in zygotes at 24 91
hours after pollination (HAP), indicating that S-phase was complete. Early anaphase 92
occurred at ~30 HAP, and telophase began at 35 HAP. Cytokinesis was visible at 43 93
HAP, and asymmetric cell division (ACD) was completed by 48 HAP. The small 94
cytoplasm-rich apical and vacuolated basal cells could be manually separated at ~52 95
HAP.
96
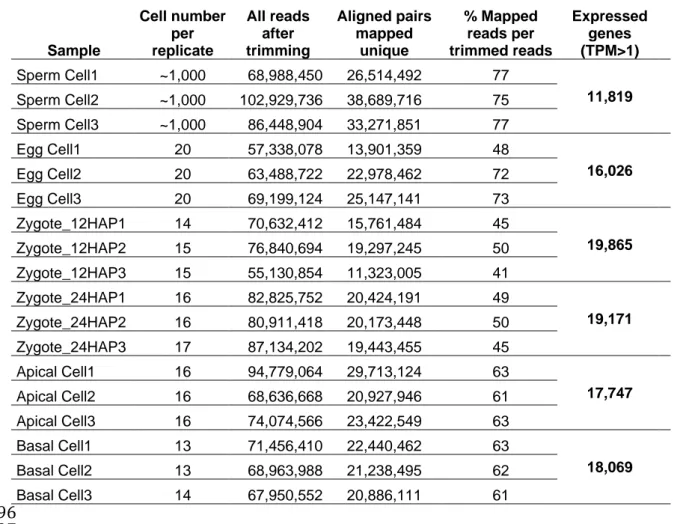
The protocol used to generate RNA-Seq data from only a few plant cells is 97
described in Methods. Three biological replicates were prepared from approximately 98
1,000 sperm cells each and 13–20 cells each for the other stages (Table 1, see also 99
Supplemental Table 1 and Supplemental Figures 1 and 2 for samples, 100
sequencing details, and library quality). A gene expression master list, containing the 101
median expression values of each cell type for the 39,469 annotated maize genes, 102
protein annotations, and homologs from Arabidopsis thaliana and rice is provided in 103
Supplemental Data Set 1.
104
For validation and initial analysis of the dynamics of gene expression patterns 105
obtained from the RNA-Seq data, we focused on the transcript levels of 12 genes 106
that were previously shown (by single-cell RT-PCR) to be highly or differentially 107
expressed during fertilization and zygote development in maize (Engel et al., 2003).
108
In agreement with previous results, the gamete-expressed membrane protein genes 109
ZmGEX1 (SP vs. all: log2FC >4.0*) and ZmGEX2 (SP vs. all: log2FC >7.4*) were 110
highly and specifically expressed in sperm cells, as were Zmsp271 (SP vs. all:
111
log2FC >3.8*) and Zmsp041 (SP vs. all: log2FC >5.2*), which were identified in the 112
same screen (Figure 1I, Supplemental Data Sets 1–3). ZmEA1 (EC vs. SP: log2FC 113
=8.7*) and ZmES1-4 (EC vs. AC/BC: log2FC >2.9 to 9.7*, Zy24 vs. AC/BC: log2FC 114
>2.4 to 8.7*), encoding secreted peptides required for micropylar pollen tube 115
guidance and pollen tube burst, respectively, were highly expressed in egg cells and 116
synergids and were significantly downregulated after fertilization (Cordts et al., 2001;
117
Marton et al., 2005; Amien et al., 2010) (Supplemental Data Set 3). The cell cycle 118
genes ZmMCM3, ZmMCM6, ZmCycB1;2, and ZmCycB2;1 were previously shown to 119
be induced after fertilization (Sauter et al., 1998; Dresselhaus et al., 1999b;
120
Dresselhaus et al., 2006). Expression of ZmMCM3 (Zy12 vs. EC: log2FC =2.7*, AC 121
vs. Zy24: log2FC =1.8*) and ZmMCM6 (Zy12 vs. EC: log2FC =2.0*, AC vs. Zy24:
122
log2FC =2.7*), marking the onset of DNA replication during S-phase (Maiorano et al., 123
2006), peaked in the zygote at 12 HAP, as well as after the first asymmetric zygote 124
division in the apical cell, which divides more rapidly than the basal cell. The cell 125
cycle regulatory genes ZmCycB2;1 (Zy24 vs. Zy12 log2FC =3.6*) and ZmCycB1;2 126
(Zy24 vs. Zy12 log2FC =5.0*), which mark the G2/M-transition (Maiorano et al., 127
2006), were strongly induced at 24 HAP. In contrast to ZmCycB1;2 (AC/BC vs. Zy12 128
log2FC >1.9*), the expression levels of ZmCycB2;1 (AC/BC vs. Zy12 log2FC >5.5*) 129
were also high in apical and basal cells after zygote division (Sauter et al., 1998). In 130
summary, these dynamic changes in gene expression (Figure 1B) are in perfect 131
agreement with previous reports, which together with strong correlation between 132
biological replicates (Supplemental Figure 2) assures the high quality and reliability 133
of our data.
134
Contamination of transcriptomes by RNA from maternal tissues has recently 135
been discussed as a serious issue that can result in poor reproducibility and 136
misinterpretation of data sets (Schon and Nodine, 2017). We therefore investigated 137
the presence of transcripts derived from genes expressed in maternal nucellus tissue 138
surrounding embryo sacs (Chettoor et al., 2014) to evaluate the possibility of 139
contamination. None of the nucellus-expressed genes, including GRMZM2G570791 140
(alpha subunit of DNA-directed RNA polymerase), GRMZM2G125823 (heparanase- 141
like protein), GRMZM2G099420 (Cinnamoyl CoA reductase), and 142
GRMZM5G803276 and GRMZM2G336859 (encoding unknown proteins), were 143
detected in any of our data sets. These results indicate that our data sets are free of 144
maternal RNA contamination and that the two washing steps were sufficient for 145
removing maternal RNA from the burst maternal nucellus cells.
146 147
Comparison of transcriptomic data from maize and rice gametes 148
A comprehensive comparison of gene expression activity after fertilization has not 149
been reported yet for any plant species, and the present study thus represents the 150
first report of global gene expression patterns in gametes, zygotes, and daughter 151
cells. Therefore, we restricted our comparisons to the transcriptomes of maize and 152
rice gametes (egg and sperm cells). It was not possible to include the transcriptomes 153
of Arabidopsis thaliana gametes in the comparison, as RNA-Seq data were not 154
available, and the available microarray data (Borges et al., 2008; Wuest et al., 2010) 155
could not be accurately normalized to allow us to draw conclusions and lacked 156
information for thousands of genes. In addition, each gamete in the data set was 157
measured in a different experiment.
158
We used published RNA-Seq data from rice sperm and egg cells (Anderson et 159
al., 2013) and initially identified the rice homologs using public databases, i.e., 160
EnsemblPlants and RiceAnnotationGenomeProject, which combine data from many 161
species to identify putative orthologs. If the identity of the homologs/orthologs was 162
unclear or unknown due to a lack of sequence information, we did not include them 163
in the comparison. To compare transcription patterns in rice versus maize gametes, 164
the gene expression values were binned into 200 expression level categories using 165
the 99th percentile per species as the highest category (see also Supplemental Data 166
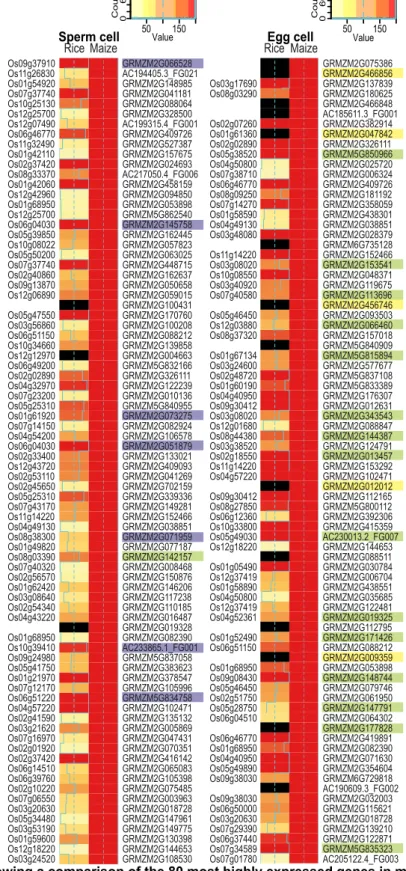
Set 4). We selected the 80 most strongly expressed genes (TOP80 genes) in maize 167
sperm and egg cells and compared their expression levels with those of the 168
respective genes in rice (Figure 2). A summary of the TOP30 genes of all maize cell 169
types, including their annotation, is provided in Supplemental Data Set 5.
170
Many of the predicted rice homologs/orthologs displayed similar, strong 171
expression patterns. The proportion of genes with high expression levels was greater 172
in egg cells than in sperm cells (Figure 2). The observation that many predicted rice 173
homologs/orthologs displayed weaker expression patterns in rice than in maize 174
might be due to our methods (as we summarized rice ortholog data using the 175
median), the difficulty in predicting true orthologs within larger gene families, and/or 176
the lack of common controls to normalize these two studies. Tightly controlled 177
parallel RNA extraction from cells of different species and the identification of an 178
appropriate control cell type common to both plant species may improve interspecies 179
comparisons. However, our comparison pointed to some similarities and general 180
findings regarding genome activity. Among the TOP80 genes expressed in maize 181
sperm cells, 10% encode histones and high-mobility group (HMG) proteins (Figure 182
2A). This finding might explain the strongly condensed, compact sperm cell 183
chromatin (see also Figure 1A). Indeed, a similar observation was reported for rice 184
sperm cells (Russell et al., 2012b; Anderson et al., 2013). Notably, no chromatin 185
gene is among the TOP80 genes in maize egg cells. This finding correlates well with 186
the less condensed chromatin in these cells and the difficulty in staining egg cells 187
with DAPI (Figure 1A). However, in strong contrast to sperm cells, 20% of the 188
TOP80 genes in maize egg cells encode proteins of the translational machinery, 189
most of which also displayed similar expression patterns in rice egg cells. These 190
include two genes encoding the translation initiation factor IF5A (Dresselhaus et al., 191
1999a), a gene encoding the translation initiation factor SUI1 (Cui et al., 1998), two 192
genes encoding the translation elongation factor EF1A (Budkevich et al., 2002), and 193
many ribosomal protein genes. These observations indicate that sperm cells are 194
translationally inactive, whereas egg cells are either highly active or well prepared to 195
strongly enhance translation after being activated during the fertilization process.
196
Another interesting observation relates to transcripts encoding polymorphic 197
EA1-box proteins and small secreted cysteine-rich proteins (CRPs), which we found 198
in maize egg cells, but not in sperm cells. The corresponding proteins play key roles 199
in female gamete cell identity, as well as pollen tube guidance and burst in maize (for 200
review, see (Dresselhaus et al., 2011; Dresselhaus et al., 2016). However, due to 201
their polymorphic nature, no unambiguous homologs of the individual members were 202
identified in the databases from Ensembl Compara or the Rice Genome Annotation 203
Project. Through manual searches, we identified similar genes in rice (Márton et al., 204
2005; Uebler et al., 2015), but true orthologs could not be predicted based on protein 205
comparisons, and none of the candidate genes have been functionally tested in rice 206
(Figure 2B). However, this finding indicates that genes involved in processes directly 207
associated with fertilization appear to be polymorphic and specific-specific, thus 208
representing prime candidate genes involved in speciation mechanisms (Rieseberg 209
and Willis, 2007).
210 211
Histone variants and chromatin-based gene regulation 212
Histones are the major protein components of chromatin and, more importantly, 213
dynamic regulators of transcription. To begin to uncover the molecular basis of 214
chromatin remodeling and epigenetic reprogramming in plant gametes and the onset 215
of embryo development, we investigated the expression patterns of histone variants 216
and chromatin assembly factor genes in more detail (Figure 3, Supplemental Data 217
Set 3G; important gene families).
218
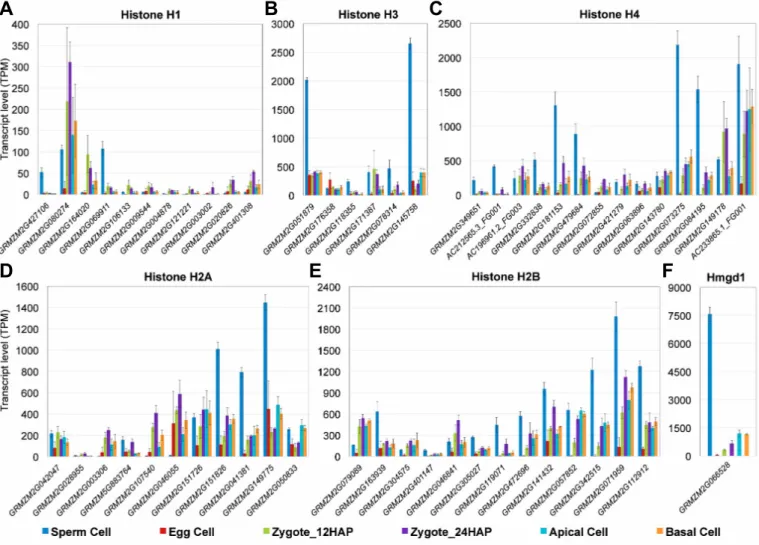
As mentioned above, some canonical core histones, including two H3 (7 of 17 219
genes: SP vs. all: log2FC>1.5*) genes and at least three H4 (9 of 15 genes: SP vs.
220
all: log2FC>1.4*) genes, were predominantly and highly expressed in sperm cells 221
(Figure 3B and C), and may contribute to the compactness of the chromatin and 222
suggesting that sperm cells are already prepared for S-phase. Moreover, the most 223
highly expressed gene in sperm, ZmHmgd1 (SP vs. all: log2FC>3.9*), was 224
expressed at much higher levels in sperm cells than in any other cell type examined 225
(>~6-fold) (Figure 3F). ZmHmgd1 encodes an HMG box protein that plays a role in 226
chromosome condensation (Thomas and Travers, 2001) and is thought to possess a 227
role similar to that of histone H1 in chromatin assembly, as both proteins bend linker 228
DNA at the entry and exit points of the nucleosome. This hypothesis may explain 229
why linker histone H1 genes are expressed at rather low levels in sperm cells, 230
although their DNA is densely packed to ensure chromatin stability during sperm 231
delivery. After fertilization, Hmgd1 appeared to be partially replaced by histone H1, 232
as the expression of the H1 gene was strongly activated and peaked in 24 HAP 233
zygotes (9 of 11 genes: Zy24 vs. EC: log2FC>1.8*) (Figure 3A), whereas ZmHmgd1 234
(Zy24 vs. SP: log2FC= -5.0*) was strongly repressed.
235
The most abundant H3 gene in maize sperm (GRMZM2G145758, SP vs. all:
236
log2FC>4.0*) encodes an unusual replication-independent (RI) H3.3-like variant that 237
was also predominantly expressed in anthers and was previously designated as 238
ZmAPH3. Phylogenetic analysis showed that ZmAPH3 is most similar to the 239
Arabidopsis male gamete-specific histone H3 variant gene AtMGH3 (Okada et al., 240
2005) (Supplemental Figure 3A). However, the horizontal distance and the low 241
number of histone variants and species included in the phylogenetic analysis 242
suggest that they share a rather distant relationship. All other sperm cell-enriched H3 243
variants belong to the RI H3.3 group (Supplemental Figure 3A) (four orthologous 244
genes, RI H3.3: SP vs. Zy24: log2FC>1.6*). In Arabidopsis, a limited subset of H3.3 245
variants referred to as the main HTR (HISTONE THREE-RELATED) protein genes 246
are predominately expressed in the male gamete (Ingouff et al., 2010). Three 247
AtMGH3 homologs and two other RI H3.3 variants are also highly expressed in rice 248
sperm cells, while other core H3 genes exhibit only limited expression in these cells 249
(Russell et al., 2012a). These findings suggest that RI H3.3 variants encoded by only 250
a few genes act as major histone H3s in the sperm cells of flowering plants.
251
Two replication-coupled canonical H2As (GRMZM2G151826 and 252
GRMZM2G041381) exhibited high transcript levels in maize sperm cells, but the 253
most highly expressed H2A (GRMZM2G149775, SP vs. all, log2FC>2.7) belongs to 254
the RI H2A.Z class (Supplemental Figure 3B), which is associated with 255
nucleosomes at transcription start sites, especially those also containing H3.3 (Deal 256
and Henikoff, 2011). Therefore, together with histone H3.3 and H2A.Z, which mark 257
active chromatin via RI nucleosome assembly (Ahmad and Henikoff, 2002; Deal and 258
Henikoff, 2011), HMGD1 (encoded by ZmHmgd1), which likely represents the most 259
abundant chromatin architectural protein in sperm that binds to highly accessible 260
regulatory chromatin and active promoters, probably keeps the highly condensed 261
sperm cell chromatin at least partially accessible. This hypothesis is supported by 262
our RNA-Seq data set, which includes transcripts of approximately 11,000 263
differentially upregulated genes in sperm cells versus zygotes at 12 HAP (Figure 264
4F), including a subset of TF genes, despite the compact chromatin in sperm cells.
265
Upon fertilization, H3 variants from male and female gametes are actively 266
removed in Arabidopsis (Ingouff et al., 2010), a scenario that likely also occurs in 267
maize, as the expression of the canonical core histone repertoire was activated in 268
conjunction with a dramatic reduction in H2A.Z, H3.3, and Hmgd1 expression and a 269
strong increase in H1 expression (Figure 3A). Thus, it appears that the paternal 270
chromatin was reprogrammed by newly synthesized and entirely different sets of 271
histones in the zygote. This theme may even extend to apical and basal cells, since 272
the list of expressed orthologs of H3 and H4 again shifted to genes different from 273
those expressed in zygotes.
274
Finally, while the canonical core histones were mostly expressed at very low 275
levels in egg cells (Figure 3), they were induced in zygotes at 12 HAP, indicating the 276
G1 phase of the cell cycle. Expression peaked in zygotes at 24 HAP, suggesting that 277
DNA replication was almost complete (Figure 3). These observations support the 278
hypothesis that the egg cell is arrested and requires activation after gamete fusion.
279
Thus, chromatin-based transcriptional reprogramming in the zygote may represent a 280
key step in MZT and the initiation of the sporophytic generation.
281 282
ZGA occurs shortly after fertilization in maize 283
To identify the global onset of ZGA, it is important to examine the transcriptomes of 284
both gametes, i.e., egg and sperm cells, as well as zygotes at different stages. We 285
therefore investigated zygotes collected at 12 and 24 HAP. At 12 HAP, i.e., only ~4 h 286
after fertilization, all egg cells were fertilized, as indicated by the presence of 287
degenerated receptive synergid cells. These egg cells were considered to represent 288
early zygotes. We chose to investigate zygotes at 24 HAP, as they appeared to be 289
activated at this point, as indicated by the duplication of DNA content (Figure 1A). At 290
later time points after pollination, the zygotes underwent mitosis, but the stages 291
appeared less synchronous than those at earlier time points. We chose genes with 292
an abs(log2FoldChange) >1 and adjusted p-value<0.05 in the respective comparison 293
as genes with a potential biological function and determined whether they were 294
induced or repressed. Based on these criteria, sperm cells formed the most distinct 295
group, expressing 4,090 differentially upregulated genes in all comparisons (Figure 296
4F). As all of the other cell types are similar, fewer genes were induced in these cells 297
compared to all other cell types; 482 differentially upregulated genes were detected 298
in egg cells in all comparisons, 109 were detected in zygotes at 12 HAP, 31 were 299
detected in zygotes at 24 HAP, and 6 and 8 were detected in apical and basal cells, 300
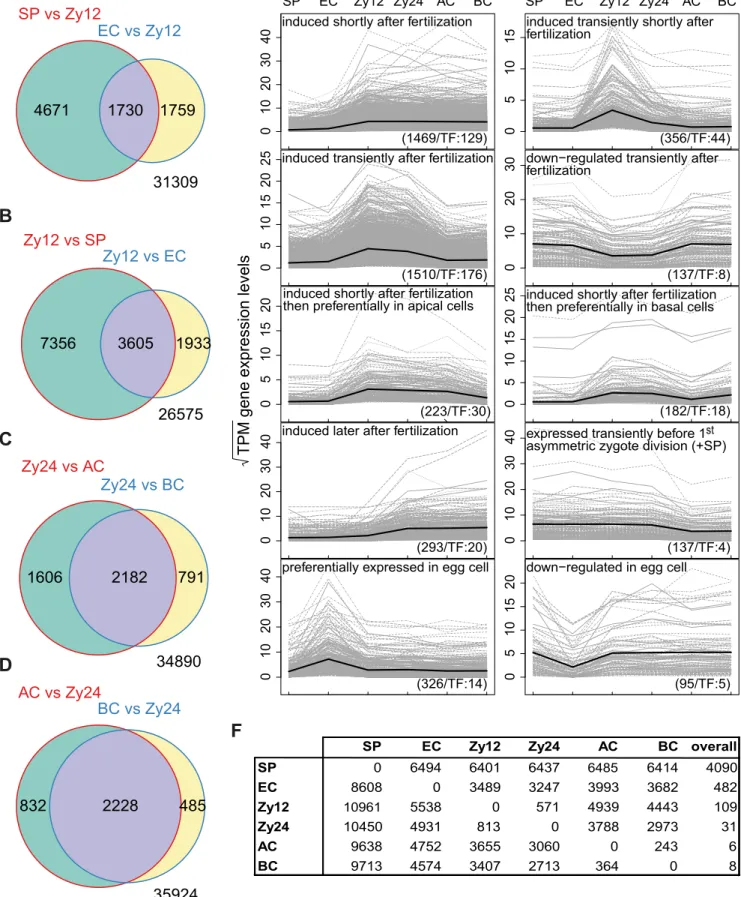
respectively (Figure 4F, Supplemental Data Set 6).
301
We compared zygotes at 12 HAP to both sperm and egg cells and identified 302
3,605 induced genes (9.1% of the maize transcriptome of 39,469 annotated genes;
303
Schnable et al., 2009) over all chromosomes shortly after fertilization (Figure 4B).
304
This high number of activated genes indicates that global ZGA in maize already 305
occurs in the early zygote and not several days after fertilization, as previously 306
reported (Grimanelli et al., 2005). Although de novo transcription has also been 307
observed in Arabidopsis zygotes (e.g., Autran et al., 2011; Nodine and Bartel, 2012;
308
Del Toro-De León et al., 2014), the timing of global ZGA in this species is unclear, 309
and some reported results are currently under debate due to contamination from 310
maternal tissues (Schon and Nodine, 2017).
311
We compared zygotes at 12 HAP with sperm and egg cells and identified 312
7,356 and 1,933 induced genes, respectively (Figure 4B). Furthermore, we identified 313
1,730 differentially upregulated genes in sperm and egg cells versus zygotes at 12 314
HAP (Figure 4A), which can also be viewed as genes downregulated in zygotes at 315
12 HAP compared to gametes. These findings also suggest that major 316
rearrangements in the transcriptome occur following fertilization.
317
To obtain a global overview of transcriptome dynamics during zygote 318
development, we defined various gene expression profiles as capturing not only on 319
and off states, but also the induction or repression of genes during the transition from 320
gametes to zygotes and their descendant cells (Figure 4E, Supplemental Data Set 321
6). Very specific gene expression profiles were found for egg cells: 326 genes were 322
upregulated in this cell type, whereas 95 genes were downregulated. Shortly after 323
fertilization, 356 and 1,510 genes were transiently induced only in zygotes at 12 HAP 324
and in zygotes at both stages, respectively. Approximately 10% of the genes in each 325
group encode transcriptional regulators. Of the 3,808 genes induced after 326
fertilization, 223 were predominantly expressed in apical cells, whereas 182 were 327
predominantly expressed in basal cells. These results indicate that the expression 328
levels of many genes are higher in the zygote than in its progenitor cells, supporting 329
the notion of an early onset for ZGA. Few genes were transiently repressed after 330
fertilization (137 genes). Together, these findings reveal a highly dynamic 331
transcriptional landscape after fertilization in maize and demonstrate that ZGA 332
occurs shortly after fertilization in this plant. Studies involving pollination with other 333
inbred lines are now needed to distinguish between maternal and paternal 334
transcripts and thus to determine whether both genomes contribute equally to ZGA 335
in this species.
336 337
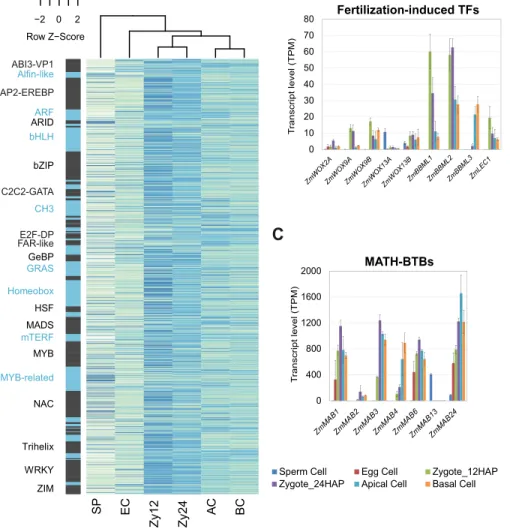
Transcription factor activation schemes in gametes and zygotes 338
As TFs are major regulators of gene expression, we next examined TF gene 339
expression levels in gametes and early zygotic embryos based on the maize TF 340
database Grassius (www.grassius.org). Across all cell types, 1,478 of 2,630 maize 341
TF genes were expressed in gametes and zygotes (log2FC>1 and padj<0.05 in at 342
least one comparison). Comparing their transcription levels during early development 343
(Figure 5A, Supplemental Data Set 3) showed that zygotes formed a group distinct 344
from apical and basal cells, and that both groups differed from gametes. We 345
identified 428 TF genes that were induced in zygotes (12 and 24 HAP), 189 of which 346
were strongly activated shortly after fertilization (Zy12 vs. SP and EC, log2FC>3). We 347
detected 25 TF genes specifically expressed in pro-embryonic cells. Only 23 348
paternal and 103 maternal TF genes were expressed at similar levels in gametes 349
and zygotes (Supplemental Data Set 3). While we could not distinguish between 350
paternal and maternal mRNAs in our assays and were thus unable to identify the 351
maternal-to-zygotic transition (MZT) (Baroux and Grossniklaus, 2015), the results 352
suggest that approximately 8.6% (25+103/1,478) of expressed TF genes are 353
parentally transmitted, while 29% (428/1,478) are newly or more intensely 354
transcribed in maize zygotes. These data support the notion that TF genes are 355
activated early in maize zygotes (at 12 HAP; 403 of 428 TF genes were induced in 356
zygotes vs. 25 of 428 at 24 HAP) (Figure 5A).
357
We then identified important TF classes from the various expression profiles 358
(Supplemental Data Set 6; profiles of TF classes are summarized in Supplemental 359
Data Set 7). In sperm cells, many genes belong to the TF class AT-rich interactive 360
domain (ARID 5/10) proteins. Members of this class have been implicated in sperm 361
cell development in plants and mammals. In Arabidopsis, ARID1 is necessary for the 362
appropriate expression of DUO1, a major TF required for sperm cell formation 363
(Zheng et al., 2014). In mice, the loss of ARID4A combined with ARID4B 364
haploinsufficiency leads to spermatogenic arrest (Wu et al., 2013). In egg cells, we 365
detected high proportions of TFs from the classes FAR1-like (3/15), mTERF (8/30), 366
Sigma70-like (2/9), S1Fa-like (2/2), and GeBP (5/21) compared to the other cell 367
types analyzed. The first four classes are related to plastid development (Zhou et al., 368
1995; Ouyang et al., 2011; Kleine, 2012; Wei et al., 2012). This finding suggests that 369
a tightly controlled regulatory network controls plastid development during the first 370
steps in the plant life cycle. Members of the GL1 enhancer binding protein (GeBP) 371
class of leucine-zipper TFs have been linked to the cytokinin response in 372
Arabidopsis and are thought to be mainly expressed in vegetative meristems and in 373
the primordia of young leaves (Chevalier et al., 2008). Our data suggest that this 374
class of TFs also plays a role in the transition from egg cells to early zygotes.
375
As discussed above, at the first zygotic time point (12 HAP), genes for many 376
TF classes were induced (Supplemental Data Set 7). The auxin-responsive ARF 377
TFs (7/38) and the ethylene-responsive AP2-EREBP TFs (34/212) might be 378
important at this stage, as crosstalk between these pathways is thought to be 379
essential during zygote and pro-embryo development (see below). In addition, many 380
genes from the TF classes C3H/CCCH (18/54), Trihelix (11/41), ZIM (10/36), MADS 381
(15/77), NAC (26/134), bZIP (24/128), and Homeobox (26/133) were induced at this 382
time point. MADS-box TFs are associated with reproductive organ development and 383
play a role in gametes and in zygotic embryogenesis (Schreiber et al., 2004; Lehti- 384
Shiu et al., 2005).
385
386
Activation of embryo patterning 387
After ACD, WOX genes encoding homeodomain TFs mark apical and basal cell fate 388
upon zygote division in Arabidopsis (Breuninger et al., 2008). In maize, ZmWOX9A 389
and ZmWOX9B likely represent the homologs of AtWOX8 and AtWOX9, respectively 390
(Salvo et al., 2014). Both ZmWOX9A and ZmWOX9B were induced shortly after 391
fertilization (Zy12 vs. SP/EC:log2FC>5.9* and 7.0*, respectively) and were 392
expressed at higher levels in basal cells than in apical cell, like their counterparts in 393
Arabidopsis (Figure 5B, Supplemental Data Set 3B), indicating that they might play 394
a similar role in early embryonic patterning. However, unlike AtWOX2, which marks 395
apical descendants of the zygote, ZmWOX2A was expressed at very low levels in 396
basal cells, with almost no expression in apical cells. Instead, this gene was 397
expressed much later during seed development in the endosperm (Maize eFP 398
Browser at bar.utoronto.ca). This finding indicates that pattern formation regulated by 399
ZmWOX2A and other genes likely occurs later in maize embryogenesis than in 400
Arabidopsis embryogenesis (Zhao et al., 2017). Notably, ZmWOX13A is the only 401
WOX gene that was transcribed at high levels in sperm cells (SP vs. all:
402
log2FC>4.3*); whether it marks cell identity of the male gamete or represents a 403
zygote activator remains to be investigated. In Arabidopsis, BBM and LEC TF genes 404
are key players in embryogenesis, and the presence of either gene is sufficient to 405
induce competence for embryogenesis (Lotan et al., 1998; Boutilier et al., 2002).
406
Overexpressing a combination of the maize homologs WUS2 and BBM was recently 407
shown to significantly increase embryogenic potential in tissue culture and thus 408
represents a key mechanism to increase the transformation efficiency in maize 409
(Lowe et al., 2016). Notably, the maize homologs ZmBBML1 (Zy12 vs. SP/EC:
410
log2FC>10.5*), ZmBBML2 (Zy12 vs. SP/EC: log2FC>10.2*), and ZmLEC1 (Zy12 vs.
411
SP/EC: log2FC>7.9*) were already induced at 12 HAP (Figure 5B), suggesting that 412
the egg cell quickly acquires embryogenic competence and that the characteristic 413
embryogenic transcription program is activated shortly after fertilization. ZmBBML3 414
was induced in zygotes at 24 HAP (Zy24 vs. Zy12: log2FC=6.5*) and after zygote 415
division (AP/BC vs. Zy24: log2FC=3.5/3.9*), suggesting step-by-step activation of the 416
embryonic program. A comparison of apical and basal cells with zygotes at 24 HAP 417
revealed 2,228 genes induced in both cell types, 832 induced only in apical cells, 418
and 485 induced only in basal cells (Figure 4D). This induction was accompanied by 419
the downregulation of 2,182 genes in apical and basal cells versus zygotes at 24 420
HAP (Figure 4C). These data suggest that global rearrangements also occur in the 421
transcriptomes of apical and basal cells compared to their predecessor.
422
The development of multicellular organisms often involves ACDs to generate 423
daughter cells with different cell fates. Spindle positioning is particularly associated 424
with the generation of symmetric or asymmetric cell fates (Siller and Doe, 2009). The 425
MATH-BTB domain protein ZmMAB1, a component of a CUL3-E3 ubiquitin ligase 426
complex, regulates spindle length during the development of the male and female 427
germline in maize (Juranic et al., 2012). ZmMAB1 may also function like its animal 428
homolog, the key ACD regulator MEL-26, a factor required for embryogenic 429
morphogenesis that regulates the formation of mitotic spindles in the early embryo 430
(Pintard et al., 2003). As shown in Figure 5C, MAB family genes were strongly 431
upregulated (ZmMAB1-3, ZmMAB6 and ZmMAB24, Zy12 vs. SP: log2FC >1.5 to 432
10.7*) after fertilization in maize. The highest expression levels of these genes were 433
detected in zygotes at 24 HAP (Supplemental Data Set 3A; important gene 434
families), suggesting that they play roles in processes such as spindle positioning 435
during the first asymmetric zygote division (ZmMAB2-3, Zy24 vs. Zy12 log2FC=3.1*
436
and 1.8* respectively). Functional studies of ZmMABs are now needed to investigate 437
this hypothesis.
438 439
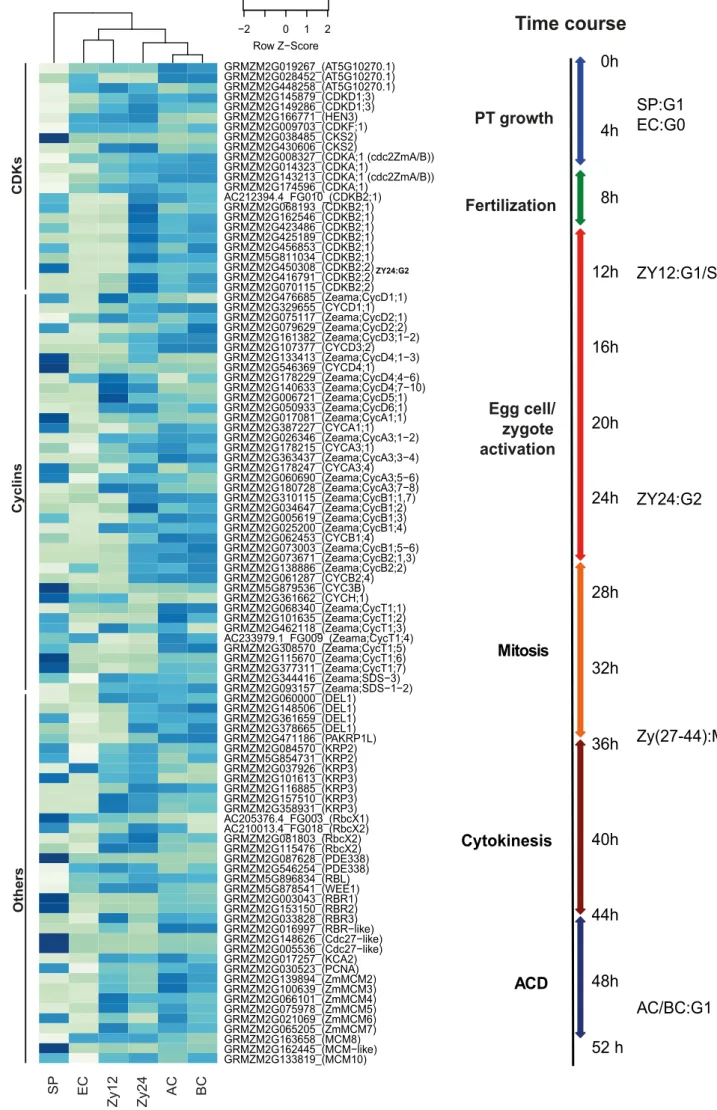
Cell cycle regulation during zygote development 440
Since previous reports provide only a glimpse of cell cycle regulation in plant 441
gametes and during zygote development, we investigated the expression patterns of 442
important cell cycle regulator genes. First, we searched for orthologs of Arabidopsis 443
cell cycle genes (Vandepoele et al., 2002) and then included cyclins and other cell 444
cycle-related factors described previously for maize (see Methods), resulting in a list 445
of 89 cell cycle genes (Supplemental Data Set 3). As shown in Figure 6A, 446
hierarchical clustering of these genes from different cell types clearly separated 447
sperm cell genes from a group of genes from egg cells and zygotes at 12 HAP. The 448
expression patterns of the genes from zygotes at 24 HAP were more similar to those 449
of apical and basal cells.
450
The G1-phase of sperm cells is characterized by high expression levels of 451
Cdc27-like genes (GRMZM2G148626, GRMZM2G005536, SP vs. all: log2FC>5.7*) 452
encoding subunits of the APC complex, which controls CDK degradation in M- and 453
G1-phase, and relatively low levels of CDK gene expression. Furthermore, 454
retinoblastoma-related protein genes RBR1 and RBR2 were highly expressed in 455
sperm cells (Figure 6A, SP vs. all: log2FC>2.9*). RBR1 and RBR2 mediate G1- 456
phase arrest by inhibiting E2F TFs, which in turn promote DNA replication (Sabelli et 457
al., 2013). Compared to the other cell types, egg cells showed by far the lowest 458
expression levels of cell cycle genes and lacked a typical cell cycle phase-specific 459
gene expression pattern. This finding, together with the results of cell cycle gene 460
expression analysis and the microscopy evidence reported above (Figure 1), 461
indicate that the egg cell is in a resting G0 stage rather than in G1 (Figure 6B).
462
Thus, the egg cell must be activated and its cell cycle synchronized with the sperm 463
cell cycle stage before karyogamy (fusion of both nuclei) is executed. A typical G1- 464
phase expression pattern was observed in zygotes at 12 HAP (Figure 6A), with 465
slightly upregulated expression of E2F TF genes (GRMZM2G060000, 466
GRMZM2G361659, GRMZM2G378665, Zy12 vs. EC, log2FC >2.5*) and (especially) 467
their cell cycle target genes (Supplemental Data Set 3). The latter include mini- 468
chromosome maintenance genes (ZmMCM3-6, Zy12 vs. EC: log2FC >2.0*), 469
encoding DNA-replication licensing factors required for replication initiation, and the 470
gene encoding proliferating cell nuclear antigen (PCNA), which acts as a scaffold to 471
recruit proteins involved in DNA replication and repair (Sabelli et al., 2009; Tuteja et 472
al., 2011). Notably, RBR3, encoding an activating factor of MCM2-7 transcription, 473
was specifically induced in zygotes at 12 HAP (Zy12 vs. EC: log2FC =2.2*), while 474
RBR1 and RBR2, two genes encoding repressors of E2F TFs, were repressed in 475
these zygotes compared to sperm cells (Zy12 vs. SP: log2FC< -3.8*). This 476
expression pattern coincided with the induction of CDK A genes (Zy12 vs. SP:
477
log2FC> 1.1 to 7.0*) and low levels of expression of CDK B genes, indicating that 478
fertilized egg cells had been activated and zygotes at 12 HAP were in G1-phase.
479
MCM2-7 expression levels were lower in zygotes at 24 HAP versus 12 HAP, 480
whereas CDK B2 genes (9 of 14 genes, Zy24 vs. Zy12: log2FC >2.8*) and B-type 481
cyclin genes were induced (8 of 9 genes, Zy24 vs. Zy12: log2FC >1.9*), especially 482
ZmCycB1;2, suggesting that S-phase was completed and the zygotes were prepared 483
for the G2/M-phase transition (Meijer and Murray, 2001). M-phase took place at 27–
484
35 HAP (Figure 1A). Notably, G1-phase markers such as MCM2-7 were expressed 485
at slightly higher levels in apical versus basal cells, hinting at more rapid cell cycle 486
progression in the apical cell after ACD.
487
Taken together, our cell cycle analysis by microscopy of DNA staining 488
patterns, transcription data from selected gene sets, and global cell expression 489
analysis of cell cycle genes allowed us to determine the timing of zygote 490
development in maize (Figure 6B). On average, fertilization occurs at ~8 HAP.
491
Sperm cells appear in G1-phase, and egg cells are in a resting G0-phase of the cell 492
cycle. Activated zygotes are in G1 phase at 12 HAP (~4 h after fertilization) and at 493
G1/S-phase at 24 HAP. Mitosis typically occurs at 26–36 HAP, and cytokinesis lasts 494
until 44 HAP. ACD is completed between 44 and 50 HAP, generating both apical and 495
basal cells in G1-phase.
496 497
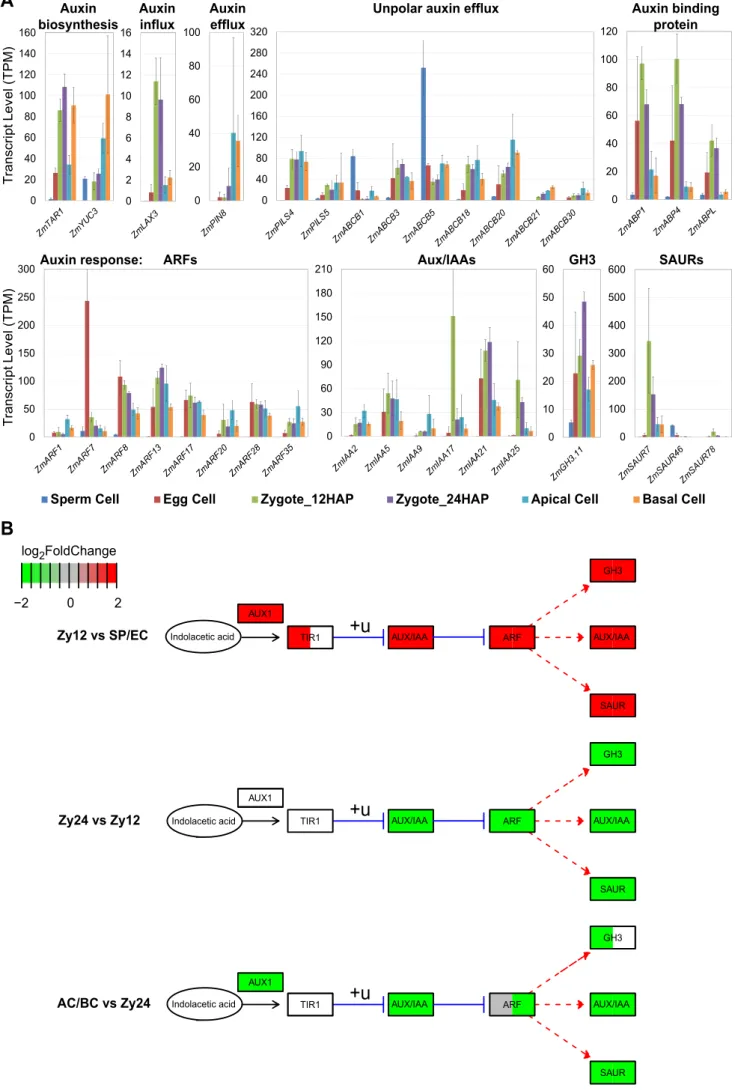
The role of auxin in early embryogenesis in maize 498
To demonstrate the utility of our data sets, we chose the auxin pathway, which plays 499
a key role in early embryo patterning in Arabidopsis, as an example for analysis.
500
Auxin gradients generated by PIN efflux carrier proteins establish the apical-basal 501
axis upon the first ACD in the Arabidopsis zygote (Friml et al., 2003). The molecular 502
mechanisms that determine axis formation during early embryogenesis in monocots 503
are largely unknown. We therefore analyzed the expression of auxin biosynthesis, 504
transport, and response genes, as shown in Figure 7 (Supplemental Data Set 3D;
505
important gene families). In maize, the earliest ZmPIN1a localization was observed 506
at 6 DAP at the adaxial side of the embryo proper (Chen et al., 2014). To identify 507
potential PIN proteins that function at the earliest stage of embryo patterning, we 508
analyzed the expression of all PIN family genes. Among the 15 PIN genes in maize 509
(Yue et al., 2015), only ZmPIN8 was weakly expressed in the zygote and 510
upregulated after ACD in both apical and basal cells (AC/BC vs. Zy12:
511
log2FC=3.8/3.7*). A number of ZmABCBs, representing potential auxin transporter 512
genes (Yue et al., 2015), were also active in maize gametes and/or zygotes. Auxin 513
biosynthesis genes ZmTAR1 (Zy12 vs. SP/EC: log2FC>1.2*) and ZmYUC3 (Zy12 vs.
514
EC: log2FC=9.4*) were significantly induced after fertilization, with higher expression 515
levels in basal cells versus apical cells (ZmTAR1 BC vs. AC:log2FC=1.4*). Auxin 516
receptor genes ZmABP1, ZmABP4, and ZmABPL were also expressed in egg cells 517
(EC vs. SP: log2FC>1.1*) but not in sperm cells and became transiently activated 518
after fertilization (Zy12 vs. SP: log2FC>1.9*, AC/BC vs. Zy24: log2FC< -1.4*). Of the 519
auxin responsive factor (ARF) genes examined, ZmARF7 had the highest 520
expression level in the egg cell and was almost completely switched off after 521
fertilization (EC vs. SP/Zy12/Zy24: log2FC>3.1*, AC/BC vs. EC: log2FC< -4.1*).
522
Other ARF genes, such as ZmARF8, 13, 17, and 28, were expressed at similar 523
levels in all cells except sperm cells. In general, ARF transcript levels were higher in 524
the apical daughter cell of the zygote than in the other daughter cell (Figure 7B:
525
AC/BC vs. Zy24). A few AUX/IAA repressor genes encoding proteins that interact 526
with ARF regulators were activated after fertilization (Figure 7B: Zy12 vs. SP/EC). In 527
particular, ZmIAA17 (Zy12 vs. SP/EC log2FC>4.3) was transiently expressed only 528
shortly after fertilization; ZmIAA17 might be involved in the inactivation of ZmARF17- 529
regulated gene expression patterns. Another highly upregulated gene, ZmSAUR7 530
(Zy12 vs. SP/EC: log2FC> 5.2*, AC/BC vs. Zy12: log2FC< -2.6*), is one of 79 SAUR 531
(SMALL AUXIN UP RNAs) genes in maize, representing the largest family of auxin 532
response genes (Ren and Gray, 2015). Globally, we found that auxin pathway genes 533
were highly induced in the early zygote at 12 HAP and expressed at decreasing 534
levels from 24 HAP zygotes to apical and basal cells (Figure 7B). By contrast, in 535
Arabidopsis, these genes continue to show a strong auxin response, especially in 536
the apical cell after ACD (for review, see Petrášek and Friml, 2009). Moreover, 537
transcripts encoding homologs of key players in auxin-regulated early embryo 538
patterning in Arabidopsis, such as ARF5 (MP), IAA12 (BDL), PIN1, and PIN7, were 539
absent in zygotes and their daughter cells in maize.
540
The observation that gametes and early zygotes are equipped with transcripts 541
encoding proteins for auxin biosynthesis, transport, and perception, as well as the 542
identification of strongly regulated auxin response genes (Supplemental Data Set 543
8), indicates that auxin-regulated early embryo patterning is likely different in maize 544
and other grasses compared to Arabidopsis, providing an entry point for investigating 545
the role of this important hormone during early embryogenesis in grasses. In addition 546
to auxin signaling, we also obtained hints about brassinosteroid and ethylene 547
signaling during early embryo development in maize, which will be investigated in the 548
future.
549 550
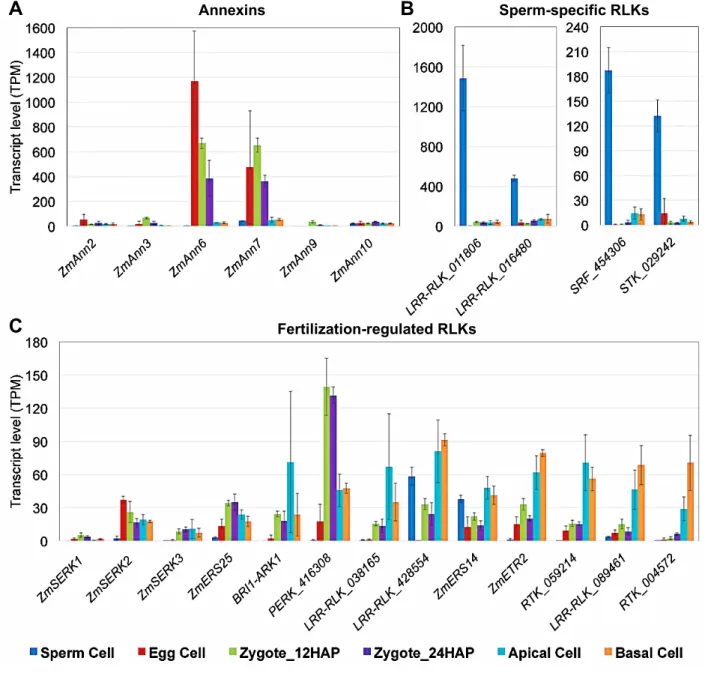
Cell signaling during fertilization and early embryogenesis 551
Ca2+ signaling is thought to play a pivotal role in fertilization by regulating a plethora 552
of cellular processes (Chen et al., 2015). Annexins are a class of Ca2+-regulated 553
proteins that link Ca2+ signaling to membrane and cytoskeleton dynamics (Gerke et 554
al., 2005). Of the 12 genes encoding annexins in maize (Zhang et al., 2015), 555
ZmAnn6 and ZmAnn7 exhibited very high, transient expression in egg cells (EC vs.
556
SP: log2FC=8.5/2.1*, EC vs. Zy12: log2FC=1.1/-*) and early zygotes (AC/BC vs.
557
Zy12: log2FC< -4.1/-3.2*), respectively (Figure 8A, Supplemental Data Set 3C;
558
important gene families). Thus, these proteins might function as key players in intra- 559
and intercellular Ca2+ signaling during fertilization and early embryo development.
560
Signal perception and transduction through cell-surface receptor-like kinases 561
(RLKs) likely play also roles in gamete interaction, fertilization, and early seed 562
development in plants. We detected at least three RLK genes that were preferentially 563
expressed in sperm cells (GRMZM2G011806, GRMZM2G016480, 564
GRMZM2G428554, SP vs. EC/Zy12/Zy24: log2FC>2.3*) (Figure 8B, Supplemental 565
Data Set 3E; important gene families), representing potential players in gamete 566
recognition and/or sperm activation. We did not identify RLK genes that were 567
preferentially expressed in egg cells. In Arabidopsis, SOMATIC EMBRYOGENESIS 568
RECEPTOR KINASE1 (AtSERK1) is expressed in developing ovules and early 569
embryos, and enhances embryonic competence in cell culture (Hecht et al., 2001).
570
While its maize ortholog ZmSERK1 (Salvo et al., 2014) was expressed at very low 571
levels in gametes and zygotes, ZmSERK2 and ZmSERK3 were expressed in 572
zygotes (e.g., ZmSERK3 Zy12 vs. EC: log2FC=3.7*) and daughter cells (Figure 8C), 573
indicating the involvement of similar signaling pathways in embryonic initiation.
574
Moreover, several RLK genes (GRMZM2G038165, GRMZM2G428554, 575
GRMZM2G089461) were upregulated and differentially expressed in apical and 576
basal cells (AC/BC vs. Zy24: log2FC>1.5*), thus representing exciting candidates for 577
future functional studies investigating cellular communication during early embryo 578
development in grasses.
579 580
Conclusions 581
Detailed analysis of global gene expression patterns in plant gametes, zygotes, and 582
manually separated apical and basal cells has allowed the onset of global ZGA in 583
maize to be determined for the first time. The observation that ZGA occurs soon after 584
fertilization, displaying a highly dynamic and partially transient pattern, is surprising 585
and contradicts previous studies using a limited number of genes. These studies 586
indicated that the zygote is in a relatively quiescent transcriptional state, that only a 587
few genes are de novo activated in the zygote, and that ZGA occurs gradually rather 588
than all at once (Baroux and Grossniklaus, 2015; Zhao and Sun, 2015). The striking 589
differences in the expression patterns of cell cycle regulators between sperm and 590
egg cells coincide with a distinct chromatin state in sperm cells and define a 591
quiescent cell cycle state in egg cells, although egg cells appear to be translationally 592
highly active or well prepared to quickly activate the translational machinery after 593
fertilization. The chromatin state in sperm appears to depend on replication- 594
independent histone assembly and the HMG protein ZmHmgd1, which likely keeps 595
the highly condensed sperm cell chromatin at least partially accessible, as 596
demonstrated by the numerous transcribed genes. In addition, our data allowed us to 597
differentiate between the stages during G1-phase that occur in zygotes at 12 HAP, 598
apical cells, and basal cells, and they suggest a preference for certain CDKs and 599
cyclins during the first two cell cycles in plants. Analysis of the expression levels of 600
TFs, structural regulators, and signaling pathway genes allowed us to identify 601
relevant genes homologous to key, well-known Arabidopsis regulators as well as 602
novel candidate genes, which will serve as a starting point for many future studies.
603
In summary, our analyses of the genes described above represent only a few 604
examples of how our comprehensive dataset can be used. This gene expression 605
atlas should further accelerate the identification of key players involved in many 606
biological processes, including fertilization, early embryogenesis, and the cell cycle, 607
as well as the translational machinery. In addition, our data set could be used to 608
uncover genes (and their corresponding promoters) for use in future efforts aimed at 609
increasing seed yield and quality in maize and other crops.
610 611 612
METHODS 613
Plant materials and growth conditions 614
Maize (Zea mays) inbred line B73 was cultivated in a walk-in plant growth room at 615
26°C under illumination of 24,000 lux using alternating SON-T Agro and HPI-T Plus 616
bulbs with a 16 h light/8 h dark cycle and a relative humidity of 60%. Flowers at 617
anthesis and pollinated cobs were used to isolate cells for RNA-Seq.
618 619
Isolation of cells from male and female gametophytes 620
Hundreds of maize plants were grown to collect sufficient numbers of manually 621
isolated cells. Each biological replicate consisted of pooled cells from different 622
plants. Only the middle part of the cob was used for cell isolation from excised 623
ovules. A whole cob was used to isolate cells at a defined developmental stage.
624
Sperm cells were released from maize pollen grains (male gametophytes) by 625
osmotic shock and separated using density gradient centrifugation on a 626
discontinuous Percoll gradient. The detailed protocol is given below. Egg cells were 627
isolated from embryo sacs (female gametophytes) of unpollinated ovules as 628
described (Kranz et al., 1991). Early and late developmental stage zygotes were 629
isolated from ovules at 12 hours after pollination (HAP) and 24 HAP, respectively, as 630
previously described (Cordts et al., 2001). Apical and basal cells were dissected 631
from two-celled proembryos isolated from ovules at between 48-52 HAP following 632
the procedure used for zygotes with some modifications (described in detail below).
633
All cells isolated from ovules were individually collected using a microcapillary and 634
washed twice in mannitol solution (480 mOsmolkg-1 H2O). Cells showing 635
cytoplasmic streaming were individually transferred to 0.5 ml Eppendorf RNA/DNA 636
LoBind microcentrifuge tubes, immediately frozen in liquid nitrogen, and stored at 637
−80°C for mRNA extraction. Three biological replicates (each representing an 638
independent pool of cells) were carried out, each with ~1,000 sperm cells, 20 egg 639
cells, 14 to 15 zygotes at 12 HAP, 16 to 17 zygotes at 24 HAP, 16 apical cells, and 640
13 to 14 basal cells (Table 1). All three biological replicates of each cell type were 641
used for RNA-Seq and subsequent transcriptome analyses.
642 643
Sperm cell isolation 644
Sperm cells were isolated as described (Dupuis et al., 1987) with some 645
modifications. Pollen grains were collected upon shedding, immersed in 550 646
mOsmol∙kg-1 H2O mannitol solution (100 mg pollen/ml solution), and incubated on a 647
platform shaker with slow agitation (80 rpm) for 1 h. The resulting lysate was filtered 648
through a 40 μm cell strainer to remove exines and unruptured pollen grains, 649
resulting in a yellowish filtrate containing sperm cells and starch granules. A Percoll 650
gradient was prepared in a 30 ml COREX tube, consisting of 5 ml 30% (v/v) Percoll 651
in 550 mOsmol∙kg-1 H2O mannitol solution at the bottom, 6 ml 20% (v/v) Percoll in 652
550 mOsmol∙kg-1 H2O mannitol solution in the middle, and 6 ml 15% (v/v) Percoll in 653
550 mOsmol∙kg-1 H2O mannitol solution at the top. Sperm-containing filtrate (10 ml) 654
was layered on top of the Percoll gradient and centrifuged in a swing-out rotor at 655
12,000xg for 1 h at 4°C. After centrifugation, distinct white layers were visible in the 656
15/20% Percoll interphase and the 20/30% Percoll interphase. The 20/30%
657
interphase, which was enriched in sperm cells, was carefully aspirated using a 658
Pasteur pipette and transferred to 15 ml or 50 ml Falcon tubes. At least 10 volumes 659
of fresh 550 mOsmol∙kg-1 H2O mannitol solution were added to the sperm cell- 660
enriched fraction, and the cells were washed by carefully inverting the tube several 661
times. The sperm cells were pelleted by centrifugation at 2,500xg for 15 minutes at 662
4°C and the supernatant was removed without disturbing the pellet, leaving a volume 663
of approximately 50–100 μl. The pellet was resuspended in the remaining 664
supernatant by careful pipetting, resulting in a solution highly enriched in sperm cells.
665
Cell counting was performed using a Neubauer counting chamber. Isolated sperm 666
cells were used immediately or shock-frozen in liquid nitrogen and stored at -80°C.
667 668
Isolation of apical and basal cells 669
To identify the time point of asymmetric cell division (ACD) of the zygote, several 670
cobs were pollinated and analyzed at different intervals after pollination. The first 671
zygotes were analyzed at 24 HAP. Subsequent examinations were performed at 1-h 672
intervals; on average, zygote ACD was observed at ~48 HAP. Apical and basal cells 673
were subsequently separated using cell wall degrading enzyme solution containing 674
1.5% Driselase (Sigma), 1.5% pectinase (Fluka), 0.5% pectolyase Y23 (Karlan), 675
1.0% hemicellulase (Sigma), 1.0% cellulase “Onozuka R10” (Serva), and 1.5%
676
maceroenzyme (Karlan) in mannitol solution (480 mOsmol∙kg-1 H2O). The enzyme 677
solution (100 μl) was combined with 1 ml mannitol solution (480 mOsmol∙kg-1 H2O), 678
and ovary sections containing embryo sacs at 48 HAP were incubated in the diluted 679
enzyme solution for 30 min at room temperature, followed by manual dissection of 680
two-celled proembryos. The attachment between the apical and basal cell 681
protoplasts was gently touched with a very thin glass needle to separate both cells.
682
The cells were washed twice in mannitol solution (480 mOsmol∙kg-1 H2O), collected 683
in 0.5 mL Eppendorf RNA/DNA LoBind microcentrifuge tubes, immediately frozen in 684
liquid nitrogen, and stored at -80°C for mRNA isolation.
685 686
RNA extraction, cDNA preparation and purification 687
The mRNA was extracted from cell samples using a Dynabeads mRNA DIRECT 688
Micro Kit (Life Technologies). A SMARTer Ultra Low RNA Kit for Illumina 689
Sequencing (Clontech Laboratories) was used to generate first-strand cDNA.
690
Double-stranded cDNA was amplified by LD PCR (15 cycles) and purified via 691
magnetic bead cleanup using an Agencourt AMPure PCR Purification Kit (Beckman 692
Coulter). The quality of the purified cDNA was measured using an Agilent 2100 693
Bioanalyzer with an Agilent High Sensitivity DNA Kit (Agilent Technologies), frozen in 694
liquid nitrogen, and stored at −80°C.
695 696
Library construction and Illumina sequencing 697
Library preparation was carried out as described in the Adapted Nextera Sample 698
Preparation protocol (Clontech Laboratories) for use with the SMARTer Ultra Low 699
RNA Kit for Illumina Sequencing. Input cDNA (5 ng) was tagmented (tagged and 700
fragmented) via the Nextera transposome. The products were purified and amplified 701
via a limited-cycle PCR program to generate multiplexed sequencing libraries. The 702
libraries were quantified using a KAPA SYBR FAST ABI Prism Library Quantification 703
Kit (Kapa Biosystems). Equimolar amounts of each library were pooled and used for 704
cluster generation on the cBot system with Illumina TruSeq PE Cluster v3 and 705
Illumina TruSeq Dual Index Sequencing Primer paired end kits. Sequencing runs 706
were performed on a HiSeq 1000 instrument using the dual indexed 2 x 100 cycles 707
paired end (PE) protocol and TruSeq SBS v3 reagents according to the Illumina 708
HiSeq 1000 System User Guide. Image analysis and base calling resulted in .bcl 709
files, which were converted into .fastq files with CASAVA1.8.2 software. Library 710
preparation and Illumina sequencing runs were performed at the Genomics Core 711
Facility “KFB - Center for Fluorescent Bioanalytics” (www.kfb-regensburg.de). The 712
raw data (.fastq) plus supplemental tables, including count and TPM data for all 713
replicates was uploaded to GEO and is available under accession number 714
GSE98379.
715 716
Bioinformatic and statistical analyses 717
(I) Quality control and alignment: The quality of sequencing data from the RNA-Seq 718
libraries was assessed with FASTQC
719
(http://www.bioinformatics.babraham.ac.uk/projects/fastqc/). Primer contamination 720
from the SMARTer Ultra Low RNA Kit was removed with cutadapt (ver.1.13; Martin, 721
2011). Size and quality trimming were then performed using Trimmomatic (ver. 0.32 722
(Am et al., 2014), ILLUMINACLIP: NexteraPE-PE_SMARTer.fa:2:30:10:2:true 723
TRAILING:26 LEADING:26 MINLEN:25). The results from trimming are summarized 724
in Supplemental Table 1 (mapping information). Trimmed reads were aligned to the 725
maize genome (AGPv3, INSEC Assembly GCA_000005005.5, release 23, 726
ftp://ftp.ensemblgenomes.org/pub/plants/). STAR (Dobin et al., 2013) was used to 727
align the mRNA reads. Alignment statistics are summarized in Supplemental Table 728
1. Duplicate reads were identified with picard MarkDuplicates 729
(http://broadinstitute.github.io/picard). The remaining reads were then assessed on 730
the gene level using featureCounts from the Rsubread R-library (Liao et al., 2014) 731
using the annotation information supplied by Gramene, release 5b+, 732
(http://ftp.gramene.org/maizesequence.org/release5b+/zea_mays.protein_coding.gff) 733
. Gene annotation and ortholog information was retrieved from EnsemblPlants 734
(www.plants.ensembl.org) via Biomart (BiomaRt7, release 29, Z. mays genes 735
(AGPv3 (5b)), A. thaliana genes (2010-09-TAIR10) and O. sativa japonica genes 736
(IRGSP-1.0), restricting the gene model to AGPv3 (5b) from EnsemblPlants.
737
(II) Measurement of mRNA transcript abundance: Transcripts per million (TPM) was 738
used as a measure of mRNA abundance, which takes into account the length of the 739
RNA transcripts and the sequencing depth (Wagner et al., 2012). Gene length was 740
approximated by determining the sum of the exon lengths of the gene model. The 741
TPMs were calculated for each gene in each sample. The median TPM value was 742
calculated from three biological replicates for each cell type. An annotated list of 743
genes with their expression levels at each developmental stage (cell type) and 744
orthologs (based on Ensembl Compara from A. thaliana and O. sativa) was 745
assembled (Supplemental Data Set 1).
746
(III) Differential expression analysis and Venn diagrams: Count data at the 747
gene level were analyzed with DESeq2 (Love et al., 2014). All 15 cell-type-to-cell- 748
type comparisons were performed and corrected for multiple testing over all genes 749
and cell type comparisons using FDR (Benjamini and Hochberg, 1995) 750
(Supplemental Data Set 2). Genes with a log2FoldChange>1 and FDR <0.05 (“padj”
751
in supplemental tables) were considered significant differentially expressed, and 752
Venn diagrams (R-library: vennerable; https://r-forge.r- 753
project.org/projects/vennerable) were generated for certain comparisons (Figure 4).
754 755