SOME RECENT ASPECTS IN THE STRUCTURE ELUCIDATION OF NATURAL PRODUCTSt
WOLFGANG VOELTER
Chemisches Institut der Universität, D-74 Tübingen, Auf der Morgenstelle, Federal Republic of Germany Abstract-Although in the past 20 yr a large number of new synthetic approaches have been developed methods of isolation and structural elucidation have changed more dramatically in the last two decades than have those of synthesis. For the purification of natural products more and more different Chromatographie techniques like paper, thin-layer, column, and gas-liquid chromatography are being used. Characterizations of natural products by eiemental analysis, melting points, optical rotation values, and degradation and derivatization reactions are being increasingly supported by parameters of spectroscopic tools like proton nudear magnetic resonance, carbon nuclear magnetic resonance, phosphorus nuclear magnetic resonance, fluorine nuclear magnetic resonance, infrared spectroscopy, Raman spectroscopy, absorption spectroscopy, optical rotatory dispersion, circular dichroism, magnetic circular dichroism and computer analysis.
The principle of one of the most eflicient methods for the structural elucidation of natural products, pulse Fourier transform "C NMR spectroscopy, is discussed in detail. The usefulness of this method is demonstrated using examples from the peptide, carbohydrate and terpenoid field. The structural elucidations by the application of different physicochemical tools for the three following most recently isolated natural products are given: Hypothalamus- releasing hormones, terpenoids from Me/ia azadirachta Linn., and substances, isolated from urines of sick children.
Natural product's chemistry can be divided into three different fields: methods of isolation, methods of structure elucidation and synthetic approaches.
Though in the last two decades numerous new types of chemical reactions have been found the methods of isolation and structure elucidation have changed more fundamentally than those of synthesis.
For the isolation and purification of organic compounds the different methods of chromatography (paper, 1- 3 thin- layer .~ column,'-9 and gas chromatography, 1o.-12 have been developed.
One of the most recent and fruitful developments in the field of chromatography, which surely will find great applicability for the separation of natural products, is that of highperformanceliquid chromatography. Some exam- ples, mainly investigated in our laboratory, are given below.
If a natural produ~t's ehernist is convinced that he has isolated a compound of high purity he can begin with its structure elucidation. Only two decades ago this work was mainly based on chemical reactions like those of degrada- tion and derivatization.
Only fewphysico-chemical parameters were available at that time characterizing organic molecules: melting points, solubilities, values of eiemental analysis, molecular weights, or specific rotations. Since then different physico- chemical instruments like those of absorption spectros- copy (ABS), optical rotatory dispersion (ORD), circular dichroism (CD), mass spectrometry (MS), and nuclear magnetic resonance (NMR) were developed which allow recording of spectra routinely and thus the basis of correlation between spectral characteristics and structure for organic molecules was laid. The enormous amount of data accumulated in the last years in the ABS, ORD, CD, MS and NMR laboratories will force us in future time to lookfor ways of storing these parameters on computer files.
In the following the principal fundamental newer developments in some of these fields are discussed an(
tCommunication 120 about structures of natural products and organic molecules.
PAC, Vo1. 48, No. 1-H
finally some practical examples investigated in our laboratory are given.
2. IDGH PERFORMANCE LIQUID CHROMATOGRAPHY13•14
The isolation of a natural product can be considered already as part of its structure elucidation and therefore it is a necessity for a natural product's ehernist to know about the theory, the Iimits and applicability of the different Chromatographie methods.
As already mentioned before, high performance liquid chromatography seems to have become the most effi.cient and suitable method for the separation of complex· mixtures of natural products. This idea caused us to develop a system for the separation of carbohydrates respectively amino acids and peptides, as our research group works on the synthesis of peptides and carbohydrates.
(a) Principle of a high resolution carbohydrate analyzer More than 20 yr ago the first column chromatographic separations of carbohydrates were reported. Since then three different principles were applied:
1. adsorption chromatography15- 17
2. partition chromatography18-20 and 3. ion exchange chromatography.21- 24
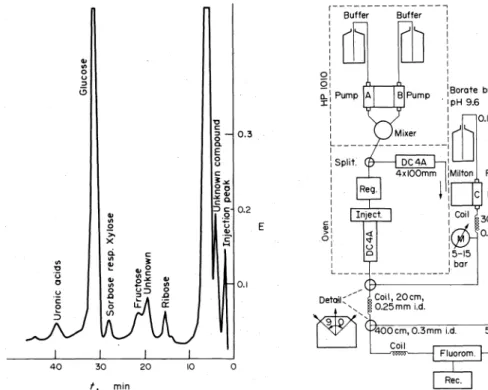
The effi.ciency of the latter method prompted us to construct an apparatus (Fig. 1) applying this principle.
Borate complexes of carbohydrates specifically interact with anion exchangeresins and are therefore separable on columns filled with this material.26
A Milton Roy-Dosapro micro pump pumps borate buffer from a gradient-generating system (Grad., Fig. 1) respectively borate buffer reservoirs (A, B, Fig. 1) via a prewashing column on a Biotronik (Frankfurt, Germany) glass-jacketed high pressure liquid chromatographic column, filled with an anion-exchange DA-X 4 resin from Durrum Chemical Corporation, Palo Alto, U .S.A. The DA-X 4 resins are 4% cross-linked polystyrenes of 10-20 f.LID particle size. To the effiuent of the column orcinol sulfuric acid reagent is added and the mixture passes a 20m x 0.7 mm Teflon coil which is placed in a heated (98-100°C) water bath. Under these conditions 105
106 WOLFGANG VOELTER Grad. A B
Photom.
Recorder (418 nm) Outflow
Fig. l. Flow scbeme of a carbobydrate analyzer. Grad.: Gradient generator; A, B: bufl'er reservoirs; Reg.: regenerating bufl'er reservoir. 25 Borate complexes of carbobydrates specifi.cally interact with anion exchangeresins and are therefore separable on
columns filled with this material. 26 ·
sugars from furan derivatives which react with orcinol
give a red-yellow dye which has an absorption maximum at A =420nm:
HO-CH~CH-üH
I I
9-o9H2 rH-C."_
OH OH H
(Pentose)
.. "'
.2
.Q
~
..
c:Cl
0- 0 c,
9-0H (Furfural)
..
.,
>. 0 X
.. ..
"'
"'0 0
u c:
" :s
Ci
e
<[
A Biotronik BT 6620 spectrophotometer with an interference filter at 420 nm is used for -photometric detection (path length of the optical cell: 1 cm; extinction ranges 0.1, 0.2, 0.5, 1.0 and 2.0 AU).
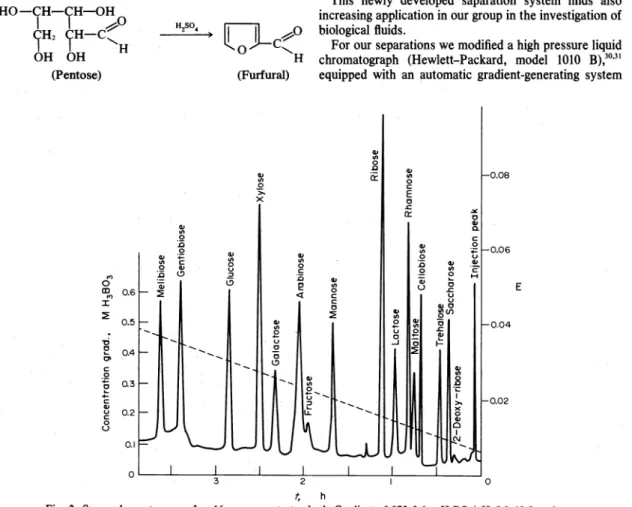
A typical sugar chromatogram of a
16component standard using a DA-X
4F resin
(11 ± 1 ".mparticle size) is shown in Fig. 2.
The peaks in Fig.
2were assigned by single component runs.
The sugar separation system will find valuable applica- tion for the iD.vestigation of body ftuids as is demonstrated by Fig. 3.
(b) High pressure liquid chromatographic analysis of amino acids and peptides
·
The synthesis of hypothalamus peptide hormones makes the separation of amino acid hydrolysates and peptides a day to day task in our laboratory.
27As most of our synthetic compounds are tested biologically the highest achievable purity of the peptides is a necessity for us.
Italso becomes obvious that one of the more recently developed synthetic methods, the solid phase peptide synthesis
28 ,will be an alternative to the classical methods only
ifthe desired reaction product is separable from the products of failed and truncated sequences.
Products of failed sequences occur in minor quantities only in the reaction product of a solid phase peptide synthesis. We were therefore forced to develop a more sensitive detection system for amino acids and peptides than that of Spackman, Stein and Moore.
29This newly developed saparation system finds also increasing application in our group in the investigation of biological ftuids.
For our separations we modified a high pressure liquid chromatograph (Hewlett-Packard, model 1010 B),
30,31equipped with
anautomatic gradient-generating system
..
.,
.Q 0
..
0:
.,
0.080 c:
E .c 0
a::
..
0.06"'
:0 .Q 0
.. "'
..
iie
"' u 0 E
0 .c
c: u
c: u
0 ~ 5j0
:::!! 0(/)
0
..
ö 0.04....
"' .c
u ~
.3
0 ~0.02
o~--~----~----~--~2~~~~--~----~----~
t, h
Fig. 2. Sugar chromatogram of a 16 component standard. Gradient: 0.075-0.6M H,BO,/pH 8.0-10.5; column:
0~6 x 19 cm; resin: DA-X 4F; column temperature: 60"C; ftow rate: 1 ml/min; eacb peak represents 16 n Mol/monosaccharide and 8 nMol/disaccharide (!l.2.l4-2.88 p,g per component).25
.. '2
..
u 0
.. ..
0 u ::J
i3
.. ..
0 E
>.
X ci oll
~
0.1
f, min
Fig. 3. Human cerebrospinal fluid carbohydrate chromatogram.
Sample: 100
111·
of ultrafiltrated human cerebraspinal fluid; one buffer elution: 0.4 M H,BO,, pH 9.0; collumrt: 0.4x cm; resin:DA-X 4F, 11 ± 1 ,an; column temperature: 60"C; flow rate:
0. 7 ml/min."
and use ion-exchange resins of the particle size 8 ± 2 JLffi and ftuorescamine3z...34 (4-phenylspiro[furan-2(3H), 1'- phthalim]-3,3'-dione). Fluorescarnine is a non-ftuorescent compound which reacts in milliseconds with primary amines at room temperature and pH 9-10 to a ftuorimetri- cally detectable ftuorophor. Excess reagent is hydrolyzed
to
non-ftuorescent compounds: 0+ R-NH2
Fluorescamine
Figure 4 shows the functional diagram of the arnino acid analyzer.
The gradient is generated with two citrate buffer solutions of pH 2.6 (0.2 N in sodium) and 6.3 (1.2 N in sodium). The gradient-generating systemof the HP 1010 B apparatus allows· to achieve constant ftow rates of 0.05 ml/min only if the buffer mixture is pumped to a splitting system which is connected with a stainless steel separation column (250 x 3 mm) and a reference colurnn (100 x 4 mm). Both colurnns are filled with strongly acid 4% cross-linked polystyrene divinylbenzene ocation- exchange resin of 8 ± 2 JLffi particle size (DC-4 A, Durrum, Palo Alto, U.S.A.). 0 To ensure rapid reaction with ftuorescamine 0.16 M borate buffer of p:a 9.6 is p1,1mped (Dosapro micro-pump, Milton Roy, Philadelphia, U.S.A.) via a coil of 3 m length and 0.25 mm intemal diameter to
Fluorescamine 15-30mg/ IOOml
m
AcetoneWllJ50%
H2S04Lab tron
Fig. 4. Functional diagram of the automatic amino acid anal- yzer."
the colurnn effiuent. The ftuorescarnine solution (0.01- 0.025%) in absolute acetone is then admitted by a Labotron pump to the now alkaHne colurnn effiuent. The mixture of colurnn effiuent, borate buffer and ftuores- carnine acetone solution passes a reaction coil of 4 m length and 0.3 mm intemal diarneter and is detected with a Hewlett-Packard 1033 A ftuorimeter equipped with a 10
,.,.I.
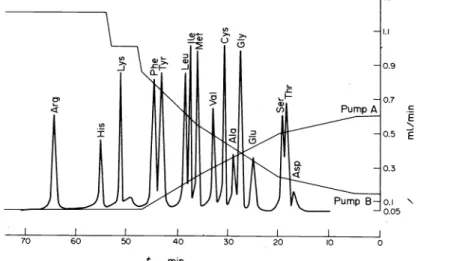
ftow-through cell.Figure 5 shows a typical chromatogram of a 16
100-500 msec
Fluorphor Non-ftuorescent hydrolysis product
component amino acid mixture with diagrams of the bufferftow rates through pump A and B. The overall ftow rate starts with 0.75 and ends at 1.25 ml/min.
To test our system and compare it with conventional apparatus a solid phase 0 synthesized hexapeptide arnide with natural sequence parts of physalaemin (H-Asn-Lys- Phe-Tyr-Gly~Met-NH2) was hydrolyzed with 6 N HCl and analyzed with a Deckman Unichrom arnino acid analyzer (using ninhydrin as detection reagent) and our developed imalyzer. Figures
6a
and b show the result.The comparison of the two chromatograrns shows that, compared to conventional methods, high pressure liquid chromatography in combination with the application of ftuorescamine and ion~exchange oresins of small particle size improves the sensitivity by a factor of 100-1000 and shortens the Separation time by a factor of 3-4.
108 VVOLFGANG VOELTER
1.3
Cl) 1.1
>- >- u Ci
.l:
"'
~f-- 0.7~ cn
...
<:.E
" "E '
<i
0.1 "
0.05
70 20 10 0
t, min
Fig. 5. Highpressure liquid chromatogram of a 16 component amino acid mixture with flow-rate diagrams of pumps A and B. Experimental conditions see text."
<I
<:
0
i ...
~
<(Asp
40
<J
~
~r
~ g
;;:
Gly
75
t,
Gly
Asp
10
min (a)
Met Tyr
20 t, min
(b)
Met
120
Lys
Phe
30 Tyr
Phe
40
Lys
157
Fig. 6. Chromatograms of a hydrolyzed hexapeptide amide with natural sequence parts of physalaemin. (A) Injection of 100 nm of the hydrolyzed hexapeptide amide in a Beckman Unichrom amino acid analyzer using ninhydrin for detection. (B) lnjection of 500 pm of the same solution as in A into the high pressure liquid chromatograph using
ftuorescamine for detection.
3. MASS SPECTROMETRY
Without any doubt mass spectrometry has become one of the most valuable and efficient tools in the structure elucidation of natural products and an enormous !imount of work has been published in the past which is surveyed in a
series of excellent monographs.35-39 Mass spectra can be recorded from very low sample quantities (10-6-10-
10g) and a great deal of structural information is received from them.3S-39
Sufficient volatility of a compound, however, is neces-
Some recent aspects in the structure elucidation of natural products
sary if the most common method, the electron bombard-
ment mass spectrometry, is applied. Polar functional groups and high molecular weights of natural products often prevent recording their mass spectra with this method. The volatility, however, can be often enlarged by simple chemical modifications of the polar groups like methylation, trimethylsilylation or triftuoroacetylation.
In connection with our work on hypothalamus-releasing hormones
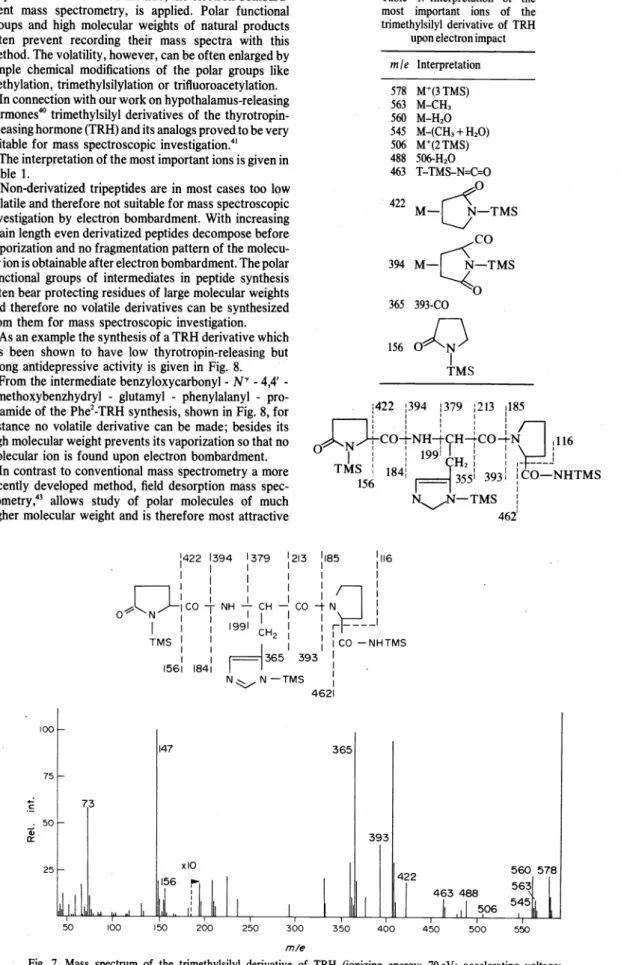
40trimethylsilyl derivatives of the thyrotropin- releasing hormone (TRH) and its analogs proved tobe very suitable for mass spectroscopic investigation.41
The interpretation of the most important ions is given in Table
1.Non-derivatized tripeptides are in most cases too low volatile and therefore not suitable for mass spectroscopic investigation by electron bombardment. With increasing chain length even derivatized peptides decompose before vaporization and no fragmentation pattern of the molecu- lar ion is obtainable after electron bombardment. The polar functional groups of intermediates in peptide synthesis often bear protecting residues of large molecular weights and therefore no volatile derivatives can be synthesized from them for mass spectroscopic investigation.
As an example the synthesis of a TRH derivative which has been shown to have low thyrotropin-releasing but strong antidepressive activity is given in Fig. 8.
Table 1. Interpretation of the most important ions of the trimethylsilyl derivative of TRH
upon electron impact m I e Interpretation 578
563 560 545 506 488 463 . 422
394
M+(3TMS) M-CH, M-H20 M-(CH, + H20) M+(2TMS) 506-H20 T-TMS-N=C=O
0 M-U-TMS
CO
M-e1-TMS
0 365 393-CO
156
oJ:)
TMS
I
. :422 :394 1379 :213 t185
a • 1 :
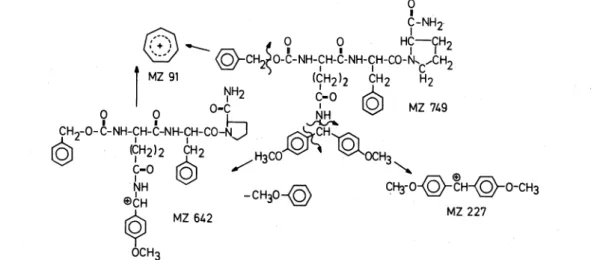
I I I I ~I 1 I I IFrom the intermediate benzyloxycarbonyl -
NY -4,4' - dimethoxybenzhydryl - glutamyl - phenylalanyl - pro- linamide of the Phe
2-TRH synthesis, shown in Fig. 8, for instance no volatile derivative can be made; besides its high molecular weight prevents its vaporization so that no molecular ion is found upon electron bombardment.
In contrast to conventional mass spectrometry a more recently developed method, field desorption mass spec- trometry,43 allows study of polar molecules of much higher molecular weight and is therefore most attractive
N I co:NH-tC:H-rco-rNg 1116
0
I
I I 1991I I
I II I ~H2 I I 1- ---.!
TMS
!
1841 3551 393I l
CO-NHTMS156 - -
I
100
75
.... 73
·=
50...
Q::25
50
1422 1394 1379 1213 1185 1116
I 1 1 I I I
~0-~CO ~
NHl
CHj
COJN~ l
0 N I I I I I I
I
1 I 1991 CH2 I I 1 r - - - -I 1TMS I I I 1 I CO - NH TMS
I I~ I
1 1 - - 365 393 I
1561 1841
I
N~N-TMS 1 4621
147 365
393
100 150 200 250 300 350 400
m/e
N~N-TMS
!
4621
560 578
450 500 550
Fig. 7. Mass spectrum of the trimethylsilyl derivative of TRH (ionizing energy: 70eV; accelerating voltage:
3.5 kV).41
WOLFGANG VOELTER
L-Pro
-L---4---~NH2
CF3COOH /anisole Pyr- Phe -Pro- NH2
Fig. 8. Synthesis of pyroglutamyl-phenylalanyl-prolinamide. (L- Gin; L-glutamine; L-Phe: L-phenylalanine; L-Pro: L-proline; Z:
benzyloxycarbonyl; Mbh: dimethoxybeilzhydryl; Me: methyl;
DCC: dicyclohexylcarbodümide; Pyr: pyroglutamic acid).42
for natural product chemistry. The next two figures (Figs.
9 and
10)show two examples which could not be investi- gated by conventional electron bombardment but by-field desorption mass spectrometry.
4. NUCLEAR MAGNETIC ~NANCE
Without any doubt besides mass spectrometry nuclear magnetic resonance spectroscopy gives the mostvaluable information about the structure of a natural product.
The Larmor frequency of a nucleus with a magnetic moment depends characteristically on the chemical environment of the nucleus and is expressed in terms of
64
129
70
its chemical shift
8 :8 =Äv
·Hf
V
Äv[Hz]: frequency difference between standard signal and compound signal
v[MIU: = Hf Hz]: frequency used.
Only nuclei having a magnetic moment are investigated by nuclear magnetic resonance spectroscopy._ Very important isotopes of organic chemistry, like
160 or
12C have no magnetic moment and therefore cannot be investigated with nuclear magnetic resonance spectro- scopy.
1H,
13C,
14N and
31P are therefore the most important nuclei in natural product's chemistry investigated by
·NMR.
51""'"'Most knowledge is available in the field of proton nuclear magnetic resonance; a series of monographs covers
thisarea.4S--
50One of the most recent and most exciting developments in the field of NMR is that of the pulse Fourier transform
13
C NMR spectroscopy which allows routine measurement of carbon-13 spectra.
51""'"'Nuclei possessing an angular momentum may undergo nuclear magnetic resonance in a static magnetic field Ho.
Po, the component of p
in the direction of Ho is related to the spin quantum number
(m ):m
·hpo=~; m =±n1/2; 0,1,2 (1)
m=I, I-1, ...
,-I.234
(MHf!l 363
300 320 340 360 380
mle
Fig. 9. Fielddesorptionmass specnvmofTRH (L- pyroglutamyl-L-histidyl-L-prolinamide, (2i mA, H.0)).44
60 80 100
mle
Fig. 10. Field desorption mass spectrum of Z-Gin(Mbh)-Phe-Pro-NHz (17 mA).44
Fig. 11. Fragmentation pattem of the-field desorption mass spectrum of Z-Gin(Mbh)-Phe-Pro-NH,.44 (I:
total spin quantum number)
Nuclei with a magnetic moment
p.interact with magnetic fields:
(2)
For nuclei with
I= 1/2 the distribution of the spin populations
(N+IN-)may be expressed:
N +
=
e-<Bikt>"" 1+
t..E=
1+
2p.oHoN- kT kT . (10)
( 'Y:
gyromagnetic ratio)
From eqns 1 and 2 follows: After resonance the nuclear spins relax from the upper Ievel totheequilibrium with their surroundings ('lattice')ina (3) · time called spin-lattice relaxationtime T
1(10--4-10"sec) and
according to the Reisenberg equation
(p.o:component of
p.in the direction of
Ho)The energy
Eof a magnetic moment
p.in a field
Hofollows from eqn 4:
E
=
~ILoHo=
-y 2h 1T !Ho. (4)In a magnetic field for a nucleus with the total spin quantum number
I, (21+ 1) energy Ievels are possible. For the important nuclei of natural products
1H,
13C and
31P
Iis 1/2 and therefore two energy Ievels, symbolized with
E+l12and K,
12are possible
(11)
(12) The life-times of spin states may be further shortened by dipoltKtipole interactions and exchange of energy quanta
(t..E = 2p.oHo;spin-spin relaxation time T2):
t..v,12
= const.
T1 2• (13)The contribution of the field inhomogeneity to
t..v,/2(5) follows from eqn 14:
As
E-112
=
p.oHo=
y - Ho h41T
E=h·vo,
(6)
(8)
the Larmor precession frequency
v0for nuclei with
I= 1/2 follows for eqn 9:
vo=
2:
Ho. (9)For a field strength of 21.3 kG the Larmor frequency for
13
C nuclei is in the range between 22-23 MHz.
To observe NMR signals a sample is placed in a static magnetic field
Hoand is irradiated with an altemating field
H,with the radio-frequency
v,(frequency sweep).
If v,becomes equal to the Larmor frequency of the sample nuclei an absorption signal is registered by the recorder.
yAHo yt..Ho
t..v112 =~
= const. - 2-. (14)
Ifa sample of identical nuclei with
I=
(1/2)is brought into a magnetic field
Hoa net macroscopic magnetization Mo along the z axis arises.
Ifperpendicular to
Hoa radiofrequency field with a proper frequency
v,is applied the resultant magnetization vector
Mis now composed of three components along the axes
x, yand z:
M =
m,i
+M,j +M.k M,k:longitudinal magnetization
M,.i, M,j:transverse magnetization.
(15)
The magnetization vector components are related with the longitudinalrelaxationtime
T, andthe spin-spin relaxa- tion time T2 by the following equations:
dM, M,-Mo
dt=--T-,-
(16)112 WOLFGANG VOELTER
(17) (18)
signals are also obtained irradiating with short radiofre- quency pulses
AH1
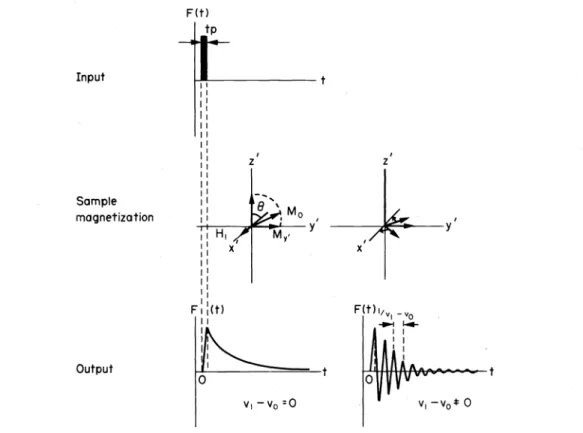
(Fig. 12).After excitation the transverse magnetization M.Y decays exponentially with the transverse magnetization time Tz (free induction decay). Immediately after the resonance the interference of
H1
and Mxy is a beat decreasing exponentially with Tz. Thesebeat interferenceIf the radiofrequency pulse covers all the 13C Larmor frequencies of the irradiated probe the result is a pulse interferogram which contains all the information of a frequency or field sweep NMR spectrum (Fig. 13) and, like any complex wave function, can be converted by a Fourier transformation55 into a spectrum of Larmor frequencies.
Pulse Fourier NMR spectrometry is the most powerful method up to date; increasing the sensitivity of an NMR
Input
Sampie magnetization
Output
F(tl tp
~---t
z
Iz
IF(t)l1v1-v0
--
1 I I ' -I I II
Fig. 12. Free induction decay. Input: Radiofrequency pulse as input signal; sample magnetization: During the radiofrequency pulse (left), free induction decay following the radiofrequency pulse (right) output: Output signal at
resonance (left), output signal for oll -resonance (right). ••
(o)
(b) aMy•
•
(TMS=O) 95.7ppm
0.4sec - - - ;1- - - - . , ;
--= :--
!Sv ::
a
H~~Ho\13
/3D~H
HO91.85ppm 0
:---~---J'--J~---~---~... V
~~---1250Hz
Fig. 13(a). Pulse interferogram of mutarotated 1-"C-glucose (60% "C). 22.63 MHz, 50 mg/ml 020, proton decoupled, temperatufe: 3o•c, accumulation of 32 scans, pulse width: 12 p.sec, pulse interval: 0.4 sec. (b). Fourier
transform of 13a."
spectrometer for two reasons:
(1) A sufficiently large radiofrequency pulse is practi- cally equivalent to an irradiation from a multichannel transmitter and the signal (S): noise (N) ratio increases with the number of channels applied:56
(19) (2) If the pulse interferograms are accumulated by an averaging computer the S : N ratio improves with increasing number (n) of accumulations:
(20) The 13C-1H couplings are in the range of 100-250 Hz.
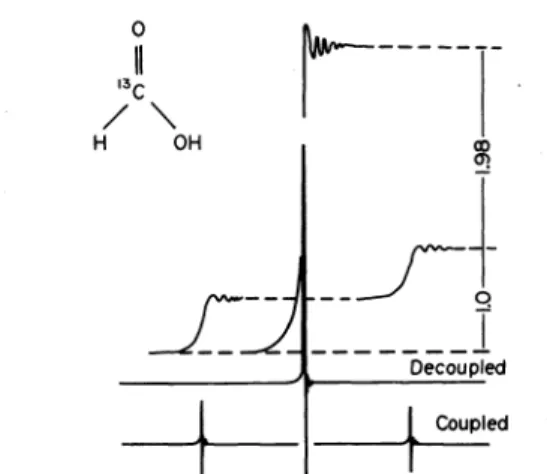
Overlapping 13C-1H multiplets rnake the interpretation of complex 13C NMR spectra difficult. However, if the 13C sample is stimulated by the 13C radiofrequency pulse and additionally irradiated with a field covering all the Larmor frequencies of the protons the 13C-1H multiplets collapse to singlets. Proton broad band decoupling besides increases the S : N ratio by the nuclear Overhauser effect57 which is based on changes of the natural population of the 1H spin Ievels. This effect is demon- strated by Fig. 14 for the 13C NMR spectra of 13C-enriched formic acid.58
0
'3c II
/"-
H OH
r----T
_rl m.
L-- --~---1
Decoupledt t
CoupledFig. 14. Coupled and proton broad band decoupled "C NMR spectrum of formic acid for the demonstration of the nuclear
Overhausereffect.'"
sp2 X=(
);=C:c
;c=(x ,..c=C::H
Though proton broad-band decoupling reduces the complexity of 13C NMR spectra a Iot of information is lost which could be deduced from 13C-1H couplings.
A valuable aid in the signal assignment of 13C spectra is received from proton off-resonance recording: Besides the radiofrequency pulse, exciting the 13C nuclei, the probe is irradiated with a second frequency which is several hundred Hz apart from the Larmor frequency of the protons. Under these conditions vicinal and long- range couplings collapse and a spectrum of multiplets of first order is observed.
(a) 13
C NMR spectra of terpenes and steroids
51.s2•54The 13C chemical shifts of organic molecules are spread over a range of 200 ppm. With increasing number of hydrogen atoms attached to carbon atoms of hydrocar- bons the 13C signal shifts generally to higher field.
Electron-withdrawing functional groups or heteroatoms cause downfield shifts especially on the resonances of neighbouring carbon atoms. 13C chemical shift ranges of the main types of carbon nuclei are surveyed in Fig. 15.
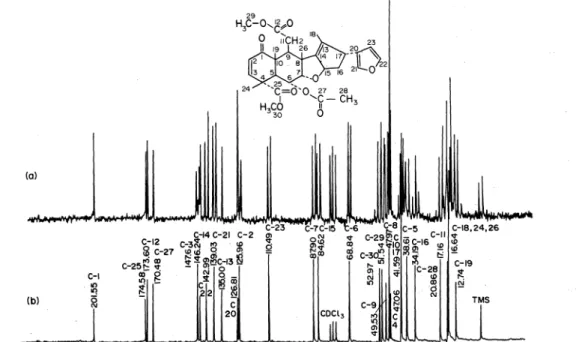
As a demonstrating example for a 13C NMR spectrum of higher molecular weight terpenes and steroids that of nimbin is given (Fig. 16).
The signal assignments are done on the following basis:
(1) application of general chemical shift rules (see Fig.
15),
(2) determination of the number of hydrogen atoms attached to each carbon atom by proton off -resonance spectroscopy,
(3) spectral comparison with sirnilar and partial struc- tures.
(b) 13C NMR spectra of carbohydrates and nuc- leosides 51 "52.s4
Polyols are reduction products of carbohydrates and often used for identifi.cation of the parent compound.
The 13C NMR spectra of polyols are much more easy to interpret than those of their corresponding sugars because they can not undergo mutarotation.
Figure 17 shows the 13C NMR spectrum of ribitol.
At highest field of Fig. 17 the signal of the primary carbons is found, at lower field the resonances of the secondary carbons 2, 3, 4 are expected. The carbon atoms 2 and 4 are magnetically equivalent and must cause the signal at 75.3 ppm with almost double intensity compared to the signal at somewhat lower field. Therefore the resonance at lowest field is assigned to C-3.
The following 13C chemical shift (ll, ppm, relative to
sp
I
x=c- -c=cc -c=cx -c=cHI
250 200 150 100
ppm
.. cx ...
50 0
TMS I
Fig. 15. "C-chemical shift ranges of different kinds of carbon atomsrelative to TMS = 0.
114 WoLFGANG VoELTBR
2h
23~,l 0 h2
(al
(b)
C-1
~
-6 C-8 C-5 C-18, 24,26
v c-29Sjc - c-11 v
CD v la"lC-16 ID ~
aj C-3~ 17:1!~ 1;1
~"in ~ "'t-28 C-19
NIO·V !&!~
Cl ~
N
C-7C-15
~~ "'"'
C-9 TMS COCl3
Fig. 16. 22.63 MHz PFf "C {'H} NMR spectra of nimbin, 350 mg/1.5 ml CDCb, temperature: 3o•c, pulse width:
10 p. sec, pulse interval: 0.4 sec/4k interferogram; phase corrected. (a) proton .off-resonance decoup1ed; 9550 accumulated interferograms; (b) proton broad band decoupled; 1600 accumulated interferograms.
CH20H I 2 CHOH
I
C-2,C-4 C-I,C-5 3 CHOH
I
C-3
75.6;75.3. 65.5
4 CHOH I 5 CH20H
8,
ppmFig. 17. 22.63 MHz PFf "C{'H} NMR spectrum of ribitol, 20% in
0.0,
temperature: 30"C, pulse width: 10 p.sec, pulse interval: 0.4 sec/4 K interferogram, ppm values are given relative to TMS = 0.TMS=O) rules can be applied for the signal assignments of carbohydrates:
(a) The anomeric carbon atom is the only one which is attached to two electron withdrawing oxygen atoms and therefore resonates at lowest field (90-98 ppm).
(b)
The signals of CH2-groups (CH:z-OH residues of hexoses or
ringCH2-groups of pentoses) generally occur at highest field in the
13C NMR spectrum of a free monosaccharide.
(c) The ppm range of ring carbons bearing hydroxyl groups is in the range of 65-76 ppm.
(d) Generally in pyranose molecules equatorial hyd- roxyl groups cause, compared to axial ones, an electron withdrawing effect on the attached carbon atom. The
13C shifts of the anomeric carbon atoms of the pair
a-and ß- D-mannose are exceptions for this rule and the excep-
tional
b~haviorcan be explained on the basis of the Reeves effect.
(e) 1.3-Diaxial interaction causes the resonance of a carbon atom in
'Yposition of an axial substituent to resonate at higher field.
(f) The signals of carbon atoms of anomers can easily be assigned comparing the
13C spectra of a carbohydrate solution before and after mutarotational equilibrium is achieved.
The above made statements (a-f) are demonstrated by Fig. 18 showing the
13C NMR spectra of D-glucose before and after mutarotational equilibrium has adjusted.
As an example for an enzyme cofactor and a micleoside the
13C NMR spectrum of riboftavin is discussed (Fig, 19).
Application of generat chemical shift rules, spectral
comparison with similar compounds and proton o:II-
(c:)
(b)
(Q)
I 100
lß Ia
Ia
90
a
4a,ß 3~ß 5,3a
2ß 2a
5,3 a 2a 4a
80 70
ll, ppm
6ß
Ga
60
Fig. 18~ PFf "C {'H} NMR spectrum of o-glucose, 22.63 MHz, 1M in D,O, temperature: 30°C, pulse width: 5~-tsec, pulse interval: 0.8 sec, 2500Hz, the numbers indicate the numbering of the C-atoms (8-values relative to TMS = 0);
(a) recorded immediately after dissolving the sugar (accumulation of 512 pulse interferograms); (b) the same solution measured after 2 hr (accumulation of 1024 pulse interferograms); (c) the same solution measured after 8 hr
C-2 C-11 ,12,13,14 C-6
C-4 C-7
C-8
162.2;158.3;153.?,149.0;139.6;135.0 138.6;133.6
136.9
(accumulation of 1024 pulse interferograms).54
120.4
-8, ppm
C(R)-3', C(R)-4' C(R)-2'
C(R)-5'
76.7 72.1 66.5 75.7
DMSO
C(R)-1'
50.4
7-CH,.
8-CH3
23.6;21.7
Fig. 19. 22.63 MHz PFf "C {'H} NMR spectrum of riboftavin, proton broad band decoupled, saturated solution in DMSO-D6 , temperature: 300C, pulse width: 10 ~-tsec, pulse interval: 0.4 sec/4 K interferogram; ppm values relative to
TMS=O.
resonance spectroscopy Ieads to the signal assignment given in Fig. 19.
Carbonatom
ppmrang~
(relative to TMS = 0) (c) 13
C NMR spectra of amino acids and peptides
51.s2•54The different carbon atoms of amino acids resonate in the following ppm ranges (see opposite).
Deprotonation of NHJ
+,SH or COOH groups usually shifts the resonance of neighbouring carbon atoms downfield.
- 13
C NMR spectroscopy is also used more and more for ,&_tructural proofs of amino acid and peptide derivatives
Carboxyls a-carbons ß-carbons y and 8 carbons
Aromatic and heteroaromatic Carbons
168-183 40-65 17-70 17-50 110-140
which are intermediates in peptide synthesis.
Figure 20 shows the
13C NMR spectrum of
ll6 WOLFGANG VOI!LTER 8,9,10
DMSO
~H2 -oto- NH- CH- eooH
4
.•
s6
3CHI I
2~ •cooH
7 6
5 3
2
-173.05 -171.95 -156.20 -137.25-12830-127.95 -65.80 -50.80 -36.35 ppm
Fig. 20. 22.63 MHz PFf "C {'H} NMR spectrum of benzyloxycarbonyl-L-aspartic acid, 250 mg/ml DMSO-D., temperature: 30"C, pulse width: 5 ~~Sec, accumulation of 4096 pulse interferograms, ppm values relative to TMS
=
0.16 I 6 12
II
~12
7 604
0_,.~N /-CO-NH-CH-co-N
I atH 2 3
H 2
; - - , f0-NH2
'\ ..
N~
10
H
9
13 2
7 I 4
5
8, ppm
-
Fig. 21. 22.63 MHz PFf "C {'H} NMR spectrum of TRH, 200 mg/1.5 m1 020, temperature: 30"C, accumulation of 16384 pulse interferograms, pulsewidth: 5 ~~Sec, ppm values relative to TMS = 0.40 C-l: 176.75; C-2: 60.50; C-3: 29.45;
C-3': 31.40; C-4: 24.50; C-4': 21.80; C-5: 47.90; C-5': 47.05; C-6: 174.50; C-6': -173.80; C-7: 51.80; C-8: 29.15; C-8':
28.15; C-9: 132.80; C-10: ll7.40; C-ll: 136.50; C-12: 171.55; C-13: 56.65; C-14: 25.15; C-15: 29.15; C-15': 28.15; C-16:
. 182.10.
benzyloxycarbonyi-L-aspartic acid which is often used as a derivative for the synthesis of aspartic acid containing peptides.
that the TRH exists in a cis and a trans form in solution.
For demonstration of a
13C NMR spectrum of a peptide hormone that of thyrotropin-releasing hormone
(fRH)is given in Fig. 21.
The
13C NMR spectrum of TRH shows four different groups of resonances: at lowest field those of
C=Ogroups, in the ppm range from
115to
140the signals Qf histidine, the group of the a -carbons around
50ppm and at highest field the resonances of CIL carbons. Close to the signals of the prolinamide residue smaller resonances are observed and this fact can be explained only by assuming
CONH,
5. COMPUTER-AIDEn INTERPRETATION OF
"C NMR SPECTRA
CMR spectroscopy gives information about the carbon- skeleton of an unknown compound. Compared to almost all other spectroscopic methods it is possible to character- ize all the information of a CMR spectrum by a small set of digital values, and the number of signals of a CMR spectrum is less or equal to the number of carbon atoms of the molecule. Up to
1972there was no systematic computer handling of CMR data in spite of the suitability
CONH,
JC:Jlco-NH-CH-0-N~
o
NI II ~ trans
-+o JC:JlcO-NH-CH-C-N~
N.I II ~ cis
H CH, C
(j H (j CH,
Öfor data processing of the problem. Therefore, at that time, we started work on the computer-aided interpreta- tion of CMR spectra.59-{;1
Already the first tests have shown good results in computer-aided structural analysis of unknown com- pounds.59 Wehave build up a data bank containing the most important information from 3000 spectra. The following parameters are stored on magnetic tapes and discs: Names of the compounds, structural formulae, molecular weights, CMR chemical shifts (relative to TMS
=
0) multiplicities of the resonances in the proton off-resonance decoupledspectra, lists of the assignments of the signals to carbon atoms, solvents used for the measurements, and the references under which these data were published. 62For the input and output of chemical structure a system which is based on the conventional representation of structural formulae is used. This method requires rules for the drawing of structural formulae on schemes for punching. A special print chain must be used for the output of structural formulae. This print chain contains special characters such as double bonds and triple bonds.
Figures 22a, b and c show examples of computer prints with the stored information.
The (stored) conventional representation of structural formulae is very weil fitted for the dialogue niachine user.
But this representation is not computer-fitted. The complexity of the conventional structural formula rep- resentation and the great matrix required for storage makes data processing nearly impossible. Therefore we used the conventional representation of structural for- mulae only for input and output. For all other internal
purposes of data processing the structural formulae must be coded.
There are some computer-fitted topological representa- tions of chemical structure such as connection tables and linear notations.63 The principles of the linear notations are outlined using the Wiswesser Iine-notation (WLN).63 The forty symbols of the WLN include among ~thers the upper-case alphabetic characters and the ten numerals.
All are included in the character sets of standard card-punching and computer Iine-printing equipment. The symbols serve various functions. First they may represent particular atoms or functional groups. Thus the symbol 1 represents a methyl group and the carbonyl group is respectively V. Second, they may have a syntactic function.
These functions can be distinguished by examination of the context. A simple example of a Wiswesser code is given for a linear molecule: Acetone e.g. is encoded 1 V
1.
In symmetrical linear structures, the same notation is obviously obtained by starting at either the end of the chain or. if unsymmetrical chains are encoded ordering rules are necessary.
The individual carbon atoms of rings are seldom explicitly cited in the WLN, instead a description of the graph is given followed by an indication of the position of the heteroatoms and the degree of Saturation. The benzene ring, because of its frequency, receives special treatment-it is encoded as R. Nevertheless a complex series of rules is applied to ensure an unequivocal description of ring systems and of substituents attached to them.
The specific properties of 13C NMR spectra demand an
991 ERYTHRITOL
ICH2 OH 2CH OH I 3CH OH I 4CH2 OH I
990
OH 7 4 I H3CO C-C OH
1/1 5\1 C3 OH C6
\.2 1/
c-c I I
HO OH
FORMULA C4HI004 MOLWT 122.12
SOLVENT H20
ORIG ST CS2 TEMP AMB
66.20 75.30
1/3 212
W. VOELTER, E. BREITMAIER,G.JUNG, T. KELLER,O. HISS
ANGEW CHEM 82, 812 (1970)
ANGEW CHEM INTERN ED 9, 803 (1970)
(a)
3-0-METHYL-CHIRO-INOSITOL
FORMULA C7H1406 MOLWT 194.19
SOLVENT H20
ORIG ST CS2 TEMP AMB
71.70 69.80 82.50 72.10 70.60 71.40
1/2 2/2 3/2 4/2 5/2 6/2
59.40 7/4
D.E. DORMAN,S. J .ANGYAL,J.D. ROBERTS
J AM CHEM SOC 92, 1351 (1970) (b)
892 2-BETA-3- BETA-14- ALPHA-TRIHYDROXY-
5-BETA-CHOLEST-7- EN-6-0NE 21 22 24 26
H3C CH2 CH2CH3FORMULA C27H4404 MOLWT
\ I \ / \ I SOLVENT C505N
20CH CH2 CH ORIG ST CS2 TEMP
18 I 23 25\
12C C Cl7 CH3 37.20 66.80 S6.80 31.70 50.30
/', 1/\ 27 113 2/2 3/2 4/3 5/2
IIC 13C CIS 119.50 163.00 33.90 37.90 20,70
19 I 114 I 7/2 8/1 912 10/1 11/3
HO IC C C9 C-CI5 4S.30 82.80 31.20 30.80 50.20
',f\11 \ I 13/1 14/1 1513 16/3 17/2
2C CIO C80H 24.00 35.40 18.90 36.10 24.00
I
5J II 19/4 20/2 21/4 22/3 2313
3C C7 27.70 22.60 22.30
/ \ 1 \ !
HO 4C CS 2512 26/4 27/4
II G. LUKAC S,C.R. BENNETT
432.65 AMB 175.70 S/1 26.90
12/3 15.60 18/4 39.10 24/3
0 BULL SOC CHIM FRANCE 1972, 3996 ( 1972)
(c)
Fig. 22(a, b, c). Computer prints obtained from the "C NMR data bank.
118 WOLFGANG VOELTEll
adequate documentation of structural foimulae. In a system of linear or formal representation and storage of structural formulae the assignment to some specific carbon atom ought to be possible. The usefulness -of verbal notations or topological representations for elec- tronic data processing of large collections of formulae must be considered. Beating this in mind, after investigat- ing the possibilities for adapting linear. codings (e.g.
WLN)63 or fragmentation codes (e.g. Gremas)63 we have developed a modified linear notation.59 The steps of coding are defined by simple rules. With this systeminput and output of structural formulae is largely analogous to the standard representation in chemistry: the assignment of 13C NMR signals to carbon atoms in the stroctural formulae makes use of the conventional numbering of the atoms. Moreover for data processing problems such as structural information retrieval the modified linear nota- tion itself shows several advantages:
1.
Only standard character sets are used.2. Storage problems are reduced.
3. A screen hierarchy gives excellerit results for speed, retrieval and redundance.
4. Searching of structures is no problem.
Though manual coding of structural formulae is possible programs for automatic conversion are de- veloped.59 Other programs e.g. the program SEARCH59- which uses the 13C NMR data collection of 3000 compounds are already accomplished and give good results. The program SEARCH is used for the identifica- tion of unknown compounds. With the aid of this program, the 13C NMR data collection and the 13C NMR spectrum of an unknown compound the latter can be unambiguously identified, if its data are stored on the file.
For compounds whose 13C NMR data arenot stored in the data collection, a Iist of similar compounds and partial structures is found. This Iist is ordered by decreasing fitting factors, a factor describing the similarity of compounds.61 Sometimes it is possible to build up the whole unknown molecule with the help of the listed substructures. lf e.g. nicotin is as.sumed to be the unknown compound which is not yet stored in the data collection the program gives a Iist which shows the substructures pyridine, 3-picoline, N-methylpyrrolidine.
The quality of results is scarcely influenced by machines, solvents etc. Our tests have shown essential advantages of computer-aided structural analysis of unknown compounds with the help of 13C NMR data.
Therefore 13C NMR spectroscopy is better qualified for data processing than all other important spectroscopic methods for the following reasons:
1. All information in a 13C NMR spectrum is digitalized.
2. A small number of digital values represents all the information of a 13C NMR spectrum.
3. A small number of digital values gives an extremely specific information of a compound.
4. The comparison of two spectra is very fast.
5. There are no problems of data reduction and information selection. There are also no subjective rules for selection and no subjective weight factors for selected spectral information.
The combination of 13C NMR Software with data processing of other spectroscopic or analytic methods is being evaluated. Especially for mass spectroscopy data collections and software are available.64
6. STRUCTURE ELUCIDATION OF SOME NATURAL PRODUCTS BY SYNOPI'ICAL EVALUATION OF
DIFFERENT SPECI'ROSCOPIC PARAMETERS.
To speed up the structure elucidation of unknown natural compounds it is necessary
to
collect as many physico- chemical properties as possible (melting point, optical rotation; solubility, absorption, optical rotatory dispersion, circular dichroism, infrared, mass and nuclear magnetic resonance spectra). The final aim is to compare these parameters with computer file-stored values of known compounds by means of a computer and finally to receive suggestions for the structure by electronic data processing.(a)
Isolation and structure identification of substance
G Several authors have observed a substance in children's urine·which shows similar reactions65-69 and R1 values in the Bush B 370 system to 11-ß-hydroxy-androsterone.Nineteen litres of pre-adolescent children's urine is adjusted to pH 2, saturated with ammonium sulfate and then extracted three times with a mixture of ether/propanol-2. The extract is fittered and evaporated under reduced pressure. The remaining residue is treated for 48 hr at 37"C with acetate butler of pH 4.3 and then extracted with a 1:1 mixture of ether/ethylacetate. This extract is separated on Whatman No. 3 MM paper in the solvent system benzene: light petroleum: methanol: water (2.5: 2.5:3.0: 2.0). The spot with an R1 value of 0.39 forms a blue colour with Zimmermann reagent (m- dinitrobenzene/ethanol{KOH) and is extracted with abso- lute ethanol and further purified on Whatman paper No. 2 using light petroleuro: methanol: water (5: 4: 1) for the separation. Final separation was achieved by Sephadex LH-20 column chromatography and 0.5 mg of pure substance are received from the starting material.71 •72
As this natural product showed many steroid reactions a steroid structure was suggested first.
The compound showed two absorption maxima at A
=
204 and 249 nm (Fig. 23).60Steroids with absorption properties similar to substance G show Cotton etlects in the range of the absorption maxima. Circular dichroism measurements proved, how- ever, that substance G is an optically inactive compound.
Thus with the first two spectroscopic tools applied the
c:
0
l
200
249
300 ll, nm
Fig. 23. Absorption spectrum of substance Gin ethanol.""
suggested steroid structure for substance
Gwas found to be incorrect.
The i.r. spectrum in CCI.. shows a concentration dependent N-H stretching vibration at 3450 cm-
1•The bands at 3200 and 3100cm-
1are also concentration dependent and allow the suggestion of hydrogen bonding.
A carbonyl band at 1710cm-
1has neighbouring shoulders at 1730 and 1745 cm-
1•Absorptions at 1945, 1885, 1620 and 712 cm-
1could arise from an aromatic part of the molecule (Fig. 24).
In
the mass spectrum of substance
Gthe most intense peakisthat of the molecular ion
71 '72at m/e 133. The low molecular weight again is unequivocal proof that the unknown compound has no steroid structure. The peak at
m/e 77 gives strong evidence that an aromatic residue is apartial structure of the compound (Fig. 25).
From the mass spectroscopic fragmentation pattern, given in Table · 2, it can be concluded that )c=O and
)N-~- I should be structural elements of substance G.
Figure 26 shows the
13C NMR spectrum of substance G, recorded in CDCh.
By means of the computer program SEARCH,
59the computer file-stored data collection
62and the ppm values of Fig. 26 a computer print was produced (Fig. 27), which identifies the compound as oxindole.
Synthetic oxindole is in
allspectroscopic properties identical with substance G.
Table 2. Interpretation of main fragments in the mass sp.ectrumof substance G
Re!. int.
m/e (%) Interpretation
133 100 Me
132 6 M-1 -H
105 62 M-28 -CO
104 95 M-29 -(H+CO)
78 53 M-55 -(CO+HCN)
77 26 M-56 -(CO+ HCN + H) 52 20 M-81 -(CO+ HCN + C2H2) 51 25 M-82 -(CO+ HCN + C2H2 + H) Metastahle peaks:
m/e Interpretation
103 105-+ 104 m'-1 -H
83 133-+ 105 m'-28 -CO
58.5 104-+ 78 m'-26 -CN,C2H2
57 104-+77 m!-27 -HCN
33.8 77-+51 m!-26 -C2H2
rt, cm-t 1600
20
(b) Isolation and structure identification ofa urinary steroid from a boy with early sexual maturation 73
From 7.51. of an acidified (pH 2) urine specimen of a boy with signs of early sexual maturation the steroid conjugates were extracted three times with 21.
ether/isopropanol (3:
1)after addition of ammonium sulfate (50 g/100 ml). The extract was fittered and evaporated to dryness. The remaining residue was then extracted four times with 25 ml ethanol and from the combined ethanol solutions the solvent was removed and the remaining residue taken into 100 ml acetate (0.1 M)/KH
2P04 (0.05 M) buffer. 4 ml of a ß-glucuronidase solution (120,000 Fishman units) were then added and after 24 hr (37°C) a double extraction with 100 ml ether/ethyl acetatewas made. The combined extracts were washed with water, evaporated to dryness and the residue was dissolved in 1 ml ethyl acetate/methanol (2: 1) and subjected to descending paper chromatography (Whatman No. 3 MM;
light petroleum/benzene/methanol/water, 5:5:6: 4). From fraction IP
4of the paper chromatograms the substance was extracted and further separated by silica gel. thin layer chromatography using benzene/ethylacetate (3: 2) as a solvent. The substance was further purified by two preparative silica gel thin layer Chromatographie Se- parations using the solvent systems benzene/ethyl acetate (1:
1)for the first and chloroform/ethanol/water (74: 26: 2) for the second run. 0.5
mgof the unknown compound were available for the structure elucidation/
3As no more material could be isolated no
13C NMR spectroscopy and computer analysis could be applied for
its structure identification. ·
The absm:ption spectrum (Fig. 28), measured in ethanol,
133 100
80 104
;!.
..,
60.!: 78 105
"' 40 a::
20
20 40 60 80 100 120 140
m/e
Fig. 25. Mass spectrum of substance G (LKB 9000 GC MS instrument, 70 eV ionizing voltage, 3.5 kV accelerating voltlige).60
1200 1000 900 800 700
0~--~---74--~---+6--~--~--~9~~10~~~~1~2--~1~3---1~4--~1'5
>., I"
Fig. 24. I.R. Spectrum of substance Gin C CI..60
120 WOLFGANG VOELTER
123.97122.89_
8, ppm
Fig. 26. 22.63 MHz PFT "C {'H} NMR spectrum of substance G; 2.8 mg/ml CDCI,, temperature: 30"C, pulse width:
12 p.sec, pulse interval: 0.4 sec/4 K interferogram, ppm values relative to TMS
=
0, accumulation of 98.032 pulse· interferograms. 60
OXINDOLE
-178.60-36.30-125.30-124.40-122.10-127.80-109.80-142.70 MINIMUM CORRESPONDING LINES = 8
FITTING FACTOR = 1.98
ALPHA-ETHYL STYRENE
_: 148.80-109.70-140.50-126.40-126.50-125.40-126.50-126.50 MINIMUM CORRESPONDING LINES = 6
FITTING FACTOR
=
1.741-METHYL-INDOLE
-129.02-101.02-120.99-121.59-119.47-109.48-129.11-137.23-31.79 MINIMUM CORRESPONDING LINES = 7
FlffiNG FACTOR
=
1.356-METHYL-INDOLE
-124.ot -102.02-120.43-121.56-131.20-111.30-126.35 -l37.ot -21.42 MINIMUM CORRESPONDING LINES = 6
FITTING F ACTOR
=
1.234-CL-BENZONITRIL
-114.00-107.00-130.40-126.30-140.80-126.30-130.40 MINIMUM CORRESPONDING LINES
=
5FITTING F ACTOR = 1.20
4-ME-BENZONITRIL
-117.00-107.30-130.80-128.50- 142.80-128.50-130.80 MINIMUM CORRESPONDING LINES = 5
FITTING FACTOR = 1.20
2-CH,-THIPHENE
-139.00- 124.70- 126.40- 122.60
MINIMUM CORRESPONDING LINES
=
4FITTING FACTOR = 1:19
PHENANTHRENE
-127.64-125.98-125.50-121.79
MINIMUM CORRESPONDING LINES
=
4FITTING F ACTOR = 1.18
Fig. 27. Computer print produced by the aid of the program SEARCH'" a "C NMR data collection62 and the "C chemical shift values of substance G.""


![Furo[2,3-b]furanones in Natural Products: Synthesis, Derivatization and Biological Evaluation of (+)-Paeonilide and Studies toward Dermatolactone](data:image/gif;base64,R0lGODlhAQABAIAAAP///wAAACH5BAEAAAAALAAAAAABAAEAAAICRAEAOw==)