The Formation of a European Electorate Evidence from Electoral Volatility
Measures, 1970s – 2000s
Daniele Caramani
Daniele Caramani
The Formation of a European Electorate
Evidence from Electoral Volatility Measures, 1970s – 2000s
Arbeitspapiere – Working Papers Nr. 83, 2004
Mannheimer Zentrum für Europäische Sozialforschung
Caramani, Daniele:
The formation of a european electorate : evidence from electoral volatility measures, 1970s – 2000s / Daniele Caramani. – Mannheim : MZES, 2004 (Arbeitspapiere - Mannheimer Zentrum für Europäische Sozialforschung ; 83) ISSN 1437-8574
Not available in book shops.
Token fee: € 2,60
Purchase: Mannheimer Zentrum für Europäische Sozialforschung (MZES), D – 68131 Mannheim WWW: http://www.mzes.uni-mannheim.de
Editorial Note:
Daniele Caramani is a research fellow at the Mannheim Centre for European Social Research (University of Mannheim). He received the Ph.D. from the European University Institute (Florence), and has taught previously at the universities of Geneva and Florence. In 2000-02 he was "Vincent Wright Fellow in Comparative Politics" at the Robert Schuman Centre for Advanced Studies (EUI). His research interests include party systems and elections in a comparative and historical perspective, European integration, methodology, and regionalism. He is the author of the book and CD-ROM Elections in Western Europe since 1815 (Palgrave, 2000), and The Nationalization of Politics (Cambridge University Press, 2004), as well as of several international journal articles.
Acknowledgements:
I would like to thank Franz Urban Pappi and Hermann Schmitt for their comments on an earlier version of this paper.
Abstract
This paper investigates the thesis according to which the formation of a European electorate which is distinct from national electorates in the European Union member-states translates into an increasing differentiation of the EU party system from national party systems. The main indicators used to test for the existence of an autonomous EU political space are indices of electoral volatility between national and European elections. Data include results of national elections over the last 30 years and European elections from the first election to the European Parliament in 1979 until 2004 for all current member-states. Evidence shows a persistently similar electoral behaviour in the national and European arenas indicating the predominant salience of national issues, parties, and alignments. In interpreting these results in a comparative historical sociology perspective, the paper argues that a
“Europeanisation” of electoral politics comparable to its “nationalisation” in the nineteenth and twentieth century is unlikely because of the absence of similar social and political mobilisation processes.
Key-words: National and EP elections ● Volatility ● Parties ● European integration
Contents
1 Introduction... 1
2 Approaches to the Formation of a European Electorate... 3
2.1 First- Versus Second-Order Elections ... 3
2.2 The Nation-State’s “Model” ... 4
3 The Persistence of National Politics in European Elections ... 5
3.1 Indicators, Data, and Cases... 6
3.2 Hypotheses and Overall Figures... 9
3.3 Country Comparison ... 12
3.4 Turnout... 20
4 The EU as a Forming Democratic System ... 23
5 Conclusion ... 26
References ... 29
1 Introduction
After the first direct election to the European Parliament (EP) in 1979, Reif and Schmitt (1980) described European elections in terms of “second-order elections.” Since then this label implies in the first place that European elections are (perceived as) less important than national or even local elections in the member-states of the European Union (EU). On the other hand, “second-order” also means that European elections are dominated by national factors, with European electorates voting for the EP according to national criteria, with electoral campaigns and media dominated by national issues, with voters being guided in their voting choice by national party affiliations and electoral alignments, and with leaders seeking support on national policy platforms and governmental action or – in the case of opposition parties – seeking support for their arguments against incumbents. In sum, European elections as national politics “with other means.”
A large part of subsequent research has since then repeatedly supported this view. Most studies on voters’ choice in European elections have found that they are primarily national political contests.1 Also authors concerned more directly with the organisational dimension of political parties have stressed the structural weakness of European party federations as well as their lack of cohesion in the EP.2 National politics continues to be predominant in the European electoral contest: transnational parties are lose organisations which do not play any significant role in the nomination of candidates, as well as ideologically and programmatically heterogeneous (Anderweg 1995). To many, therefore, European parties appear as the “empy vessels” described by Katz and Kolodny (1994) concerning American parties, or “baskets of parties” (Mair 2000).3
Such a debate is not purely academic. Without a European electorate and party system – and without cohesive and concurrent European parties – direct elections to the EP cannot provide adequate channels for democratic accountability. It is therefore a debate with strong normative implications concerning the “democratic deficit” of the EU.4 The democratic confrontation between alternative platforms and policies requires a contest between accountable party fronts competing for votes and facing the sanction by a European electorate. Such a process can develop only together with the creation of an autonomous political space independent from national issues, leaders, and structures.
However, the emergence of a “truly European” party system (Anderweg 1995: 67) looks unlikely to
1 For the most complete review and analysis of European elections, see Van der Eijk and Franklin (1996).
2 See Hix (2002) for an overview and review of the literature since the 1970s. Kreppel (2002) argues that European party leaderships have no means to sanction dissent from national fractions concerning candidates’
nominations (even though in both the EPP and PES there is a tendency to circumvent the control by national parties by institutionalising electoral processes in the EP). For Pedersen, the absence of “genuine” parties at the level of the EU translates in the lack of stable organisations stucturing the electoral process, “organizations that span and control the electoral linkage” (1996: 17).
3 “The Europarties that emerge in the EP are much more akin to the notion of the basket of parties, being juxtaposed to one another rather than competing with one another in any predictable sense” (Mair 2000: 39).
4 Marquand (1978) was the first to stress that a democratic European polity could only emerge with a structured party system and European-wide electoral alignments replacing politics based on national identities. On
most observers, not least because it would face the natural resistance of national parties, but mostly because the development of a European-wide electoral competition and cleavage constellation would require important institutional reforms, with the creation of an elected executive and parliamentary control (Mair 2000: 38).
Yet after six direct European elections it is legitimate to ask if there has been some sort of trend over the last 25 years. This paper therefore addresses the question of whether or not European electorates perceive the national and European arenas as increasingly distinct, and whether or not their electoral behaviour increasingly variates between the two national and European orders of elections. Many factors support the plausibility of such a hypothesis. In the course of the 1980s and 1990s, the EP has acquired new (and increased previous) competences. Recent investigations have found that decision- making mechanisms are systematically affected by European parties, and that the structures of party groups in the EP have developed and consolidated.5 More generally, the whole process of European integration has moved at an accelerated pace in the last decade, and the integration versus anti- integration dimension has gained strength in public debates in all countries in the wake of referenda on accession, single currency, and treaties (Hug 2002), initiatives of the Commission (White Paper on Governance), and more generally with the process of “constitutionalisation” of the EU (Weiler 1999).
This paper wishes to contribute to this debate in three ways. First, it places the six European elections into a time perspective beginning in the early 1970s and ending with the most recent national elections in 2003–04 and the election to the EP in 2004, as well as in cross-country comparative perspective which includes all 25 EU member-states. Second, the paper focuses on voters and their voting behaviour and introduces an indicator that has rarely been applied to the comparison of national and European elections, namely, electoral volatility.6 Third, the paper investigates the theoretical, methodological, and normative implications of empirical results in a comparative historical sociology perspective, by comparing the conditions for the formation of broader spaces of party competition in Europe with earlier developments during the formation of national electorates and party systems in the nineteenth and early twentieth century. This allows to move the first steps towards a tentative “theory of electoral integration” and sets the bases for future analyses.
democratic deficit see also Mény (2003). For an overview of the question of whether a “Europe of the parties”
has emerged, see Hix and Lord (1997), Kreppel (2002), and Raunio (2002).
5 See Hix and Lord (1997: 18). Kreppel speaks of a “transformation of the EP from a chamber of debate to a legislative body” (2002: 151). Hix, Kreppel, and Noury (2003) come to the conclusion that the European party system is “ready for power.”
6 Compared to party organisations and parliamentary groups in the EU, the electoral dimension is often neglected in analyses of the party system at the EU level. For example, Hix, Kreppel, and Noury (2003) distinguish simply an organisational and a competitive dimension in the EP, leaving totally aside the electoral process.
2 Approaches to the Formation of a European Electorate
2.1 First- Versus Second-Order Elections
Analyses of a forming EU electorate and party system conducted in the past decades through the comparison of European and national elections usually consider two main dimensions of electoral behaviour: (1) the support for political parties and (2) electoral participation (turnout). In particular, these two dimensions appear in studies that have compared different orders of elections – between first- and second-order elections – with the goal to explain why voters turn out and vote differently in different types of elections or when elections are held at different times. In this perspective a number of writings have analysed mid-term elections in the U.S. and advanced explanations concerning the (supposed) weaker performance of incumbents compared to Congress elections in Presidential election years. One of these theories – the theory of “surge and decline”7 has often stimulated authors to describe the forming EU party system by comparing it to the U.S (even though the theory itself did not receive much support from empirical evidence).8
Indeed, in Europe research on different orders of elections has proved useful in analysing elections to the EP.9 This work has pointed to the lack of salience of second-order (European) elections in the eyes of European electorates insofar as they do not lead to the selection of executives and that the EP has had only limited power (Reif 1985b). According to this theory this led to (1) lower rates of turnout in elections to the EP, (2) a loss of votes for the major parties in European elections, as well as (3) poorer performances of incumbents. Because in European elections there is “less at stake” the propensity to vote sincerely increases, that is, disregarding tactical or strategic considerations which would on the contrary incentivate to vote for large and/or incumbent parties that have a realistic chance to win office.10 However, research conducted on the emergence of EU or European-wide issues that would account for a deviating electoral behaviour in elections to the EP with respect to national elections, was unable to find striking supporting evidence (Kuechler 1991, Van der Eijk and Franklin 1991). Concerning turnout, additional explanatory factors to account for the few cases in which turnout in European elections approaches that of national elections, include compulsory voting (Blumler and Fox 1982), positive views on Europe (Van der Eijk and Oppenhuis 1990), and time until the next national election (Marsh and Franklin 1996: 19).11
7 The theory of “surge and decline” was proposed by Campbell (1960 and 1966). It seeks to explain the performance of parties in presidential and mid-term elections. See also Niemi and Wiesberg (1993: 207–21).
8 This comparison is, for example, mentioned in Schmitter (2000: 70). For a more systematic juxtaposition (concerning the control of the nomination of candidates) see Raunio (2002: 273).
9 On second-order elections see – besides Reif and Schmitt (1980) – Reif (1985a, 1985b, 1997), Marsh (1998), and Van der Eijk and Franklin (1996).
10 Schmitt (1990) has described the tentency of avoiding the “waste” of votes as “voting with the heart.” In a similar vein a number of authors interpret voting cycles between first-order (national) and second-order elections in terms of a punishment effect against incumbent parties in national governments (Erikson 1988, Reif 1984).
11 Two more elements are often present in the literature on second-order elections which also emerge in Campbell studies on surge and decline. First, the loss of votes for incumbent parties is caused by the lower
2.2 The Nation-State’s “Model”
More recently a number of writings have attempted to adapt theories of formation and structuring of party systems at the national level to the EU party system. These attempts represent an important step forward insofar as they recuperate the rich conceptual and theoretical apparatus of what often goes under the label of “comparative historical sociology” in the wake of the work by Karl Deutsch, Stein Rokkan, and others. Theories of state formation and nation-building, cleavage structures, and centralisation, constitute in this view promising “models” for the interpretation of European unification (Klausen and Tilly 1997).
Several of these writings look in particular at Stein Rokkan’s macro-theory of state formation, nation- building, and mass politics in Europe as a powerful model for interpreting processes of system- building. As for nation-states, European unification can be understood as a process of external boundary-building and of dismantling internal boundaries – above all judicial and economic – combined with an increasing centralisation of decision-making structures and procedures. The interaction between external boundary-building and internal boundary-dismantling was developed from Hirschman’s twin-concepts exit and voice and Rokkan’s concept of political structuring (Caramani 2004: 15–43).12 Most particularly in the legal sphere, the reduction of “selective exit” through the jurisprudence of the European Court of Justice mainly, has led to the development of channels for the expression of voice (institutions for the representation of various social and territorial groups) as well as to the development of political oppositions, differentiations, and cleavages – namely, in the form of contrasts between nation-states.13
The national dimension, however, is only one of the possible dimensions within a forming European- wide cleavage constellation. As Bartolini has stressed (2002: 130–55), territorial resistances to centre formation – economic, legal, cultural – will closely interact with functional differentiations within the new “higher level” forming system. In particular, the territorial dimension over more versus less EU political control or more versus less integration cuts across the traditional class or left–right dimension – the principal functional differentiation in all European party systems. The forming of a European
turnout of the groups supporting incumbents in mid-term or European elections which on the contrary turn out in concomitance of the election of incumbents offices. Second, second-order elections are often interpreted as referenda on the performance of the incumbent government which, however, do not affect its survival (see Reif 1985b: 7–15).
12 Until now the process of dismantling internal boundaries has not affected the political and cultural dimensions (the other two major social sub-systems in Rokkan’s theory based on Parsons’ categories) to the same degree. See Flora (1999: 88–91) for a first outline of the explanatory potential of these categories if applied to the process of European unification.
13 See Weiler (1999) for this interpretation of Hirschman’s scheme and more generally for the first application of the “exit” and “voice” concepts to European integration. See Bartolini (2002) for a development of the implications for European unification of the interaction of the two mechanism in a historical sociology perspective.
electorate and party system will therefore depend strongly on whether or not the left–right dimension will impose itself over the “sovereignty dimension.”14
Although many of these points may be disputed, the above contributions seem to agree on the importance of the territorial dimension in the forming EU political space, and indicate that it will play an important role in structuring political oppositions in Europe.15 At the national level, processes of
“electoral integration” consist of the transformation from territorial into functional politics.16 Territorial oppositions progressively transform into – or are replaced by – “higher-level” alignments and cleavages. Among the theories of electoral integration seeking to explain the formation of wider spaces of party competition, the theory of the nationalisation of politics has provided the most complete set of concepts, hypotheses, and empirical material on the formation of national spaces of electoral competition. As its name reveals, this theory is mainly concerned with the integration of electorates and party systems at the national level, that is, the formation of national cleavage constellations and nation-wide attitudes, issues, and organisations. However, in this case too, it is possible to grasp ideas which were developed in the frame of the nation-state and propose a transposition to European unification. On the basis of work produced recently (Caramani 2004), it may therefore be fruitful to explore the possibility to adapt some of the categories of the theory of the
“nationalisation” of electoral politics to interpret the process of “Europeanisation.”17
3 The Persistence of National Politics in European Elections
Accordingly, the paper wishes to contribute to the debate by exploring the possibility of thinking of Europeanisation in the same terms as of nationalisation. The development of a European political space and the introduction of direct elections for a supranational parliament, stimulate the temptation to adapt the same categories and instruments of the nationalisation of politics to the emergence of a
14 Also according to Marks and Steenberger (2002) the interaction between cleavage “residues” from the nineteenth and twentieth century – especially the left–right dimension – and the pro/anti-European dimension will determine the nature and shape of the European-wide party system. Besides the main class dimension, as a second functional or sectoral dimension of differentiation, Schmitter (2000: 68) points to agriculture – a cleavage that has disappeared or has been incorporated in other alignments in national constellations – but that at the EU level is re-emerging as a consequence of the important resources for the Common Agricultural Policy controlled by the EU and through alliances of “integration losers” (economically weak groups and peripheral regions).
15 Schmitter points to the salience of the territorial dimension at the EU level in the form of regionalist movements within and across national borders (2000: 69). On the contrary, the religious dimension seems to have moved “outside” the European political space or, more precisely, as a common element characterising European identity in opposition to other border cultures. On the renaissance of the territorial dimension in Europe see also Kohler-Koch (1998).
16 Term “electoral integration” is used to describe processes of formation of wider spaces of party competition (Caramani 2003). The term therefore encompasses both the integration of national party systems and electorates (which took place in the nineteenth and early twentienth century), and the incipent integration of a European party system and electorate.
17 The theory of the nationalisation of electoral politics originated in the United States. Among the most significant writings see Schattschneider’s classical book The Semisovereign People (1960), in particular Chapter 5 entitled “The Nationalization of Politics. A Case Study in the Changing Dimensions of Politics,” pp.
78-96. Of particular relevance are Stokes’ articles on the variance components model (1965 and 1967). For a
European electorate and party system. However, the radical differences between the conditions of the nationalisation of elections and their possible Europeanisation make a direct application of the same tools problematic. In particular, the absence of European-wide parties and electoral lists and the confinement of parties, candidates, and campaigns into striclty national borders hinders the use of measures of “territorial homogenisation.” For this reason a different indicator is used in this paper.
3.1 Indicators, Data, and Cases
This paper looks at the relationship between first- and second-order elections in Europe with an eye to its long-term evolution over the last 25–30 years, by using the “differential” between electoral behaviour in national and European elections as main indicator. Two dimensions of electoral behaviour are considered: (1) party support: this is measured through the levels of electoral volatility;
(2) turnout levels, that is, the differences in the levels of electoral participation between national and European elections.18
To measure the levels of volatility, the index of “total volatility” devised and used in Bartolini and Mair (1990) has been applied. This index is constructed by summing up the absolute differences (disregarding plus and minus signs) between the percentage of votes for each party in election “t” and the percentage in “t+1.” The sum is then divided by two to avoid double counting (gains for one party meaning losses for another or several other parties), and to make the index vary between 0 and 100.19 Volatility indices have been computed always on the previous election. For example, the level of volatility in the British 1997 national election has been computed with respect to the 1992 national election. Similarly, the levels of volatility in the European election in Britain of 1999 has been computed with respect to the European election in Britain of 1994. And so on. Overall – by combining national and European elections – three types of volatility can be computed:
• Volatility between national elections only (in the different graphs this type of volatility is represented through solid lines).
• Volatility between European elections only (dashed lines).
• Volatility between national and European elections: the levels of volatility in national elections have been computed with respect to the previous European election and, conversely, the levels of volatility in European elections have been computed with respect to the previous national election. This type of volatility is called here “mixed volatility” (and is represented through dotted lines).
theoretical and methodological critique of Stokes’ work see Katz (1973). Claggett, Flanigan, and Zingale (1984) propose the more articulated reflection on the dimensions composing the concept of nationalisation.
18 Because this dimension has already been discussed in a great deal of work the paper focusses mainly on the dimension of party support.
19 The construction of the index is described in Bartolini and Mair (1990: 20–21). The formula is the following:
Total Volatility = ∑ | Pi…n t – Pi…n t+1 | / 2
where P is the percentage of votes for parties “i” to “n” in elections “t” and “t+1.” Values of volatility are computed for each election.
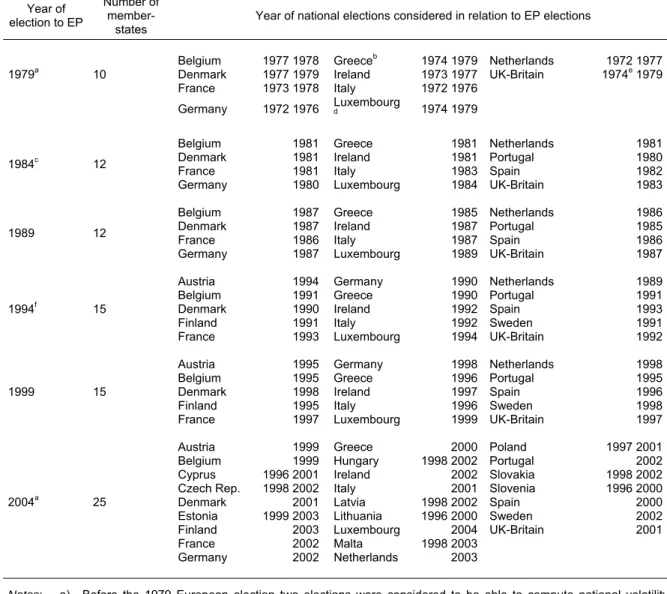
The number of countries considered varies over time according to accession (see Table 1). For the first 1979 election to the EP, there were 10 countries. Greece joined the EU in 1981 and voted to elect its representatives to the EP after accession. This has been considered together with the 1979 vote in the other nine countries. Similarly, Portugal and Spain voted in 1987 after accession and this vote has been considered together with the 1984 European election in the other 10 countries. The same applies to the subsequent round of accession in 1995 when Austria, Finland, and Sweden joined the EU reaching a total number of 15 member states. In Sweden the vote was held in 1995 whereas in the other two countries in 1996. The three elections have been considered as part of the 1994 European- wide election to the EP.20 In 2004, finally, all 25 member states voted almost simultaneously over four days.21
All six European elections have been considered since 1979, the first direct election of the EP. In addition, to compute the levels of volatility in national elections, as well as mixed levels of volatility between national and European elections, a number of national elections have been selected in the interim of European elections. Two national elections before the 1979 election to the EP have also been considered.22 Table 1 includes the years of national election in order to provide the information concerning the temporal contiguity between national and European elections. It has been considered that not all national elections were needed for the analysis. Between two European elections only one national election has been considered even when more than one took place.23 National results concern the election of lower houses. Concerning the selection of parties to be included in computations, the criterion has been to consider parties receiving at least five per cent nation-wide as well as those receiving at least five per cent within at least one constituency. This allows to include regionalist parties and more generally small parties which – in European elections – score better than in national contests.24
20 A number of more specific problems concern the changing alliances and the splits of parties between two elections. For example, the Italian Democrazia Cristiana after 1992 divided into several parties. The Partito Popolare Italiano has been considered its “successor” for computation purposes.
21 For the 2004 European election data are provisional and minor adjustments might prove necessary in subsequent analyses.
22 Two national elections have been considered before the first European election because two (subsequent) elections are required to compute one national volatility index.
23 In some cases national and European elections took place during the same year. If a previous national election was available, this has been preferred. However, this has not always been possible. In Luxembourg this is particularly problematic as the two orders of elections take place on the same day (implications are discussed below). Furthermore, the 2003 Dutch national election has been preferred as the 2002 vote was heavily influenced by the murder of a party leader.
24 For data sources see notes to Table 2. Concerning national elections, in Germany the Zweitstimmen have been used (on the basis of which the allocation of seats is carried out by PR), and in Italy since 1994 the list votes have been used according to which seats are allocated proportionally (instead of the single-member constituency votes). For France and Hungary results for first ballots have been used. In Belgium Wallon and Flemish parties have been considered together in the computations.
Table 1: Elections and countries
Year of election to EP
Number of member-
states
Year of national elections considered in relation to EP elections
Belgium 1977 1978 Greeceb 1974 1979 Netherlands 1972 1977 Denmark 1977 1979 Ireland 1973 1977 UK-Britain 1974e 1979 1979a 10
France 1973 1978 Italy 1972 1976 Germany 1972 1976 Luxembourg
d 1974 1979
Belgium 1981 Greece 1981 Netherlands 1981 Denmark 1981 Ireland 1981 Portugal 1980 France 1981 Italy 1983 Spain 1982 1984c 12
Germany 1980 Luxembourg 1984 UK-Britain 1983
Belgium 1987 Greece 1985 Netherlands 1986 Denmark 1987 Ireland 1987 Portugal 1985 France 1986 Italy 1987 Spain 1986 1989 12
Germany 1987 Luxembourg 1989 UK-Britain 1987
Austria 1994 Germany 1990 Netherlands 1989 Belgium 1991 Greece 1990 Portugal 1991 Denmark 1990 Ireland 1992 Spain 1993 Finland 1991 Italy 1992 Sweden 1991 1994f 15
France 1993 Luxembourg 1994 UK-Britain 1992
Austria 1995 Germany 1998 Netherlands 1998 Belgium 1995 Greece 1996 Portugal 1995 Denmark 1998 Ireland 1997 Spain 1996 Finland 1995 Italy 1996 Sweden 1998 1999 15
France 1997 Luxembourg 1999 UK-Britain 1997
Austria 1999 Greece 2000 Poland 1997 2001 Belgium 1999 Hungary 1998 2002 Portugal 2002 Cyprus 1996 2001 Ireland 2002 Slovakia 1998 2002
Czech Rep. 1998 2002 Italy 2001 Slovenia 1996 2000
Denmark 2001 Latvia 1998 2002 Spain 2000 Estonia 1999 2003 Lithuania 1996 2000 Sweden 2002
Finland 2003 Luxembourg 2004 UK-Britain 2001 France 2002 Malta 1998 2003
2004a 25
Germany 2002 Netherlands 2003
Notes: a) Before the 1979 European election two elections were considered to be able to compute national volatility rates. The same applies for the 10 Central and East European new member-states before the 2004 European election. In 2004 voting was carried out over four days according to countries (10–13 June).
b) Greece voted in 1981 after accession.
c) Portugal, and Spain voted in 1987 after accession.
d) In Luxembourg European and national elections are held on the same day.
e) British October election. Northern Ireland excluded from all British figures.
f) Austria, Finland joined the EU in 1994 but voted for the EP in 1996. In Sweden the election was held in 1995.
3.2 Hypotheses and Overall Figures
First, if the hypothesis of the progressive formation of a European electorate increasingly independent of national politics is true, we expect to find that the divergence between party vote in national and European elections grows over 25 years. This would mean that voters perceive two distinct arenas or
“spaces” in which different lists – or, at least, the same parties but campaigning and positioning themselves on European rather than national issues – compete on dimensions that cut across national cleavages. If, for example, in a given country we find a low level of volatility in national elections but a high volatility when these are compared to European elections, we ought to conclude that – in elections to the EP – voters refer to different issues, platforms, and perhaps leaders that cut across the usual national alignments. In other words, if in an evolutionary perspective over six elections to the EP since 1979 the European competition sphere has developed progressively, we expect that the mixed volatility increases over time.25
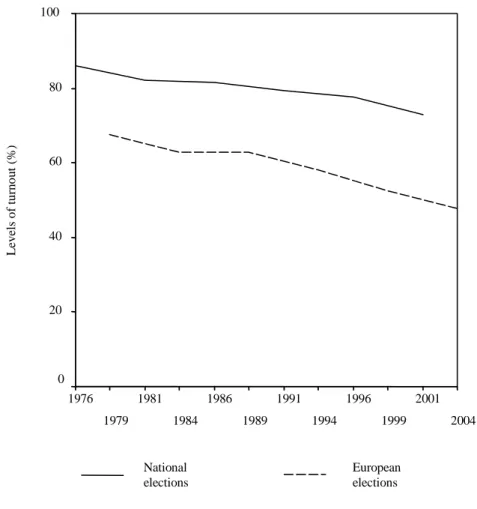
Second, if the hypothesis of the formation of a European electorate is true, we expect the rates of electoral participation to increase over time with voters perceiving these elections as increasingly relevant. More precisely, given the long-term trend of declining turnout in national elections, we would expect to find a convergence of electoral participation between national and European elections. This point is dealt with in a subsequent section of the paper.
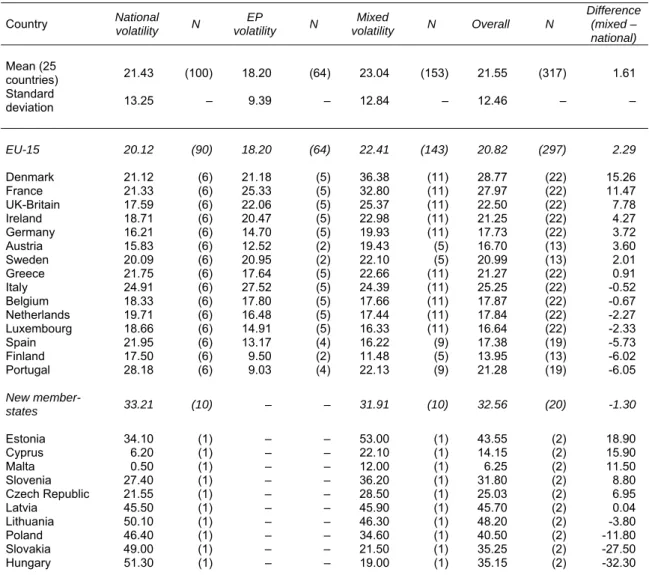
Concerning party support, over the last 25 years electoral behaviour in European elections has not been dramatically different from electoral behaviour in national elections. This basic result of the analysis appears in the first row in Table 2 where overall figures are given. For the entire period from the beginning of the 1970s until the last European election in 2004, the level of volatility in all types of elections, national and European, is 21.55.26 What appears in the comparison between different types of volatility is that there is only a slight difference in the levels of volatility between national, European, and mixed volatility. The lowest level of volatility can be observed concerning European elections (18.20) applicable only to countries in which at least two elections to the EP took place, that is, Western Europe: From one European election to the next there is greater stability than from one national election to the next. The important information concerning the hypothesis of the
“autonomisation” of the European sphere of competition, however, is given by the comparison between national and mixed volatility. The mixed volatility between national and European elections
25 It could be considered that the similarity of electoral behaviour between national and European elections does not necessarily indicate the absence of a European electorate because, in a multi-level system, the same cleavages and alignments exist both at the national and European level. A high volatility indicates the existence of a different dimension at the European level – for example, a pro/anti-European dimension – but a low volatility could also mean that a European electorate and party system exists, but based on the same dimension – namely, the left–right dimension – which is predominant at the national level (see Hooghe and Marks, 2001: Appendix tables).
26 The “N” in Table 2 indicates the number of pairs of elections (“t” and “t+1”) on which volatility indices have been computed. The overall “N” of 317 includes volatility between pairs of national elections, pairs of European elections, and pairs of national and European elections in all countries.
Table 2: Levels of electoral volatility by country
Country National
volatility N EP
volatility N Mixed
volatility N Overall N
Difference (mixed – national) Mean (25
countries) 21.43 (100) 18.20 (64) 23.04 (153) 21.55 (317) 1.61 Standard
deviation 13.25 – 9.39 – 12.84 – 12.46 – –
EU-15 20.12 (90) 18.20 (64) 22.41 (143) 20.82 (297) 2.29 Denmark 21.12 (6) 21.18 (5) 36.38 (11) 28.77 (22) 15.26 France 21.33 (6) 25.33 (5) 32.80 (11) 27.97 (22) 11.47 UK-Britain 17.59 (6) 22.06 (5) 25.37 (11) 22.50 (22) 7.78 Ireland 18.71 (6) 20.47 (5) 22.98 (11) 21.25 (22) 4.27 Germany 16.21 (6) 14.70 (5) 19.93 (11) 17.73 (22) 3.72 Austria 15.83 (6) 12.52 (2) 19.43 (5) 16.70 (13) 3.60 Sweden 20.09 (6) 20.95 (2) 22.10 (5) 20.99 (13) 2.01 Greece 21.75 (6) 17.64 (5) 22.66 (11) 21.27 (22) 0.91 Italy 24.91 (6) 27.52 (5) 24.39 (11) 25.25 (22) -0.52 Belgium 18.33 (6) 17.80 (5) 17.66 (11) 17.87 (22) -0.67 Netherlands 19.71 (6) 16.48 (5) 17.44 (11) 17.84 (22) -2.27 Luxembourg 18.66 (6) 14.91 (5) 16.33 (11) 16.64 (22) -2.33 Spain 21.95 (6) 13.17 (4) 16.22 (9) 17.38 (19) -5.73 Finland 17.50 (6) 9.50 (2) 11.48 (5) 13.95 (13) -6.02 Portugal 28.18 (6) 9.03 (4) 22.13 (9) 21.28 (19) -6.05 New member-
states 33.21 (10) – – 31.91 (10) 32.56 (20) -1.30 Estonia 34.10 (1) – – 53.00 (1) 43.55 (2) 18.90 Cyprus 6.20 (1) – – 22.10 (1) 14.15 (2) 15.90 Malta 0.50 (1) – – 12.00 (1) 6.25 (2) 11.50 Slovenia 27.40 (1) – – 36.20 (1) 31.80 (2) 8.80 Czech Republic 21.55 (1) – – 28.50 (1) 25.03 (2) 6.95 Latvia 45.50 (1) – – 45.90 (1) 45.70 (2) 0.04 Lithuania 50.10 (1) – – 46.30 (1) 48.20 (2) -3.80 Poland 46.40 (1) – – 34.60 (1) 40.50 (2) -11.80 Slovakia 49.00 (1) – – 21.50 (1) 35.25 (2) -27.50 Hungary 51.30 (1) – – 19.00 (1) 35.15 (2) -32.30 Notes: Countries are odered by difference between mixed and national volatility (last column). In Luxembourg
elections are held simultaneously with EP election (the national election 2004 has been included as well).
This was also the case in Belgium (1999), Greece (1989), and Ireland (1989).
Sources: National elections: Election results to compute volatility indices have been taken from Caramani (2000) with updates from official statistics.
European elections: Fragmented – and often unprecise – sources had to be used for compiling the file on European elections results. National Statistical Yearbooks (several years), National Ministries of Interior (electoral services), National Statistical Offices, European Parliament (poor data), Grunberg, Perrineau, Ysmal (2000), Lodge (1986, 1990, 2001), Mackie (1990), Mackie and Craig (1985), Perrineau and Ysmal (1995), as well as newspapers reports for the last 2004 elections. I am grateful to Reinhart Schneider for providing me with data from the Infas-Report Wahlen European election study (1989).
(23.04) is 1.50 higher than the overall level of volatility, whereas the national volatility is 0.12 lower.27 There are therefore only small differences between electoral behaviour in national and European elections. On the contrary, these figures give a first indication that – since the beginning of direct
27 The relatively low levels of the standard deviation further indicate that there is no major variation among cases around the levels of national, European, and mixed volatility.
elections to the EP – electoral behaviour in the elections to the EP and elections to national parliaments is fundamentally similar, and speak against the hypothesis of a distinct European arena.
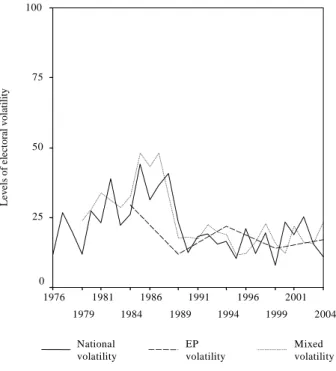
This initial result is confirmed by trends over time. Figure 1 displays the temporal evolution of the three levels of volatility – national, European, mixed – from the 1970s until the present. As far as national elections only are concerned (solid curve), there is an increase of volatility between the mid-1970s and the second half of the 1980s. During this decade electoral instability has been growing. Overall, for the 10–12 countries considered during this period, the volatility in the second half of the 1980s is double with respect to that of the mid-1970s.28 This is mainly due to important changes occurred in almost all European party systems.29 Later, during the 1990s until the last elections in 2003–04, volatility levels decrease again and remain stable. The high levels of the mid-1980s affect also European elections (dashed curve). The first election for which this type of volatility can be computed is 1984 with respect to the first direct election to the EP in 1979. As it appears in the figure, the level of volatility (as for national elections) decreases in 1989 and stabilises during the 1990s.
But the most important information in Figure 1 is conveyed by the evolution of mixed volatility (dotted curve). The trend over time of electoral volatility between national and European elections follows very closely the other two types of volatility – between national elections only and between European elections only. At no moment, during the 25 years of European elections, electoral behaviour in elections to the EP has drastically differred from electoral behaviour in elections to national parliaments. The curves follow the same trajectory over time. Furthermore, the trends of the curves do not suggest any type of divergence which would indicate that European electoral behaviour progressively “departs” or “detaches” itself from national patterns.
According to this finding, therefore, it is possible to conclude that even though there have been six elections to the EP over the last quarter of the twentieth century, a European electoral and partisan arena – or a competitive sphere autonomous from the national parties, issues, and leaders – has not as yet emerged. Data suggest on the contrary that, overall in Europe, the same electoral lists run for both national and European elections and that these lists receive very similar levels of support in national and European elections. This indicates that voters do not modify their behaviour on the basis of the issues that are raised before elections to the EP and that they do not react to the European platforms of parties as presented in campaigns before European elections. As a first conclusion, therefore, it is possible to say that national politics still predominates in European elections.
28 This result relativises to some extent the conclusions reached by the famous study by Bartolini and Mair (1990) on the absence of a recrudecence of electoral instability in the recent decades. Whereas their analysis ends with 1985, the data presented here show that there is a peek of instability shortly thereafter which, however, does not persist in the 1990s. As other literature has suggested, these patterns of volatility might suggest a re-alignment taking place in the second half of the 1980s and then stabilising in the 1990s (Dalton et al. 1984, Ersson and Lane 1982, Shamir 1984). The first date appearing in Figure 1 is 1976. Yet the level of volatility is computed with respect to the previous 1972–74 elections (depending on the country) so that almost the whole of the 1970s are covered.
29 Unlike most countries, in the Italian case electoral and party system instability is higher in the 1990s than in the 1980s. The same applies to the Netherlands. For a more detailed comparison see below Figure 2.
Figure 1: Levels of volatility in 25 countries (1970s – 2000s)
2004 2001 1999 1996 1994 1991 1989 1986 1984 1981 1979 1976
Levels of electoral volatility
100
75
50
25
0
National volatility
EP volatility
Mixed volatility
3.3 Country Comparison
In spite of these overall results attesting to a fundamental similarity between national and European electoral behaviour, the volatility between national and European elections varies according to countries. The country comparison shows that in a number of cases the mixed volatility is larger than in other cases. Figures concerning the country comparisons are presented in the lower half of Table 2.
What follows in this section looks at the three types of volatility and charts the differences and similarities between countries.
First, national volatility is described in order to have a reference point (see the first column in Table 2).
The most stable countries with the lowest levels of volatility between the mid-1970s and the present day are Austria, Germany, Finland, and Britain. On the other hand, Portugal and Italy clearly stand out with high levels of electoral instability. Whereas in Portugal this is mainly due to the high values of volatility for the 1985 election,30 in Italy volatility scores have been more erratic but persistent. In most countries the evolution over time follows the general pattern displayed above in Figure 1. There is a high of volatility in the second half of the 1980s and then levels decrease and stabilise in the 1990s.
Besides the mentioned cases of Italy and Portugal, exceptions to this pattern are mainly Ireland and Luxembourg where volatility peeks in the 1987 and 1989 national elections respectively, and the
30 In the 1985 national election in Portugal, it is mainly the rise of the Partido Renovador Democrático (with a score of 18.53 percent of the votes) that causes both high levels of national volatility (with respect to the 1980 election) and mixed volatility (with respect to the 1984 EP election). In the 1987 national election, this party received 5.05 percent of the votes nation-wide.
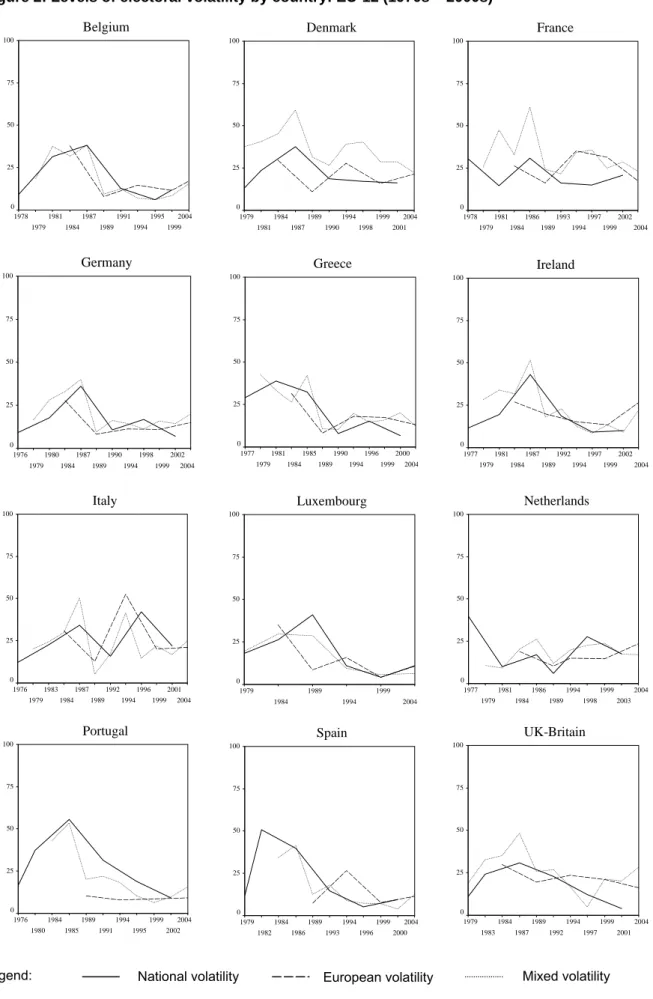
Netherlands where electoral instability is a more recent phenomenon that becomes more consistent towards the end of the 1990s (see solid lines in Figure 2 on the different national patterns).
National volatility is particularly high in the new accession countries of Central and Eastern Europe where values range between 21.55 in the Czech Republic to 51.30 in Hungary. Volatility rates are high in spite of the fact that – because of the fluid nature of these forming party systems in the early 1990s – only elections since the second half of the 1990s have been considered in the computations. The two new Mediterranean states Cyprus and Malta, on the contrary, are characterised by a great stability of national electoral patterns.
Second, the number of cases for the volatility between European elections is smaller than for national volatility levels. In the case of the 10 new accesion countries no value could be computed because only one election took place so far. Generally, the levels of volatility between European elections are lower than those between national elections (18.20 against 21.43). However, in this case too there are country differences. Volatility between pairs of European elections are highest in Italy and France, as well as in Britain and Denmark. On the contrary, this type of volatility is particularly low in Finland and Portugal.31 As far as the temporal evolution of this second type of volatility is concerned, Figure 2 indicates for most countries a stable and declining trend in the 1980s and 1990s (dashed lines). The main exceptions are France, for which there is an increase in the volatility between the European elections of 1989, 1994, and 1999, Italy, where the 1990s are characterised by a high level of volatility in all orders of elections due to the drastic changes in the party system, Ireland and the Netherlands with an increase in the 2004 election, and Spain between 1989 and 1994. Also in Britain the levels of volatility in European elections remain rather high.
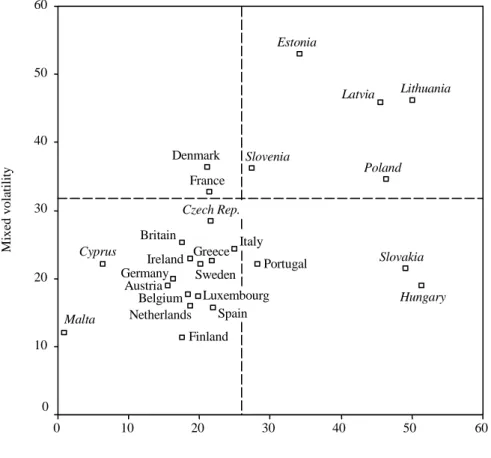
Third, and more interestingly, we must consider the volatility between national and European elections (mixed volatility). This indicator tells us in which countries the differential of party support between national and European elections is larger, that is, where there is a more pronounced tendency of voters to separate the two arenas in their voting behaviour. Of the three types of volatility, the mixed volatility is the largest. However, as already notes, it is not dramatically different from national volatility, indicating a basic similarity of behaviour in the two arenas (23.04 against 21.43 and 18.20 of the national and European volatility respectively).
Among West European countries for which indices can be computed on larger time periods and which have consolidated party systems, the highest levels of mixed volatility can be found in France and Denmark (36.38 and 32.80 respectively). Also in Britain and Italy (as well as in Ireland, Greece, and Portugal) is the mixed volatility high compared to most other countries. On the other extreme, in Finland this type of volatility is limited to 11.48. Whereas in France and Denmark European elections seem to constitute a different arena with respect to the national ones, in Finland, Spain, or
31 In Portugal national volatility was particularly high in the second half of the 1970s after the democratic transition and stabilises in the beginning of the 1980s (see Figure 2). European elections in this country – since 1984 – are therefore not affected by the initial national volatility.
Luxembourg, as well as in most other countries, there is a clear “overlap” between national and European arenas with very few votes changing between the two types of elections. Furthermore, as it is possible to see in Figure 2 (dotted lines), the pattern over time shows again that only in few countries the mixed volatility is higher than the national one. The two cases are again Denmark and France32 where there has always been a higher level of volatility and, to some extent, Britain, Greece and Germany where a slight increase in the mixed type of volatility can be observed in the last European election.
However, even though this information provides a first indication about the tendency to modify voting behaviour according to the order of election in each country, it might be that the levels of mixed volatility simply reproduce the “endemic” or “congenital” levels of electoral instability in each country.
For example, in Italy the level of mixed volatility is comparatively higher than in other countries (24.33), but if juxtapposed to the levels of national volatility in Italy, it appears as “normal” and therefore does not indicate a specific propensity to shifting votes when the arena is the European rather than the national parliament. For this reason it is more appropriate to consider the difference between mixed volatility and national volatility. These data are given in the last column of Table 2 for all countries.
Contrary to what one would have expected in the case of a European electoral arena independent of national factors, the difference between mixed volatility and national volatility is overall very small (1.61 if all countries are considered). The difference is even more reduced for Central and East European countries (-1.30) indicating that volatility is a peculiarity of electoral behaviour in these systems in all orders of elections, and not the sign of independent arenas of competition. Over time this appears clearly also in Figure 1 above where the dashed curve of mixed volatility follows over the entire period very closely that of national volatility. Both curves increase from the 1970s until the end of the 1980s and then stabilise at lower levels of electoral change until the present day. The absence of a divarication between the two curves, rejects therefore the thesis of a progressive autonomisation of the European electoral sphere.
32 For France, however, this is true especially in the 1980s and less today.
Figure 2: Levels of electoral volatility by country: EU-12 (1970s – 2000s)
Legend:
2004 1999 1995 1994 1991 1989 1987 1984 1981 1979 1978 75
50
25
0 100
Belgium
2004 2001 1999 1998 1994 1990 1989 1987 1984 1981 1979 75
50
25
0 100
2004 2002 1999 1998 1994 1990 1989 1987 1984 1980 1979 1976 100
75
50
25
0
Germany
2004 2000 1999 1996 1994 1990 1989 1985 1984 1981 1979 1977 100
75
50
25
0
Greece
2004 2002 1999 1997 1994 1992 1989 1987 1984 1981 1979 1977 100
75
50
25
0
Ireland
2004 2001 1999 1996 1994 1992 1989 1987 1984 1983 1979 1976 100
75
50
25
0
Italy
2004 1999 1994 1989 1984 1979 100
75
50
25
0
Luxembourg
2004 2003 1999 1998 1994 1989 1986 1984 1981 1979 1977 100
75
50
25
0
Netherlands
2004 2002 1999 1995 1994 1991 1989 1985 1984 1980 1976 100
75
50
25
0
Portugal
National volatility European volatility Mixed volatility
2004 2000 1999 1996 1994 1993 1989 1986 1984 1982 1979 100
75
50
25
0
Spain
2004 2001 1999 1997 1994 1992 1989 1987 1984 1983 1979 100
75
50
25
0
UK-Britain France
2004 2002 1999 1997 1994 1993 1989 1986 1984 1981 1979 1978 75
50
25
0 100
Denmark
Only in two cases in particular the levels of volatility between European and national elections (the mixed volatility) are much higher than the “endemic” national volatility one can observe between national legislative elections. The first of these two cases is Denmark, where the mixed volatility is 36.38, that is 14.26 higher than the volatility in the elections to the Folketing (21.12, a comparatively
“average” national volatility). Of all countries, this is the clearest case of a separation in voting behaviour between national and European arenas. What are the causes of this high differential? The main factor of volatility is the creation of a specific anti-EC movement which participates as an electoral alliance in European elections in Denmark since 1979 (Folkebevægelsen mod EF). This alliance does not contest national elections and received in European elections in 1979–89 around 20 percent of the votes. In the subsequent elections of 1994, 1999, and 2004, however, its strength declined to 10.3 and 7.3 and 5.2 percent respectively. Anti-EC groups first mobilised in occasion of the referendum for accession in 1972. The movement (a conglomerate of local committes and political parties) was defeated in the referendum but was revived before the 1979 European election.33 Since most of the groups participating in this alliance are left-wing, the second factor accounting for a high mixed volatility in Denmark is the weakness of Social Democrats in European elections. In national elections they score between 30 and 38 percent, whereas in European elections between 15 and 23 percent (whereas significant variations do not occur for Conservatives and Liberals).34
The other country for which the mixed volatility is much higher than the national is France. Whereas the level of volatility in elections to the Assemblée Nationale is on average 21.33, if national and European elections are combined, volatility peeks to 32.80 (11.47 more). As in the Danish case, the causes are the strong fluctuations of some parties between the two orders of elections, as well as the creation of “ad hoc” alliances and new lists on European themes. This concerns particularly the 1994 and 1999 European elections in which the Gaullist Rassemblement pour la République built and alliance with the liberal Union pour la Démocratie Française, and in which a number of new lists were formed.35 One of these is Energie Radicale (led by a former buisinessman) which received 12 percent of the votes, another is Autre Europe, a right wing splinter of the Gaullist party and, finally, the Rassemblement pour la France et l’Indépendance de l’Europe. These parties contested also the 1999 election (with the exception of Energie Radicale), but the alliance between RPR and UDF was discontinued.
In the French case, however, more than in the Danish case, the mixed volatility is also caused by two national elections – the 1981 and 1986 (see graph in Figure 2). With respect to the 1979 election in
33 I have chosen to consider the anti-EC movement as an independent alliance as it regroups candidates and groups from different parties (although most of them are left of centre parties: Socialistisk Folkeparti, Socialdemokrater, Venstresocialisterne) as well as the liberal Retsforbundet (or Justice Party). This alliance represents a good early case of a European issue and cleavage cutting across national alignments and, therefore, an example of the formation of an autonomous European electoral space with respect to national political spaces.
34 The Radikale Venstre too scores less in European elections during the 1980s in particular (they recover strength in the 1990s) and the Centrum Demokraterne enters the electoral scene for the first time in the 1979 European election.
which the UDF increased its votes to 26.6 percent, in the 1981 election it returned to around 20 percent and, in the 1984 European election, dropped to 10 percent.36 Above all, however, the 1981 national election has been particularly volatile because of the strong increase of support for the Socialist Party (from 22–24 percent in the previous national and European elections to 37.3 percent).
This percentage diminished to 20.8 percent in the subsequent European election of 1984, but then increased again to 31.5 percent in the 1986 election (the only national election during this period with PR instead of a two-ballot formula). The 1984 European election is also the first election in which the extreme right-wing and anti-European Front National increases its votes from close to nothing to more than 10 percent – a level that it has maintained until the present day37 – indicating, as in Denmark, a significant dimension in the party system between pro- and anti-Europeans.
The other countries in which mixed volatility is higher than national volatility are Britain (7.78 more) and Ireland (4.27 more). In Britain, there are two moments of high mixed volatility: the first half of the 1980s, and since the 1999 European election (see graph in Figure 2). In both cases, it is the combination of variation of support for the large parties and the increase of votes for small parties in European elections to cause high levels of mixed volatility. The European election of 1989 is characterised by the strong decline of the Conservative Party (from 42.30 to 33.00 percent) as well as of the Liberal Party (almost half the votes). On the contrary, the Labour Party increases its support by eight percent. In the 1989 election, furthermore, the Greens score a high of 14.50 percent, a level that they will never reach again. In the 1989 election, furthermore, the Greens score a high of 14.50 percent, a level that they will never reach again. In the subsequent 1992 national election, the main change consists of the creation of the Liberal Democratic Party which receives 17.85 percent of the votes. Concerning the late 1990s, the main factor of volatility is the Labour Party which passes from 43.21 percent in the 1997 national election to 28.00 percent in the 1999 European election and then again to 40.70 percent in the 2001 national election. In 2004, finally, the UK Independence Party (UKIP) did particularly well with 16 percent of the vote. In Ireland only the first two European elections show a discrepancy with national electoral behaviour mainly through the fluctuations of Fianna Fáil’s support. This party, in the late 1970s and early 1980s, is strongly penalised in European elections.38 Since then, however, the levels of mixed volatility decline and correspond to those of low national volatility.39
35 The RPR and the UDF were two separate parties until they unified last year as Union pour un Mouvement Populaire. The UDF still exists formed by the group of Liberals led by Alain Madelin that did not join the UMP.
36 In part this was a consequence of the rise of the Centre pour l’Europe (Centre des Démocrates Sociaux) which received 13 percent in the 1984 European election.
37 A peek of support for the Front National takes place in the 1997 national election (15.1 percent).
38 A number of changes take place in the Irish party system – although the do not affect significantly the levels of volatility – principally with the rise of the Workers’ Party, the Democratic Left, and the Progressive Democratic Party.
39 In Germany the slightly higher levels of mixed volatility in the 1980s (3.72 more than national volatility) are caused mainly by the growth of the Greens in European elections and, in the late 1990s, by the bad performance of the Social Democrats in European elections. This would support the thesis of a “punishment”
of incumbent parties in second-order elections. The Sozialdemokratische Partei Deutschlands wins the 1998 and 2002 national elections but decreases to 30.70 percent in the 1999 European election and to 21.50 in the 2004 European election. The Christlich-Demokratische Union – on the contrary – receives less than 30