Quantitative detection of Staphylococcus aureus,
Streptococcus pneumoniae and Haemophilus influenzae in patients with new influenza A (H1N1)/2009 and
influenza A/2010 virus infection
Quantitative Bestimmung von Staphylococcus aureus, Streptococcus pneumoniae und Haemophilus influenzae bei Patienten mit der neuen Virusgrippe (H1N1)/2009 und Virusgrippe A/2010
Abstract
Introduction: Viral influenza is a seasonal infection associated with significant morbidity and mortality. In the United States more than
Firouzeh Safaeyan
1Mohammad Reza Nahaei
135,000 deaths and 200,000 hospitalizations are recorded annually due to influenza. Secondary bacterial infections or co-infections associ-
Sirus Jedary Seifi
2ated with cases of influenza are a leading cause of severe morbidity and mortality, especially among high-risk groups such as the elderly
and young children.
Hossein Samadi Kafil
3Javid Sadeghi
2Aim:The aim of the present study was the quantitative detection of S. aureus, S. pneumoniaeandH. influenzaein a group of patients with
seasonal influenza A, influenza A (H1N1) pandemic 2009, and patients 1 Tuberculosis & Lung Disease Research Center, Tabriz with symptoms of respiratory infection, but the negative forH1N1serving
as control group. University of Medical
Sciences, Tabriz, Iran Method:In total, 625 patients suspected respiratory infection from April
2009 to April 2010 were studied. There were 58 patients with influenza 2 Department of Medical Microbiology, Faculty of A H1N1 and 567 patients negative for influenza A H1N1. From
November 2010 to February 2011, 158 patients with respiratory Medicine, Tabriz University of Medical Sciences, Tabriz, Iran
symptoms were analyzed for seasonal influenza A. There were 25 pa- tients with seasonal influenza A. To check the colonization status among
the healthy individuals 62 healthy persons were further investigated. 3 Drug Applied Research Center, Tabriz University of Individual were screened in parallel. The choices of special genes were
amplified from clinical specimens using real-time PCR with a cutoff of Medical Sciences, Tabriz, 104CFU/mL to differentiate colonization from infection in respiratory Iran
tract.
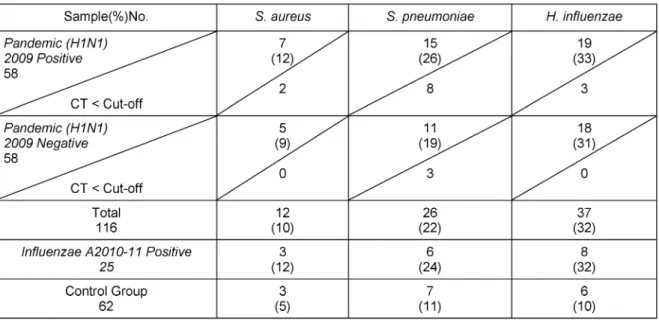
Results:S. aureus, S. pneumoniaeandH. influenzaewere detected in 12%, 26% and 33% of patients withH1N1, while the corresponding figures were 9%, 19%, and 31% forH1N1negative patients. Among patients with seasonal influenza A 12%S. aureus,24%S. pneumoniae, and 32% H. influenzaeco-infections were detected, while influenza negative control group yielded 5%S. aureus, 11%S. pneumoniae, and 10%H. influenzae, respectively.
Conclusion: The results of this study indicated that the serotype of pandemicH1N12009 did not increase incidence of secondary infection withS. aureus, S. pneumoniaeandH. influenzae. Quantitative detection of secondary bacterial infection by QR-PCR can help us for distinguishing colonization from infection and controlling misuse of antibiotics and bacterial drug resistances.
Keywords:S. aureus, S. pneumoniae, H. influenzae, bacterial colonization, H1N1, influenza A
Zusammenfassung
Einleitung:Die Virusgrippe ist eine saisonale Infektionskrankheit, die mit ausgeprägterer Morbidität und Mortalität einhergeht. In den USA werden jährlich mehr als 35.000 Todesfälle und 200.000 Krankenhaus- behandlungen erfasst. Die mit der viralen Primärinfektion assoziierte bakterielle Superinfektion oder Ko-Infektion verursacht schwere Krankheitsverläufe speziell bei Hochrisikogruppen wie alten Menschen und Kleinkindern.
Zielsetzung: Die Zielsetzung der Studie bestand in der quantitativen Bestimmung vonS. aureus, S. pneumoniaeandH. influenzaebei Pati- enten mit saisonaler Influenza A bzw. pandemischer Influenza A (H1N1) und Symptomen respiratorischer Infektionen, im Vergleich zu je einer Kontrollgruppe.
Methode:Insgesamt wurden von April 2009 bis April 2010 625 Patien- ten mit Verdacht auf eine respiratorische Infektion untersucht, davon 58 Patienten mit Nachweis von Influenza A (H1N1). Vom November 2010 bis zum Februar 2011 wurden 158 Patienten mit respiratorischen Symptomen auf das Vorkommen der saisonalen Influenza A untersucht, davon erwiesen sich 25 als positiv. Zur Ermittlung der bakteriellen Ko- lonisation wurden parallel 62 gesunde Personen untersucht (Kontroll- gruppe). Bei der verwendeten Real-time PCR wurde als Cutoff zur Unter- scheidung von Koloniation und Infektion im Respirationstrakt 104CFU/ml eingeführt.
Ergebnisse:S. aureus, S. pneumoniae undH. influenzaewurden bei 12%, 26% bzw. 33% der Patienten mit Nachweis von Influenzavirus A (H1N1) gefunden; die Häufigkeit in der Kontrollgruppe betrug 9%, 19%
bzw. 31%. Bei der saisonalen Influenza A waren bei 12%, 24% bzw.
32% die Erreger nachweisbar, in der parallelen Kontrollgruppe bei 5%, 11% bzw. 10%.
Schlussfolgerung: Die Ergebnisse zeigen, dass der Serotyp der pande- mischen Influenza A (H1N1) die Inzidenz der bakteriellen Superinfektion für die drei untersuchten Bakterienspecies nicht erhöht hat. Die quan- titative Detektion einer sekundären bakteriellen Infektion mittels Real- time PCR ist geeignet, zwischen Kolonisation und Infektion zu unter- scheiden und damit einer missbräuchlichen Anwendung von Antibiotika vorzubeugen.
Schlüsselwörter:S. aureus, S. pneumoniae, H. influenzae, bakterielle Kolonisation, H1N1, Virusgrippe A
1 Introduction
The novel influenza A (H1N1) virus pandemic, emerged in the spring of 2009 as a consequence of interactions between human, avian and swine influenza viruses. Be- cause of a new type of the Haemagglutinin, this pandemic (H1N1) strain rapidly spread worldwide and recorded as the first pandemic of influenza in 21thcentury [1], [2]. The 1918 influenza virus pandemic resulted in approximately 50 million deaths worldwide, a majority of which were associated with secondary bacterial infections [3]. Sec- ondary bacterial infections were also detected in yearly epidemics and pandemics. These infections are seen in 30% of patients with seasonal influenza [4], [5]. Second- ary bacterial infections that follow infection with influenza virus result in considerable morbidity and mortality in young children, the elderly, and immunocompromised individuals and may also significantly increase mortality
in normal healthy adults during influenza pandemics [6].
Recently, analysis of 34 autopsy cases of individuals who died from the 2009 H1N1 pandemic influenza virus showed that over half displayed signs of secondary bac- terial infections by both postmortem lung culture and histological evaluation [7].
Bacterial complications are more common during pan- demics [8]. The most frequently detected pathogens are S. aureus, S. pneumoniae, S. pyogenes,andH. influen- zae.These bacteria colonize in pharynx and nasopharynx of human especially in children. They could change from not having symptoms to invasive form following viral in- fection [5], [9], and their number is more during the time of respiratory infection than carriers [10].
The mechanism of secondary bacterial infection is aug- mented by attachment and colonization of bacteria during viral infections due to injury of respiratory epithelium.
Major drawbacks of this mechanism include not only the
increased risk of physical and functional alterations in respiratory tracts, but also change inflammatory re- sponses which leads to enhanced replication of viruses and conditions for secondary bacterial infections are prepared. Protease secretion by some of bacteria colon- ized in the upper respiratory tracts increases virus vir- ulence [11], [12]. HA cleavage is necessary for virus cell entry by receptor-mediated endocytosis. Based on studies with staphylokinase, streptokinase, and other activating host proteases, such as kallikrein, urokinase, thrombin, and plasmin it is believed that microbial proteases can potentiate the cleavage activation of influenza virus by mechanisms other than direct cleavage of the HA. Such mechanisms could increase inflammation or destroy en- dogenous protease inhibitors [13]. In addition, it is pos- sible that microbial proteases could contribute to host protease activity by increasing inflammation or destroying endogenous protease inhibitors.
In this study, we aimed to investigate quantitative burden of secondary bacterial infections in patients with influenza A (H1N1) pandemic 2009 (between April 2009 until April 2010) and in seasonal influenza A (between November 2010 until February 2011) in Northwest of Iran.
2 Material and methods
2.1 Sample collection
Nasopharyngeal samples for viral testing were collected from inpatients and outpatients from health centers, EMAM REZA, SINA, and children’s hospitals using rayon swabs and placed into 3 mL of Universal Viral Transport Medium (VTM). Microbiological testing was performed on a second sample from the nasopharynx of patients for microbiological testing. After sampling, swabs were kept in sterile tubes containing NaCl (0.8%) and both samples stored at –80°C until used.
From April 2009 to April 2010, 625 samples from 625 individual patients with acute onset of respiratory symp- toms accompanied by fever and a recent travel history to countries with sustained human-to-human transmission of pandemic H1N1 influenza were analyzed with the novel pandemic H1N1 influenza real-time PCR assay.
From November 2010 to February 2011, 158 samples collected from patients with respiratory symptoms infec- tion.
2.2 Pandemic H1N1 influenza-specific real-time RT-PCR assays
Real-time reverse transcriptase-polymerase chain reaction (rRT-PCR) with subtype-specific primers for detection of influenza A (H1N1) pdm09 was used. RNA was extracted using QIAamp Virus RNA Mini Kit (Qiagen) according to the manufacture’s protocol. The RNA was eluted to a final volume of 100 μL. Water was used as negative control and an influenza virus isolate, A/Stockholm2/2009 H1N1, was used as positive control for each extraction.
The primers used were 5’GGC TGC TTT GAA TTT TAC CAC AA 3’ and 5’TTT GGG TAG TCA TAA GTC CCA TTT T 3’, amplifying the hemagglutinin gene. The probe used was 5’-FAM-TGC GAT AAC ACG TGC ATG GAA AGT GTC-TAMRA- 3’. For the PCR, the SuperScript III Platinum One-Step Quantitative RT-PCR system was used (Invitrogen Corpor- ation, Carlsbad, CA, USA). The PCR program used was reverse transcription for 15 minutes at 50°C followed by 2 minutes at 95°C, 45 cycles of 95°C for 5 seconds, 60°C for 60 seconds, and 40°C for 30 seconds using the LightCycler 480 (Roche Diagnostics GmbH, Man- nheim, Germany). A threshold cycle (CT) of ≤40 together with a sigmoid fluorescence curve was needed for the result to be considered positive [14].
2.3 RT- PCR assays for general influenza A (MA)
144 suspected cases were analyzed for influenza A.
Published real-time PCR primers targeting the matrix (MA) gene of influenza A virus were used. A PCR reaction (One- step RT-PCR kit, Qiagen) of 25 µL for the matrix assay contained 5 µL of RNA extract, 1x reaction buffer, 400 µM of each dNTP, 40 ng/µL bovine serum albumin, 400 nM of primer M_InfA F (AAGACCAATCCTGTCACCTCTGA; Gen- Bank Accession number CY038773(175-197), 400 nM of primer M-_InfA-R (CAAAGCGTCTACGCTGCAGTCC;nt 269-248), 200 nM of probe M_InfA TM (FAM-TTTGT- GTTCACGCTCACCGT-BBQ; nt 215-234) and 1 µL of en- zyme mix. The following conditions were met: 30 min at 50°C; 15 min at 95°C; 45 cycles of 15 s at 94°C; and 30 s at 60°C [15].
2.4 Viral culture
Confluent monolayers of MDCK cells grown in Dulbecco’s modified Eagle’s medium were inoculated with fresh respiratory specimens and monitored daily for cytopathic effect.
Immunofluorescence testing by using the monoclonal antibody against nucleoprotein was performed when cytopathic effect was identified or 8 days post inoculation if no cytopathic effect was observed [16].
2.5 Patient panel
Studied patients consisted of 4 panel which were chosen as described below:
Panel A: were 58 (36 females and 12 males) with average age of 31 years; Patients being positive for influenza A (H1N1) viral infection in 2009.
Panel B: were 58 (39 females and 19 males) having av- erage age of 48 years; Patients being negative for A (H1N1) viral infection in 2009 but had symptoms of res- piratory infections.
Panel C: were 25 (12 females and 13 males) with average age of 52 years; Patients being positive for seasonal in- fluenza A virus in 2010.
Panel D: were 62 healthy persons (38 females and 24 males) with average age of 30 years, all being confirmed by physician diagnosis and chest radiography results of not having respiratory infection, having negative CRP and for which ESR, CBC and WBC were normal. None of these individuals had fever, cough, sneezing or other typical symptoms of respiratory infections.
2.6 DNA extraction
Respiratory tract samples were first centrifuged for 10 min with 1,500 RPM centrifuge, then the supernatant solution was removed and samples were washed twice with PBS and resuspended in 500 mL of lysis buffer (Buffer AL, Qiagen, Crawley, UK) to preserve the nucleic acids [17].
Platelets were treated with 10 mL of an in-house lysis solution to lyse bacterial cells. This stock solution con- sisted of 10 mL of filter-sterilized buffer 1 (20 mM Tris (pH= 8), 2 mM EDTA (Sigma) 1.2% Triton X- 100), 500 mg of lysozyme (Sigma, Poole, UK), and 1,000 U of Lysostaph- in (Sigma, Poole, UK). The applied genomic DNA extraction kit was provided from Qiagen, Crawley, UK [18].
2.7 Quantitative and qualitative PCR
Specialnucgene ofS. aureusstrains which is in charge of nuclease production. This enzyme is resistant to heat, is extracellular and an enzyme that catalyzes the hydro- lysis of both DNA and RNA.plygene producing pneumo- lysin which is the specific toxin of pneumococcus and is specially produced by clinical isolates. The nucleotide sequence of the forward primer was 5’-AGCGATAGC TTT CTC CAA GTG G-3’ (position 531 to 552), and the se- quence of the reverse primer was 5’-CTT AGC CAA CAA ATC GTT TAC CG-3’ (position 583 to 605) with an amplicon of 75 base pairs.
frdb is a housekeeping gene related to fumarate re- ductase iron-sulfur gene B (frdb) was chosen. This gene has low homology with otherHaemophilusspp. The nuc- leotide sequence of the forward primer was 5’-ATC GAA AGT TTA GAG GCA A-3’ (position 328 to 348), whereas the sequence of the reverse primer was 5’-TTC TTT CGA TGG ATG TGG TT-3’ (position 392 to 412). The amplicon was 84 base pairs. All of the chosen genes were desig- nated by an evaluation of all available sequences in GenBank and it was tried to be completely specific.frdb andplyprimers were chosen according to former studies [19] andnucprimer sequence was as below. Sequence of F primer was 5’-GCGATTGATGGTGATACGGTT-3’ (posi- tion 48 to 70) and sequence of R primer was 5’-GC- CAAGCCTTGACGAACTAAAG-3’ (position 303 to 328). The amplicon was 280 base pairs [20]. The presence of amplifiable DNA in all extracts was verified by amplifica- tion of human house-keeping genes 18S-RNA. Forward primer 5’-TTCTGCCCTATCAACTTTCG-3’ reverse primer 5’- GATGTGGTAGCCGTTTCTCA-3’ [21] and amplicon size was 112 base pairs.
The RQ-PCR assay was performed in Rotor-Gene 3000 (Corbett Research, Mortlake, Sydney, Australia) and
analyzed by using a software program from Real-Time Analysis Software (Corbett Research). The real-time PCR amplifications were performed in 20 µL reactions contain- ing 2X QantiTect SYBR Green PCR master mix (Takara, China), which includes HotStarTaq DNA Polymerase, QuantiTect SYBR Green PCR Buffer, 2.5 mmol/mL MgCl2, deoxyribonucleotide triphosphate (dNTP) mix, and fluor- escent dyes, RNase-free H2O (SIGMA; Sigma-Aldrich,Ger- many), 0.6 mmol/mL primer (cinagen, Iran), and 2 µL of the respective template DNA dilution. All of the experi- ments were performed twice. The concentration of DNA was measured by NanoDrop ND-1000 Spectro- photometer (NanoDrop Technologies, Wilmington, DE).
2.8 RQ-PCR protocol
RQ-PCR assay forS. aureus,S. pneumoniaeandH. influ- enzaewas optimized to the initial activation step of 95ºC for 15 min, followed by 40 cycles of denaturation at 94°C for 20 s, annealing at 50°C of 60 s fornuc, 60°C forply and 50°C forfrdbextension at 72°C for 25 second fol- lowed by a final extension step at 65°C for 30 s.
2.9 Standard curves for positive controls
S. aureusATCC 29213,S. pneumoniaeATCC 6305 and H. influenzaeATCC 9006 were used as positive controls in drawing the standard curve. Positive controls containing known concentrations of template were used for estab- lishing correlation curves between bacterial concentra- tions and cycle threshold (CT) values in the RQ-PCR. Two different serial dilution schemes were made: one for vi- able counts and CFU/mL calculation, and one for DNA quantification with RQ-PCR. A dense suspension of bac- teria grown on agar plates was inoculated in phosphate- buffered saline, representing a bacterial concentration of approximately 108CFU/mL. The concentration of DNA corresponding to 108 CFU/mL was determined spectro- photometrically with the NanoDrop ND-1000 Spectropho- tometer (NanoDrop Technologies, Wilmington, DE).
Starting from this concentration, a 10-fold serial dilution scheme ranging between 108and 103CFU/mL was pre- pared. Number of CFUs was determined by plating 10 µL of each dilution step onto agar plates and incubating them at 37°C in 5% CO2 overnight. The number of colonies was counted after 24 h. Two hundred µL of the highest concentration was used for DNA extraction. Gen- omic equivalents (GEQ) per mL were calculated by use of the following website: http://cels.uri.edu/gsc/
cndna.html
2.10 Statistical analysis
Statistical analysis was performed by t-test between mentioned groups. The number of detected patients carrying mentioned bacteria wasn’t significant in compar- ison to other patients, but was significant compared to the control group (P-value <0.05).
Table 1: Interassay variation in cycle threshold (CT) values obtained with dilution series of the reference strains (percent variation)
3 Results
3.1 Viral findings
During the pandemic 2009, 625 samples were investi- gated and 58 (9%) samples were positive for influenza A (H1N1) by real-time PCR and viral culture assay. Thirty- six samples were obtained from female, and 12 from male patients with an average age of 31 years. Eleven (19%) samples belonged to patients older than 65 years.
Thereof, 3 (5%) patients had cancer and immune suppres- sion, 1 patient was pregnant at age 30 years. Twelve (21%) patients were under 5 years old. Thirty-three (57%) patients were hospitalized. 567 (91%) patients had negative results for influenza A (H1N1). From patients with symptoms of respiratory infections, but negative for influenza A (H1N1), 58 were selected for further study (consisted of 58 patients, 39 females and 19 males) having an average age of 48 years. 22 patients were older than 65 years, and 10 patients younger than 5 years. Twenty-one patients were hospitalized.
From November 2010 until February 2011, during sea- sonal influenza A, a total of 25 patients were confirmed for influenza A with real-time PCR and viral culture assay, thereof 12 females and 13 males, with an average age of 52 years. Five patients were older than 65 years, and 5 patients younger than 5 years. None of the patients were hospitalized.
3.2 Bacterial findings
3.2.1 Sensitivity and amplification efficiency of the RQ-PCR
The concentration of DNA corresponding toS. pneumoni- ae with 108 CFU/mL was approximately 40 ng/µL, for H. influenzae with 108 CFU/mL was 93 ng/µL and for S. aureus with 107 CFU/mL was 30.3 ng/µL. GEQ per milliliter were calculated for the three species and were S. pneumoniae: 1.8×10⁹, H. influenzae: 4.7×10⁹, and S. aureus: 9.6×10¹²GEQ/mL.
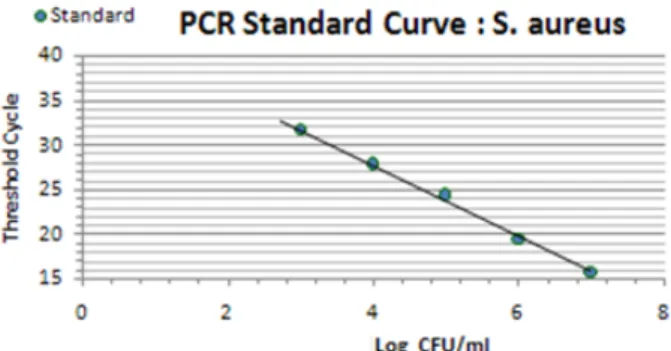
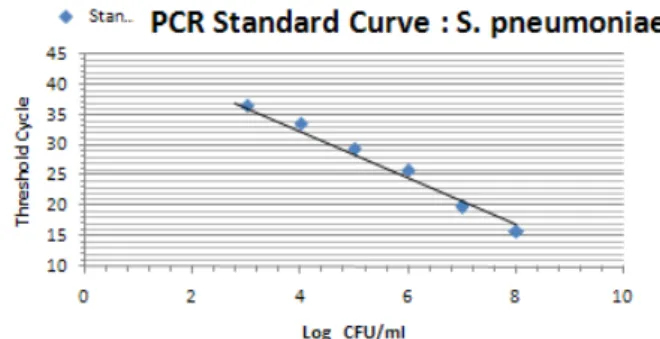
The relation of the CT standard curve with each of standard concentrations is shown in Table 1 (Figure 1, Figure 2, Figure 3).
Figure 1: Standard curve showing consistency in CT values between serial dilutions (S. aureus)
Figure 2: Standard curve showing consistency in CT values between serial dilutions (S. pneumoniae)
Figure 3: Standard curve showing consistency in CT values between serial dilutions (H. influenzae)
3.2.2 Sensitivity of real-time PCR
Tenfold serial dilution from a concentration of 108CFU/mL ofS. pneumoniaeandH. influenzaeand 107CFU/mL of S. aureusbacteria were used to construct standard curves for determination of the sensitivity of the real-time PCR assay.
Prepared standard curve of serial dilution for S.aureus, S. pneumoniaeandH. influenzaebacteria showed the sensitivity of PCR, which were 103bacteria in this study.
The amount ofS. aureusDNA is demonstrated by 15 to 28 CT for 107to 103bacteria. The amount ofS. pneumo- niae DNA, which was detectable in this study, was demonstrated by 15 to 33 CT for 108to 103bacteria. Fi- nally the amount of detectable DNA of H. influenzae bacteria was demonstrated by 15 to 31 CT for 108to 103 bacteria.
3.2.3 Correlation, coefficient and amplification efficiency
The amplification efficiency was determined by plotting cycle threshold values against the DNA copy number and calculating the correlation coefficient. The calculated amounts of study bacteria are demonstrated forS. aureus (E=79.5%, R2=0.998), S. pneumoniae (E=71.6%, R2=0.991), andH. influenzae(E=83.7%, R2=0.998).
3.2.4 Specificity of real-time PCR
Specificity of real-time PCR was determined by the ability of detecting different bacterial species. The bacteria were usedS. mitis ATCC 15912, S. pneumoniae ATCC 33400 andE. coli ATCC 33930. Also the specificity of the PCR is temperature dependent; the annealing temperature had to be optimized for the respective microorganisms.
Melting curve analysis is another important method for determining the specificity of the PCR products. Accepted temperature range for the melting curve analysis was 79.9–81.2ºC forS. pneumoniae, 76.0–77.2ºC forH. in- fluenzae, and 81.5–82.5ºC forS. aureus81.5–82ºC.ply primer is totally specific in detection ofS. pneumoniae at annealing temperature of 60ºC–65ºC, whereas other strains ofα hemolytic streptococcusof 108concentrations have higher CT values in this temp. Also, it was indicated thatfrdbprimer is specific forH. influenzaeat temperat- ure of 50ºC and some strains ofH. parainfluenzaehave CT values lower than calculated in this research. Further- more, it was observed thatnucwas specific at 58ºC.
3.2.5 Reproducibility
Serial dilutions of positive control samples were per- formed three times (triplicate) for each experiment. A slight inter-assay variation in CT values in the dilution series of the positive controls could be observed. Few and periodic changes of CT for serial dilution of positive control are demonstrated in Figure 4, Figure 5, Figure 6.
These numbers show the relationship between different concentrations of the same DNA run 3 times on different occasions. The intra-assay variation was very low, as de- termined by running duplicates of the same samples in the same run. Difference of CT in different serial dilutions of DNA was gained after about 3 to 4 cycles, which showed that PCR is repeatable.
3.2.6 Bacterial quantitative assay
According to the amount of CT in the control group, the cut-off for all 3 bacteria was drawn on the CT which demonstrated 104CFU/mL bacteria forS. aureus, CT=28, S. pneumoniae,CT=31, andH. influenzae, CT=27.
Patients with CT<cut-off with high bacteria were not de- tected in Influenza A group. Five (H1N1) positive patients older than 65 years, and three (H1N1) positive patients under the age of 5 years hadS. pneumoniaeCT<cut-off.
Two (H1N1) positive patients younger 5 years had S. aureus CT<cut-off. Three (H1N1) positive patients younger than 5 years hadH. influenzaeCT<cut-off. Two (H1N1) negative patients older than 45 years (ICU hospit- alized and treated with ventilator) and one patients younger than 5 years hadS. pneumoniaeCT<cut-off. All patients with CT<cut-off for all three bacteria were hospit- alized (Table 2, Table 3).
Figure 4: Association of nasopharyngeal bacterial colonization ofS. aureus with CT
Figure 5: Association of nasopharyngeal bacterial colonization ofS. pneumoniae with CT
Figure 6: Association of nasopharyngeal bacterial colonization ofH. influenzae with CT
Table 2: Results of screening of clinical samples for bacterial respiratory targets
Table 3: Identification and quantification real-time PCR result
4 Discussion
In spite of progress in diagnostic microbiology, difficulties in the detection and differentiation of colonization in in- fections remain to be resolved. In this study consisting of samples from patients with influenza A and the pan- demicstrain H1N1, RQ-PCR substantially improved signi- ficant pathogen detection and quantitative. Epidemiologic studies show symmetry between peaks of influenza and bacterial pneumonia infections, noticing that patients with influenza infection are assumed to be an active source of secondary bacterial infections; rapid detection and isolation of these individuals from the public are the ways for preventing secondary bacterial infections [15].
Because bacteria that participated in secondary infections are mostly known as microbial flora, quantitative detec- tion of these bacteria seems to be essential. The presence of commensals may impair both identification and quantification of potential pathogens, leading to false- negative cultures or quantitative underestimation of rel- evant pathogens. Both respiratory cultures and blood cultures have low sensitivities for the detection of respir- atory pathogens. Usual methods of blood and sputum culture are time consuming and have low sensitivities for the detection of respiratory pathogens. False positive and negative results are common in these methods. In the method of RT-PCR false positive results caused by colon- ization of microbial flora is prevented by use of proper cut off. Adjusting cut off to low levels of infection is per- formed during pandemics and the spread of pneumonia in order to increase real-time PCR’s sensitivity [22], [23].
Pertaining to the quantitative detection of bacteria, anti- biotic treatment with drugs active against the causative agents before sampling, cause decrease in appearance of resistant bacteria and reducing the usage of broad spectrum antibiotics and new generations’ side effects [2]. Detection of secondary bacterial infections especially during pandemics in which lots of people are infected causes saving governmental economic costs. However, it may decrease the use of broad-spectrum antibiotics, which are usually expensive, and reduces the hospitaliz- ation period of patient in hospitals.
In our study, we assessed 62 healthy individuals as con- trols. These subjects were divided in two groups, the first group consisted of individuals younger than 4 years, and the second group of individuals older than 4 years. Hence, the first group consisted of 20 children with an average age of 2.3 years, and the second group of 42 individuals with an average age of 43.4 years. In the first control group, 60% of children gave positive results in real-time PCR assay for all three bacteria, 2 positive forS. aureus, 3 positive forS. pneumoniae, and 5 positive forH. influ- enzae. In the second group, 14.3% of the included sub- jects gave positive results. One positive forS. aureus, 4 positive forS. pneumoniae, and 1 positive forH. influ- enzae. Three bacterial load calculated by real-time PCR.
Both groups were below 10,000 CFU/mL.
However, there results needs to be evaluated on larger population. The main reason for selecting these patho-
gens was in particular their importance as global health problems, as super-infections due toS. aureusfollowing influenza are an increasing concern [24]. Appearance of USA400 and USA300 clones and the predominant com- munity-associated methicillin-resistant Staphylococcus aureus(CA-MRSA) often contain Panton-Valentine leuko- cidin (PVL) genes and, more frequently, cause necrotic and fulminant pneumonia and shock, especially in chil- dren whit influenza [25]. The impact of interventions against influenza andS. pneumoniae, the bacterium that most frequently is the cause of community-acquired pneumonia, can be seen in directed vaccination studies, where, in at-risk populations, hospitalizations were re- duced by 18%–52% and mortality was reduced by 35%–61% [26].
A single study conducted in 1945 showed that infection with both influenza virus andH. influenzaekilled mice at doses that were sublethal when either agent was admin- istered alone [6].
The incidence of secondary bacterial infection varies with the age and infirmity of the patient and the strain of in- fecting influenza virus: while individuals in recognizing risk groups have the highest risk of bacterial infections, younger patients and children also have a significantly increased risk. Indeed, a study published by Rothberg et al. [27] investigating complications associated with influ- enza in different age groups confirmed the selected CT<cut-off for patients younger than 4 years of age. Pre- vious studies have shown higher numbers of bacterial samples taken and culture positivity in patients with influ- enza A than patients with influenza A (H1N1) pandemic 2009 (P<0.0001 andP=0.01, respectively). In our study, patients diagnosed with all three bacteria were almost equal in both groups of patients, influenza A and influenza A (H1N1) pandemic 2009, but our study patients with CT<cut-off in the influenza A group was not found [14].
In a study by Palacios et al. [28] which was performed on 199 H1N1 patients by the method of Tag-PCR on nasopharynx samples, the detection rate of 3 bacteria (S. aureus, S. pneumoniae, and H. influenzae) were 52.3%, 35.5% and 20.6%, respectively, in patients with influenza A (H1N1). In our study, detections of these 3 bacteria was 12%, 26%, and 33%. Also in the previous study, 56.4% ofS. pneumoniaecases were accompanied by severe disease. Besides, in our research, 5 patients were hospitalized out of 7 with influenza A (H1N1) 2009 who had infection withS. pneumoniaewith CT below 31 [28]. In a study conducted at Birmingham, UK [29] in 2009, 16% secondary bacterial infections were detected in children (10 out of 63 patients). In our study, detection of all three bacteria were 5%, 11%, and 10% in the control group, and comparable to a study performed by Normand et al. on the colonization rate ofS. pneumoniain healthy individuals [30]. Other studies were done by Kassi Koon et al. [24] in the USA in 2009, evaluating viral and bac- terial etiologic factors in 10,624 patients suspected of influenza infection. There, the proportion of patients car- ryingS. aureus, S. pneumoniae,andH. influenzaewere 10%, 15%, and 3.5%, respectively for (H1N1) 2009
positive patients, and 12%, 8%, and 5% inH1N1(2009) negative patients [24]. In our study, the proportion of (H1N1) 2009 positive patients carrying 3 indicator bac- teria were 12%, 26%, and 33%, and forH1N1negative individuals 9%, 2%, and 31%. Relatively small difference in percentage of people carrying three bacteria in two groups ofH1N1 positive and negative patients in both studies show that a new strain of swine influenza did not have much effect in favor of increasing carriers of target bacteria.
Statistical comparison between the two groups of (H1N1) 2009 and influenza A patients was not significant, thus indication that the pandemic influenza of 2009 occurred only mildly and the rate of secondary bacterial infection was the same as seasonal influenza that year. However, the number of individuals in the same group was small and therefore, the results need to be considered with some caution.
One of the causes of the decrease in rate of secondary infection was the experimental prescription of antibiotics to the patients in present and former studies and the other cause is the ability of the strain itself, which makes the pandemic. Pandemics spread by H3N3 strain had higher mortality rates thanH1N1or influenza B virus and also other causes are lack of PB1-F2 protein in the strain causing pandemic of 2009, low activity of neuraminidase and another reason is the medium immunity existed in the public [5], [9].
The reasons causing the appearance of difference per- centage of bacterial secondary infections of influenza A (H1N1) in 2009 is condition of studies patients including chronic disease of the liver, lungs, or heart, or systemic metabolic disease such as diabetes. Therefore, single variable evaluations may cause higher rates of bacterial secondary infection [31], [32].
According to the risk of avian influenza pandemic, which is too pathogen, increase in age of populations and pa- tients having immune deficiency, diabetes, hearts, lungs and kidney diseases, the risk of influenza and secondary bacterial infections must be assumed seriously. Using antibiotics for preventing the incidence of secondary in- fections does not seem to be prudent and causes induc- tion and spreading of bacterial antibiotic resistance Using bacterial and viral vaccines such asHaemophilus influen- zaetype b andpneumococcalvaccines seems to be es- sential; besides injection of influenza vaccine is recom- mended for risky people.
5 Conclusion
Our study suggests that bacterial co-infection is not un- common inH1N1infected patients and laboratory invest- igations should go beyond establishing a viral cause alone. Bacterial co-infection was more frequently seen in the older age groups and was associated with higher rates of complications. Quantitative detection of second- ary bacterial infection by QR-PCR can help us for distin-
guishing colonization from infection and controlling mis- use of antibiotics and bacterial drug resistances.
Notes
Competing interests
The authors declare that they have no competing in- terests.
Acknowledgments
This article was sponsored in tuberculosis & lung research center and Tabriz University of Medical Sciences Center.
We would like to thank Mr. Barzegar for excellent technic- al assistance.
References
1. Peltola VT, Murti KG, McCullers JA. Influenza virus neuraminidase contributes to secondary bacterial pneumonia. J Infect Dis. 2005 Jul;192(2):249-57. DOI: 10.1086/430954
2. Metersky ML, Masterton RG, Lode H, File TM Jr, Babinchak T.
Epidemiology, microbiology, and treatment considerations for bacterial pneumonia complicating influenza. Int J Infect Dis.
2012 May;16(5):e321-31. DOI: 10.1016/j.ijid.2012.01.003 3. Kash JC, Walters KA, Davis AS, Sandouk A, Schwartzman LM,
Jagger BW, Chertow DS, Li Q, Kuestner RE, Ozinsky A, Taubenberger JK. Lethal synergism of 2009 pandemic H1N1 influenza virus and Streptococcus pneumoniae coinfection is associated with loss of murine lung repair responses. MBio.
2011;2(5):e00172-11. DOI: 10.1128/mBio.00172-11 4. Rizzo C, Caporali MG, Rota MC. Pandemic influenza and
pneumonia due to Legionella pneumophila: a frequently underestimated coinfection. Clin Infect Dis. 2010 Jul;51(1):115.
DOI: 10.1086/653444
5. van der Sluijs KF, Nijhuis M, Levels JH, Florquin S, Mellor AL, Jansen HM, van der Poll T, Lutter R. Influenza-induced expression of indoleamine 2,3-dioxygenase enhances interleukin-10 production and bacterial outgrowth during secondary pneumococcal pneumonia. J Infect Dis. 2006 Jan;193(2):214- 22. DOI: 10.1086/498911
6. Lee LN, Dias P, Han D, Yoon S, Shea A, Zakharov V, Parham D, Sarawar SR. A mouse model of lethal synergism between influenza virus and Haemophilus influenzae. Am J Pathol. 2010 Feb;176(2):800-11. DOI: 10.2353/ajpath.2010.090596 7. Gill JR, Sheng ZM, Ely SF, Guinee DG, Beasley MB, Suh J, Deshpande C, Mollura DJ, Morens DM, Bray M, Travis WD, Taubenberger JK. Pulmonary pathologic findings of fatal 2009 pandemic influenza A/H1N1 viral infections. Arch Pathol Lab Med. 2010 Feb;134(2):235-43. DOI: 10.1043/1543-2165- 134.2.235
8. Wang XY, Kilgore PE, Lim KA, Wang SM, Lee J, Deng W, Mo MQ, Nyambat B, Ma JC, Favorov MO, Clemens JD. Influenza and bacterial pathogen coinfections in the 20th century. Interdiscip Perspect Infect Dis. 2011;2011:146376. DOI:
10.1155/2011/146376
9. McAuley JL, Hornung F, Boyd KL, Smith AM, McKeon R, Bennink J, Yewdell JW, McCullers JA. Expression of the 1918 influenza A virus PB1-F2 enhances the pathogenesis of viral and secondary bacterial pneumonia. Cell Host Microbe. 2007 Oct;2(4):240-9.
DOI: 10.1016/j.chom.2007.09.001
10. Abdeldaim GM, Strålin K, Kirsebom LA, Olcén P, Blomberg J, Herrmann B. Detection of Haemophilus influenzae in respiratory secretions from pneumonia patients by quantitative real-time polymerase chain reaction. Diagn Microbiol Infect Dis. 2009 Aug;64(4):366-73. DOI: 10.1016/j.diagmicrobio.2009.03.030 11. Hament JM, Kimpen JL, Fleer A, Wolfs TF. Respiratory viral
infection predisposing for bacterial disease: a concise review.
FEMS Immunol Med Microbiol. 1999 Dec;26(3-4):189-95.
12. Haessler S, Schimmel JJ. Managing community-acquired pneumonia during flu season. Cleve Clin J Med. 2012 Jan;79(1):67-78. DOI: 10.3949/ccjm.79a.11108
13. Mancini DA1, Mendona RM, Dias AL, Mendona RZ, Pinto JR. Co- infection between influenza virus and flagellated bacteria. Rev Inst Med Trop Sao Paulo. 2005; 47:275-80. DOI:
10.1590/S0036-46652005000500007
14. Liderot K, Ahl M, Ozenci V. Secondary bacterial infections in patients with seasonal influenza A and pandemic H1N1. Biomed Res Int. 2013;2013:376219. DOI: 10.1155/2013/376219 15. Panning M, Eickmann M, Landt O, Monazahian M, Olschläger S,
Baumgarte S, Reischl U, Wenzel JJ, Niller HH, Günther S, Hollmann B, Huzly D, Drexler JF, Helmer A, Becker S, Matz B, Eis- Hübinger A, Drosten C. Detection of influenza A(H1N1)v virus by real-time RT-PCR. Euro Surveill. 2009 Sep;14(36):pii19329.
16. Shieh WJ, Blau DM, Denison AM, Deleon-Carnes M, Adem P, Bhatnagar J, Sumner J, Liu L, Patel M, Batten B, Greer P, Jones T, Smith C, Bartlett J, Montague J, White E, Rollin D, Gao R, Seales C, Jost H, Metcalfe M, Goldsmith CS, Humphrey C, Schmitz A, Drew C, Paddock C, Uyeki TM, Zaki SR. 2009 pandemic influenza A (H1N1): pathology and pathogenesis of 100 fatal cases in the United States. Am J Pathol. 2010 Jul;177(1):166-75. DOI:
10.2353/ajpath.2010.100115
17. Asgharzadeh M, Kafil HS, Roudsary AA, Hanifi GR. Tuberculosis transmission in Northwest of Iran: using MIRU-VNTR, ETR-VNTR and IS6110-RFLP methods. Infect Genet Evol. 2011
Jan;11(1):124-31. DOI: 10.1016/j.meegid.2010.09.013 18. Curran T, Coyle PV, McManus TE, Kidney J, Coulter WA. Evaluation
of real-time PCR for the detection and quantification of bacteria in chronic obstructive pulmonary disease. FEMS Immunol Med Microbiol. 2007 Jun;50(1):112-8. DOI: 10.1111/j.1574- 695X.2007.00241.x
19. Kais M, Spindler C, Kalin M, Ortqvist A, Giske CG. Quantitative detection of Streptococcus pneumoniae, Haemophilus influenzae, and Moraxella catarrhalis in lower respiratory tract samples by real-time PCR. Diagn Microbiol Infect Dis. 2006 Jul;55(3):169- 78. DOI: 10.1016/j.diagmicrobio.2006.01.007
20. Brakstad OG, Aasbakk K, Maeland JA. Detection of Staphylococcus aureus by polymerase chain reaction amplification of the nuc gene. J Clin Microbiol. 1992 Jul;30(7):1654-60.
21. Gonalves S, Cairney J, Maroco J, Oliveira MM, Miguel C.
Evaluation of control transcripts in real-time RT-PCR expression analysis during maritime pine embryogenesis. Planta. 2005 Oct;222(3):556-63. DOI: 10.1007/s00425-005-1562-0 22. Greiner O, Day PJ, Bosshard PP, Imeri F, Altwegg M, Nadal D.
Quantitative detection of Streptococcus pneumoniae in nasopharyngeal secretions by real-time PCR. J Clin Microbiol.
2001 Sep;39(9):3129-34.
23. Nolte FS. Molecular diagnostics for detection of bacterial and viral pathogens in community-acquired pneumonia. Clin Infect Dis. 2008 Dec;47 Suppl 3:S123-6. DOI: 10.1086/591392 24. Koon K, Sanders CM, Green J, Malone L, White H, Zayas D, Miller
R, Lu S, Han J. Co-detection of pandemic (H1N1) 2009 virus and other respiratory pathogens. Emerging Infect Dis. 2010 Dec;16(12):1976-8. DOI: 10.3201/eid1612.091697
25. Iverson AR, Boyd KL, McAuley JL, Plano LR, Hart ME, McCullers JA. Influenza virus primes mice for pneumonia from
Staphylococcus aureus. J Infect Dis. 2011 Mar;203(6):880-8.
DOI: 10.1093/infdis/jiq113
26. McCullers JA, Bartmess KC. Role of neuraminidase in lethal synergism between influenza virus and Streptococcus pneumoniae. J Infect Dis. 2003 Mar;187(6):1000-9. DOI:
10.1086/368163
27. Rothberg MB, Haessler SD, Brown RB. Complications of viral influenza. Am J Med. 2008 Apr;121(4):258-64. DOI:
10.1016/j.amjmed.2007.10.040
28. Palacios G, Hornig M, Cisterna D, Savji N, Bussetti AV, Kapoor V, Hui J, Tokarz R, Briese T, Baumeister E, Lipkin WI.
Streptococcus pneumoniae coinfection is correlated with the severity of H1N1 pandemic influenza. PLoS ONE.
2009;4(12):e8540. DOI: 10.1371/journal.pone.0008540 29. Hackett S, Hill L, Patel J, Ratnaraja N, Ifeyinwa A, Farooqi M,
Nusgen U, Debenham P, Gandhi D, Makwana N, Smit E, Welch S. Clinical characteristics of paediatric H1N1 admissions in Birmingham, UK. Lancet. 2009 Aug;374(9690):605. DOI:
10.1016/S0140-6736(09)61511-7
30. Nomanpour B, Ghodous A, Babaei T, Mousavi SA, Asadi S, Feizabadi M. Detection and quantification of Streptococcus pneumoniae from Iranian patients with pneumonia and individual carriers by real time PCR. Afr J Biotechnol. 2011;10:12826-32.
DOI: 10.5897/AJB11.1466
31. Morens DM, Taubenberger JK, Fauci AS. The 2009 H1N1 pandemic influenza virus: what next? MBio. 2010;1(4): e00211- 10. DOI: 10.1128/mBio.00211-10
32. Jain S, Benoit SR, Skarbinski J, Bramley AM, Finelli L; 2009 Pandemic Influenza A (H1N1) Virus Hospitalizations Investigation Team. Influenza-associated pneumonia among hospitalized patients with 2009 pandemic influenza A (H1N1) virus United States. Clin Infect Dis. 2012;54(9):1221-9. DOI:
10.1093/cid/cis197
Corresponding author:
Prof. Mohammad Reza Nahaei
Tuberculosis & Lung Disease Research Center, Tabriz University of Medical Sciences, Tabriz, Iran. Tel:
+984113364661 nahaeimr@tbzmed.ac.ir
Please cite as
Safaeyan F, Nahaei MR, Seifi SJ, Kafil HS, Sadeghi J. Quantitative detection of Staphylococcus aureus, Streptococcus pneumoniae and Haemophilus influenzae in patients with new influenza A (H1N1)/2009 and influenza A/2010 virus infection. GMS Hyg Infect Control.
2015;10:Doc06.
DOI: 10.3205/dgkh000249, URN: urn:nbn:de:0183-dgkh0002497
This article is freely available from
http://www.egms.de/en/journals/dgkh/2015-10/dgkh000249.shtml Published:2015-04-15
Copyright
©2015 Safaeyan et al. This is an Open Access article distributed under the terms of the Creative Commons Attribution 4.0 License. See license information at http://creativecommons.org/licenses/by/4.0/.