Lane Kenworthy
Max-Planck-Institut für Gesellschaftsforschung Paulstrasse 3
50676 Köln Germany
Telephone 0221/2767 -0
Fax 0221/2767-555 MPIfG Discussion Paper 00/4
E-Mail info@mpi-fg-koeln.mpg.de ISSN 0944–2073
Home Page http:/ /www.mpi-fg-koeln.mpg.de November 2000
00/4
Abstract
Corporatism has been one of the most heavily studied concepts in comparative po- litical economy over the past two decades, and quantitative indicators of corpora- tism have played a central role in the corporatist literature. This paper offers a sur- vey and assessment of 42 such indicators. The principal aims are to provide an in- ventory of existing indicators, to examine their relative trustworthiness and utility, and to assess the robustness of empirical findings on the effects of corporatism on macroeconomic performance and income distribution and redistribution. Among the more noteworthy conclusions I reach are the following: (1) While quantitative corpo- ratism measures have improved substantially in recent years, substantial gaps re- main. (2) There is little justification for continued use of time-invariant measures.
(3) Composite corporatism measures are commonplace, yet their creators and users have yet to offer a compelling explication of how corporatist effects are generated in such a way that they are more accurately captured by aggregated indicators than by narrowly-targeted ones. (4) There is fairly strong indication that one or more aspects/
types of corporatism were associated with nominal wage restraint, low inflation, low unemployment, and low income inequality during the 1970s and 1980s. However, the results vary markedly depending upon the particular indicator used, and there is little evidence to support the common presumption that corporatism’s unemploy- ment-reducing effect occurs via real wage restraint.
Zusammenfassung
Wenige Modelle der vergleichenden politischen Ökonomie sind über die vergange- nen 20 Jahre so eingehend untersucht worden wie das des Korporatismus. In der einschlägigen Literatur spielen dabei quantitative Indikatoren eine zentrale Rolle.
Für das vorliegende Discussion Paper sind 42 Indikatoren erhoben und untersucht worden. Ziel war es, sie auf ihre Brauchbarkeit und Verläßlichkeit hin zu überprüfen sowie herauszufinden, wie standfest empirische Untersuchungen über die Auswir- kungen des Korporatismus auf makro-ökonomische Leistungsfähigkeit, Einkom- mensverteilung und -umverteilung sind. Zu den besonders erwähnenswerten Schluß- folgerungen dieses Discussion Papers gehören: (1) Trotz immer noch bestehender Mängel haben sich quantitative Koporatismusmaße in den letzten Jahren als stich- haltig erwiesen. (2) Die Anwendung konstanter Variablen ist nicht mehr sinnvoll.
(3) Summarische Korporatismusindikatoren werden zwar oft verwendet, doch ihre Erfinder und Anwender bleiben eine einleuchtende Erklärung schuldig, warum kor- poratistische Effekte besser durch aggregierte Gesamtmaße als durch sachlich ge- nauere Einzelindikatoren erklärt werden sollten. (4) Alles weist darauf hin, daß eini- ge Aspekte oder Formen des Korporatismus mit Lohnzurückhaltung, niedriger In- flation, höherer Beschäftigung und weitgehender Einkommensgleichheit in den 70er und 80er Jahren korrelieren. Die Ergebnisse variieren jedoch stark, je nachdem, wel- cher Indikator zugrunde gelegt wurde, und wenig stützt die allgemeine Vermutung, daß der Korporatismus vor allem durch Lohnzurückhaltung die Arbeitslosigkeit mindert.
Contents
1 Introduction 5
2 An Overview of Existing Indicators 6
2.1 Interest Group Organization 7
2.2 Wage Setting/Bargaining Arrangements 8
2.3 Interest Group Participation in Policy Making 10
2.4 Political-Economic Consensus 10
2.5 Composite Measures 10
3 What Characteristics Should Quantitative Indicators
of Corporatism Have? 11
3.1 Subjective vs. Objective 11
3.2 Coverage of Countries 12
3.3 Constant vs. Time-Varying 13
3.4 Coverage of Years 14
3.5 Level of Measurement 14
3.6 Composite vs. Narrow Measures 15
4 How Closely Do the Indicators Correlate with One Another? 17
5 Effects on Macroeconomic Performance 21
6 Effects on Income Distribution and Redistribution 29
7 Conclusion 32
Appendix A 42 Quantitative Indicators of Corporatism 36 Appendix B Related Indicators of Labor Organization and
Wage Setting Arrangements 43
Appendix C Additional Variables Used in the Regression Analyses 43
References 45
1 Introduction
After being “almost universally regarded as defunct” (Ferner and Hyman 1998:
xii) in the early 1990s, corporatism is back in the limelight. Despite its genuine if sometimes overstated decline in perhaps its most celebrated national context, Sweden, corporatism’s prominence and stature have rebounded considerably in recent years. Corporatist pacts dealing with issues such as wage growth and em- ployment have played a key role in two countries commonly viewed as European economic success stories over the past decade – the Netherlands and Ireland.
Similar pacts have been forged or renewed in Norway, Finland, Belgium, and It- aly, while less explicit variants of corporatism continue largely unabated in na- tions such as Austria, Germany, and Switzerland. Not surprisingly, these devel- opments have rejuvenated academic interest in the topic (e.g., Hassel and Ebbing- haus 2000; Pochet and Fajertag 1997; Regini 2000; Visser and Hemerijck 1997).
Quantitative measures of corporatism have played a central role in the corporatist literature since the early 1980s. There have been several dozen attempts to score or rank the 18 or so most affluent OECD countries on a corporatism scale, in- cluding a number of composite indexes which aggregate other scorings. This pa- per offers a survey and assessment of 42 quantitative corporatism indicators.
The paper has several aims. One is simply to provide an inventory of existing in- dicators, which have grown so numerous as to perhaps overwhelm even sea- soned researchers in the field. Section 2 of the paper provides an overview of the 42 indicators, and each is described in detail in Appendix A. The coverage here is not fully exhaustive. I have, however, attempted to include what in my view are the most prominent and/or useful indicators in the literature. I make no attempt to add to the already long list of definitions of corporatism. Doing so seems fruit- less – the literature is now far too varied, as two examples (picked somewhat at random) from recent studies will attest. One, by Franz Traxler (1999: 56), is quite brief: “Corporatism means that the state shares its public-order function with or- ganized business and labor.” The other, by Alan Siaroff (1999: 177–179) in the same journal and year, is so lengthy it cannot be reprinted here; it includes 22 elements, ranging from labor and business centralization to low industrial con- flict to state activism to political consensus. Instead of offering a new definition of corporatism or selecting my preferred existing one, I consider quantitative indi- cators of anything that is explicitly or implicitly referred to by its creator or users as corporatism. All of the indicators I examine are available in a Microsoft Excel file, which can be downloaded from the web page of the Max Planck Institute for the Study of Societies (Cologne, Germany) at http:/ /www. mpi-fg-koeln.mpg.de or from my homepage at http:/ /www.emory.edu/SOC/lkenworthy.
The second aim is to examine the trustworthiness and utility of the various in- dictors. There has been considerable development in this field in recent years, with an array of new measures appearing. But are the newer indicators superior to earlier ones? If so, in what ways? And are some of the newer indicators prefer- able to others? In section 3 I discuss some characteristics useful indicators of cor- poratism should have and examine the degree to which existing measures have those characteristics. In section 4 I explore the correlations between the various indicators.
The third aim is to test the robustness of findings in this field. Like their counter- parts in many other areas, students of corporatism have not always paid suffi- cient attention to the impact of indicator choice on empirical results. In section 5 of the paper I assess the relative utility of the indicators in accounting for cross- country differences in macroeconomic performance in the 1970s and 1980s. In section 6 I do the same for income distribution and redistribution.
2 An Overview of Existing Indicators
Developments in the quantification of corporatism have been shaped by devel- opments in the corporatist literature’s analytical focus. Early studies, from the mid-1970s to the early 1980s, were conducted primarily by scholars who were (at that time) interested in corporatism per se. Later studies, those since the mid- 1980s or so, have tended to be by scholars interested specifically in corporatism’s economic (and sometimes political) performance effects. This shift in emphasis generated a shift from general definitions of corporatism to a focus on income policies and wage setting. The most notable early quantitative measures of corpo- ratism were those of Schmitter (1981) and Lehmbruch (1984), which focused on, respectively, the organization of interest groups and the participation of such groups in policy making. Measures developed beginning in the mid-1980s by, e.g., Cameron (1984), Bruno and Sachs (1985), and Calmfors and Driffill (1988) turned the focus toward centralization and concentration of unions and wage setting. Within the focus on wage setting, Soskice (1990) then instigated some- thing of a turn toward measures of wage coordination.
Existing indicators of corporatism can be grouped into four categories according to their main focus: (1) interest group organization; (2) wage setting arrange- ments; (3) interest group participation in policy making; (4) political-economic consensus. A fifth category consists of composite (i.e., aggregated) measures. This section offers an overview of existing indicators in each of these categories.
2.1 Interest Group Organization
Philippe Schmitter, who instigated the modern renaissance of interest in corpora- tism in the mid-1970s (Schmitter 1974), conceptualized corporatism as a mode of interest group organization (“interest intermediation”). There are two chief di- mensions to such organization: centralization and concentration. And there are two principal interest groups of concern: labor and business.
Union centralization refers to the authority that union confederations have over their members. This authority may vary, of course, depending on the issue or arena. There are two existing indicators of union centralization: one by David Cameron (1984) and the other by Schmitter (1981). Both are subjective, time- invariant measures. To these I here add a third indicator, utilizing data from the
“Union Centralization among Advanced Industrial Societies” data set assembled by Miriam Golden, Michael Wallerstein, and Peter Lange (1997, henceforth
“GWL”). This new measure is based on objective, time-varying information on the powers and capacities of the main union confederation in each country – spe- cifically, whether or not the confederation has power to appoint affiliates, to veto wage agreements by affiliates, to veto strikes, and whether or not it has its own strike funds.
Union concentration, which is sometimes referred to as associational monopoly, has two elements: across confederations and within confederations. The former refers to the extent to which union members belong to a single confederation rather than being divided among multiple confederations. The latter refers to the extent to which the membership of union confederations is concentrated within a small number of affiliates rather than being spread out across a large number of affiliates. Schmitter (1981) and Cameron (1984) each provided subjective, time- invariant measures of overall union concentration in the early 1980s. More re- cently, objective, time-varying data for each of these two facets of concentration have been assembled by Golden, Wallerstein, and Lange (1997).
A third dimension of labor organization is union density – the share of employees who are union members. Because this is never treated by itself as a measure of corporatism, I do not include it among the indicators examined here. It is, how- ever, sometimes used in composite corporatism indicators, so I include it in the data set (see Appendix B).
To my knowledge there is only one existing quantitative measure of business cen- tralization or concentration, by Hicks and Kenworthy (1998). It is a subjective, time- varying measure of business organization, combining the degree of concentration among business confederations and the degree of centralized authority of confed- erations over their members. To this I here add a second measure, constructed
from several variables in the GWL data set. It is an indicator of employer centrali- zation based on objective, time-varying data on the existence of a peak employer confederation and the powers and capacities of the confederation. The latter in- clude the power of appointment of affiliates, veto over wage agreements, veto over lockouts, and having its own conflict funds.1
2.2 Wage Setting/Bargaining Arrangements
Wage setting or bargaining arrangements have always been prominent in the corporatism literature, as wage formation is one of the areas in which organized interest groups have been most extensively and regularly involved in decision making. Initially some researchers used union centralization and/or concentra- tion as a proxy for wage arrangements, but many soon turned to creation and use of indicators of the structure of wage bargaining itself. Such indicators focus on either the centralization or the coordination of the wage formation process. All are (at least partly) subjective.
Cameron (1984) and Calmfors and Driffill (1988) each offered time-invariant measures of the degree of wage bargaining centralization. Cameron’s measure is an index ranging from 0 to 1, paralleling his measures of union centralization and concentration; Calmfors and Driffill’s is a rank-ordering. More recently an OECD (1997) study offered a wage centralization index ranging from 1 to 3, measured in the years 1980, 1990, and 1994. The GWL data set includes three time-varying measures: (1) an index of union confederation involvement in wage bargaining;
(2) an index of government involvement in wage setting; (3) a summary index of the degree of wage setting centralization. Since centralization can result from ei- ther bargaining between union and employer confederations or from government involvement (participation in bargaining, imposition of a wage schedule or freeze, mediation, arbitration), or both, the first two of these three indicators are combined to yield the third. Among the various wage centralization indicators, the GWL summary centralization index is the only one that explicitly measures the centralization of wage setting by taking into account situations in which there is government-imposed centralization; others are measures of the centralization of wage bargaining. (For ease of explication, however, I use the terms setting and bargaining more or less interchangeably in later sections of this paper.) Torben Iversen (1998) has created a time-varying measure that incorporates both the level of bargaining and the share of workers covered at each bargaining level. The GWL and Iversen indicators take into account whether or not wage agreements
1 After creating this measure I discovered that a similar one has been created by Duane Swank and Cathie Jo Martin (2000).
reached at central or industry levels include sanctions, such as a peace obligation (which prohibits strikes), which limit the ability of lower-level bargainers to cir- cumvent the agreement. Thus, for instance, the GWL summary centralization in- dex has four categories: 1 = plant-level wage setting; 2 = industry-level wage set- ting; 3 = centralized wage setting without sanctions; 4 = centralized wage setting with sanctions. Franz Traxler and Bernhard Kittel (2000) instead create two dis- tinct measures, separating the formal bargaining level from the existence of sanc- tions. One is an index of the degree of wage bargaining centralization that does not take sanctions into account. The other is a dichotomous measure of “bar- gaining governability,” which refers to the presence or absence of such sanctions.
In an influential 1990 article, David Soskice (1990) argued that the focus of those interested in effects of wage setting/bargaining should be on coordination rather than centralization. Centralization is only one means, albeit an important one, of achieving wage coordination. Others include guidance of industry bargaining by a powerful, monopolistic union confederation (as in Austria), a high degree of union concentration plus extensive pattern-setting (as in Germany), and coordi- nation by employer federations with limited union influence (as in Japan and Switzerland). Coordination was the focus of Crouch’s (1985) earlier dichotomous indicator of wage bargaining arrangements, though he did not make explicit the points emphasized by Soskice. Soskice himself offered coordination scores, but for only 11 countries. The Soskice scores have been updated and extended to a larger set of countries by Layard, Nickell, and Jackman (1991; Layard and Nickell 1994; Nickell 1997) and by Hall and Franzese (1998). There are three time-varying indicators of wage coordination. One is an OECD measure, which is available only for 1980, 1990, and 1994. The second is my own (Kenworthy 2000), which is a revised and updated version of an earlier measure used in Hicks and Kenworthy (1998). These scores draw heavily on the GWL summary index of wage setting centralization for countries in which coordination is achieved primarily via cen- tralization and on Soskice’s logic for nations in which it is achieved in other ways.
The third time-varying indicator is a categorical measure by Traxler and Kittel (2000), which identifies the type of wage coordination in each country without attempting to create a rank-ordering or scale.
Also relevant to wage arrangements is the share of the workforce that is covered by collective bargaining agreements. In some nations this figure is essentially the same as the share that belong to unions, but in others extension laws or practices make the coverage rate much higher than the unionization rate (Traxler 1996).
Like union density, the coverage rate is never treated as an indicator of corpora- tism per se, but since it is very closely related I include it in the data set (see Ap- pendix B).
2.3 Interest Group Participation in Policy Making
Although much of the focus in the corporatism literature has been on wage bar- gaining, many scholars have conceived of corporatism as participation by organ- ized interest groups in various types of public policy making.2 Surprisingly, however, to my knowledge only two attempts have been made to quantify this broader conception. Both focus on participation by one of the major interest groups, labor, in one type of policy arena, economic policy. Both are subjective.
The first indicator is Gerhard Lehmbruch’s (1984) time-invariant measure of un- ion participation in economic policy making, which includes but is not limited to wage setting. This follows from Lehmbruch’s focus on policy concertation as the core of corporatism. The other is Hugh Compston’s time-varying measure of un- ion participation in economic policy making exclusive of wage setting. Compston excludes wage setting arrangements “because these represent government par- ticipation in union policy making rather than union participation in government policy making” (736).
Unfortunately, there is no existing indicator of business participation in policy making. The issue here is of course participation by organized business – i.e., em- ployer confederations – rather than by individual firms.
2.4 Political-Economic Consensus
Some analysts consider political and/or economic consensus to be a key compo- nent of corporatism (e.g., Katzenstein 1985; Keman 1984; Schmidt 1982). This is obviously a tricky concept to operationalize. Although several composite indica- tors include consensus as an element, I am aware of only two indicators that fo- cus on consensus alone: a dichotomous measure by McCallum (1983, 1986) and a three-category index by Paloheimo (1984). Both are time-invariant, and both rely heavily on strike rates.
2.5 Composite Measures
I include 13 composite measures here: from Alvarez, Garrett, and Lange (1991), Bruno and Sachs (1985), Cameron (1984), Hicks and Kenworthy (1998), Hicks and
2 In Schmitter’s (1982: 262–263) early conceptualization, this was “corporatism 2” or
“concertation,” with “corporatism 1” referring to interest group organization.
Swank (1992), Keman (1984), Lehner (1988), Lijphart and Crepaz (1991), Schmidt (1982), Schmitter (1981), Swank (2000), Tarantelli (1986), and Western (1997).
There are others, but these 13 seem to be a reasonably representative sample.
Some are relatively narrow. Those of Cameron and Schmitter, for instance, are es- sentially just aggregations of their union centralization and concentration meas- ures. Others, such as those of Bruno and Sachs, Hicks and Swank, and Schmidt, combine four or more elements. The Lijphart-Crepaz measure is an unabashedly atheoretical aggregation of a dozen previous measures.
3 What Characteristics Should Quantitative Indicators of Corporatism Have?
I suggest in this section that an ideal corporatism indicator would be: (1) based on careful scrutiny of extensive data, though in most instances relying in part on subjective judgment; (2) scored for all of the 18 countries commonly used in quantitative comparative research; (3) time-varying, with annual measurement;
(4) scored for the years 1960 up to the very recent past; (5) a scale measure rather than a rank ordering; (6) narrowly-targeted rather than an aggregation of various elements. Only one of the 42 indicators meets all of these criteria, and very few meet most of them.
3.1 Subjective vs. Objective
Objective measures of political-economic institutions are almost always prefer- able, but they are frequently impossible to create. Government partisanship can be measured in a relatively objective fashion – as, e.g., the share of cabinet seats held by parties of the left (though definitions of “left” can certainly differ). But creating quantitative indicators for many other institutions, such as state struc- ture or central bank independence, tends to require judgment. The same is true for most indicators of corporatism. The GWL measures of union concentration are one exception, and they represent a clear improvement over earlier subjective measures. But in scoring wage coordination or centralization, union participation in policy making, or consensus, an element of subjectivity is unavoidable. The two indicators of consensus partially escape subjectivity because they are based largely on strike frequency data. Yet judgment nonetheless enters in the decision about where to draw the lines between high and low categories. Moreover, by measuring consensus using what is presumably an effect of it, low strike fre-
quency, this type of measure loses some conceptual utility. (It is also worth not- ing that strike data are somewhat problematic due to distortions and context- dependent measurement problems; see Shalev 1978.)
Although virtually all corporatism indicators are subjective, they are not all equally valid. There is a substantial difference between scorings that are (by choice or necessity) somewhat impressionistic and those based on a wealth of detailed and reliable information. In this respect, recently developed indicators are likely to be superior to earlier ones. Information about interest group organi- zation, wage setting arrangements, and participation by unions in policy making is much more extensive and readily available today than was the case a decade or two ago. Thus, the wage centralization indicators of GWL, Iversen, and Traxler- Kittel are almost certainly more accurate than those of Cameron or Calmfors- Driffill. The same is true of Compston’s scores for union participation in eco- nomic policy making as compared to Lehmbruch’s.
3.2 Coverage of Countries
There are 19 countries that have a population of at least 3 million, have a level of per capita GDP at least half that of the United States, and have been continuously democratic throughout the post-World War II period. One of these, Israel, is not a member of the OECD and thus lacks comparable data for many of the variables of interest in quantitative analysis. The other 18 comprise the nations commonly used in quantitative analyses involving corporatism: Australia, Austria, Belgium, Canada, Denmark, Finland, France, Germany, Ireland, Italy, Japan, the Nether- lands, New Zealand, Norway, Sweden, Switzerland, the United Kingdom, and the United States.
Unfortunately, many of the existing indicators – 27 of the 42 assessed here – do not cover the full set of 18 countries. Ireland is the most frequently missing na- tion, followed by New Zealand. There are, of course, widely differing views about the scores some of these countries should be assigned on various subjective corporatism measures. But there is seldom a persuasive rationale for a priori ex- clusion of a country from the scoring. Lack of adequate data is certainly one rea- sonable justification, but that does not appear to have been the cause in most in- stances.
3.3 Constant vs. Time-Varying
It has frequently been argued by creators or users of quantitative corporatism in- dicators that corporatism, like many other institutions, is “sticky” over time and is thus appropriately treated as constant. For example, in an earlier article in which I used Cameron’s index of union concentration to predict cross-country variation in inflation, I wrote (Kenworthy 1996: 505–506):
Analyses of the relationship between labor organization and economic perform- ance typically assume that the former is constant over time. Recent research sug- gests that this is a reasonable assumption. There has indeed been relatively little change in labor movement concentration in these 15 nations during the past sev- eral decades. Change has occurred in some countries, but developments have off- set one another so that the overall degree of concentration has not shifted. In Sweden and the other Nordic nations, for instance, the share of union members accounted for by the largest confederation has declined in the 1980s; at the same time, the number of affiliates to the major confederations has decreased. I there- fore follow the pattern in the literature of using a uniform labor organization in- dex across the various time periods.
This was not an unreasonable argument to make, because the GWL data (which were not available at the time that article was written) suggest that union con- centration has indeed been fairly stable over time in many countries. Yet it has not been completely stable. And some other key elements (or types) of corpora- tism, such as wage setting arrangements and union participation in policy mak- ing, have changed quite a bit over time in some countries.
Relatively few of the existing indicators of corporatism vary over time; only 18 of the 42 indicators assessed here do. There is no time-varying measure of consensus and only two such composite measures.3 Of the 18 time-varying indicators, 14 are measured annually.
Given the availability of time-varying corporatism indicators, there is no longer much justification for creating or using measures that do not incorporate change over time. Several studies have found that the effects of corporatism appear to vary across different periods (e.g., Crepaz 1992; Kenworthy 1996; Kittel 1999). But if a time-invariant indicator of corporatism is used, it is impossible to know whether such a finding owes to changes in corporatist effects or rather to (un- measured) changes in the degree of corporatism itself.
Time-invariant indicators are also suspect in terms of trustworthiness, as they are less likely than time-varying measures to be based on careful attention to fine
3 A third time-varying composite measure has recently been created by Pennings and Vergunst (2000). However, I do not have access to these data.
details of institutional arrangements such as corporatism. Such attention is neces- sary in the creation of time-varying scores, in order to know whether a change has occurred from one year to the next. Time-invariant indicators are more likely to be based on an overall “feel.” Indeed, many time-invariant indicators appear to have been created as such precisely because lack of information rendered the as- signment of scores for each individual year impossible. This is not inherently the case; it is certainly possible for time-varying scores to be based as much or even more on feel or speculation as time-invariant ones. But all else being equal, it seems reasonable to presume the superiority of those that vary over time in this respect.
3.4 Coverage of Years
If the effects of corporatism do change over time, and if researchers are to have some hope that their analyses may impact policy, it is vital that we be able to ex- amine the very recent past. Unfortunately, at the time of this writing (July 2000), the most recent year for which any of the existing corporatist indicators is avail- able is 1994. The lone exception to this is the Kenworthy measure of wage setting coordination, which goes through 1999. However, several improvements are on the horizon. Michael Wallerstein is planning to update the data for some of the GWL measures, and those data will be publicly available as soon as the update is completed. Also, although the Traxler-Kittel data on wage centralization and co- ordination only go up to 1990, the project from which those data are drawn – the Project on “Internationalization, Labor Relations, and Competitiveness,” directed by Franz Traxler (henceforth “ILC”) – has data for these and other related indi- cators through 1996. The full ILC data set will be made available for public use sometime after the publication of a book based on the data (Traxler, Blaschke, and Kittel forthcoming).
It is also worth noting that several of the time-varying corporatism indicators – those of Iversen, Traxler-Kittel, and Compston – begin only in the early 1970s.
Given that OECD data for most measures of economic structure and performance begin in 1960, this limits analysis somewhat.
3.5 Level of Measurement
A number of corporatism indicators during the initial wave of quantification in the early 1980s were rank orderings, while more recent indicators have typically been scale measures. When treated as scale variables, as they frequently are in
statistical analyses, rank orderings have the potential disadvantage of artificially inflating the degree of variation between countries on the high and low ends.
However, this is not generally a problem for corporatism studies, in which the interest is typically in the existence and direction of effect rather than its precise magnitude. More problematic for rankings is that they are difficult to keep con- sistent for a measure that varies over time. In this respect scale measures are clearly preferable.
There has been a strong preference in the literature for indicators that treat varia- tions in corporatism as differences of degree rather than of type. Thus, all but four of the indicators included here are either scale or rank-ordered measures. Three of the four exceptions are dichotomous and therefore can be treated as scale measures with only two levels. The fourth is Traxler and Kittel’s measure of wage coordination. This is a categorical (i.e., nominal) measure with six categories: in- ter-associational coordination, intra-associational coordination, pattern-setting, state-imposed coordination, state-sponsored coordination, and no coordination. It is useful to separate these alternative sources of wage coordination, and Traxler and Kittel provide scores for the modal value for each country in each year cov- ered by the data. Yet they go further to offer a provocative argument that calls into question much of the past decade’s research on the effects of wage coordina- tion: “If there are qualitatively differing coordination forms, any attempt to con- struct an ordinal scale of bargaining coordination becomes pointless.” This does not strike me as compelling, any more than it would to suggest that because there are different religions it is pointless to construct an ordinal or scale measure of religiosity. It is certainly not immediately obvious whether, for example, pattern- setting led by IG Metall in Germany amounts to more or less coordination than does centralized wage setting without a peace obligation in Finland. But to the extent that wage coordination is suspected to have real economic effects, it seems worth the effort to try to make such judgments, as Soskice (1990), Layard, Nickell, and Jackman (1991), the OECD (1997), Hall and Franzese (1998), and Kenworthy (2000) have done.
3.6 Composite vs. Narrow Measures
Composite indicators of corporatism are widely used in quantitative research. I examine 13 such measures here. Elements that have been aggregated to form these composite measures include, among others, union centralization, union concentration, union density, employer centralization, shop-floor autonomy, the presence of works councils, frequency of strikes, union participation in policy making, left party political strength, societal consensus, and commitment to a partnership ideology. Sometimes these measures are summed or averaged, some-
times they are combined using different weights, and in other instances the com- posite measure is based on the results of factor analysis.
There is an obvious logic to such aggregation. Most theoretical discussions and qualitative analyses of corporatism treat it as a multidimensional concept. In at- tempting to quantify corporatism while remaining true to the theoretical and qualitative literatures, it is therefore tempting to aggregate. The temptation is ac- centuated by the fact that the small number of cases – 18 or fewer – used in the typical cross-sectional regression analysis of corporatist effects allows for inclu- sion of very few independent variables. Furthermore, a number of the elements that tend to be combined are highly correlated with one another: countries with centralized unions tend to have centralized employers, strong left parties, low strike rates, and so on.
Yet the use of composite measures in quantitative analysis may hide more than it reveals. As Robert Flanagan (1999: 1167–1168) has noted: “The focus on a single aggregated measure may obscure the exact effect of common institutional factors producing the correlation and at the same time may suggest an influence on eco- nomic outcomes for some elements of the index that have no influence at all.”
Narrowly-targeted measures may therefore be preferable. Consider, for instance, the well-trod question of whether or not corporatism yields lower unemploy- ment. There are at least three channels through which a straightforward effect (i.e., ignoring nonlinearities and interactions with other institutions such as gov- ernment partisanship or central bank independence) of this type might occur:
1. Corporatism generates wage restraint, which yields lower unemployment;
2. Corporatism generates government commitment to low unemployment, and the resulting policy efforts are at least somewhat successful in achieving it;
3. Corporatism leads to less rent seeking, which yields a healthier overall eco- nomic climate, including lower unemployment.
A composite measure is unable to distinguish between these three channels, and may in fact be conceptually inappropriate for examining any of them. Instead, the first channel should be examined with an indicator of wage setting arrangements, the second with an indicator of union participation in economic policy making, and the third with indicators of labor and/or business organization.
Methodological constraints no longer necessitate the use of composite measures, if they ever did. The recent development of time-varying corporatism measures enables use of pooled cross-section time-series regression, which substantially in- creases the number of observations and thereby alleviates the need for hyper- parsimony in the choice of explanatory variables. Because pooled regressions es-
timate coefficients that are constant across years or periods, they may ignore changes in effects over time (Kittel 1999). But this can be remedied by judicious use of interaction terms or analysis of individual years or periods.
Where corporatism serves merely as a control variable in analyses that focus on other aspects of the political economy, there seems little harm in utilizing a com- posite measure. But otherwise the preference, in my view, should be for nar- rowly-targeted indicators.
4 How Closely Do the Indicators Correlate with One Another?
How accurate are these indicators? This is in part a theoretical issue, but one way to get a partial answer is to see how closely they correlate with one another. Table 1a shows the correlations between all of the indicators included here except the Traxler-Kittel measure of wage coordination, which is categorical. For the indi- cators that vary over time I have used a period average over 1974–1989. Table 1b shows correlations among the time-varying indicators using annual data.
Among the interest group organization indicators, a number of findings are worth highlighting. First, the three union centralization measures correlate fairly closely with each other (.62 to .84). Second, by contrast, although the Cameron and Schmitter measures of union concentration are highly correlated with one another (.84), neither is very strongly correlated with either of the two objective GWL measures (.09 to .45). This casts doubt on the validity of the former. Second, concentration across union confederations (GWLCONC1) is weakly or negatively correlated with every other corporatism indicator. This is due largely to the exis- tence of only a single main union confederation in several nations in which inter- est group organization is otherwise relatively minimal – Australia, the United Kingdom, and the United States. Fourth, the new time-varying measure of union centralization I have created based on the GWL data is very weakly correlated with both of the time-varying GWL measures of union concentration (.14 and .18). This contrasts with the moderate-to-strong correlations between the Cam- eron and Schmitter measures of union centralization and concentration (.50 to .77). It suggests that these two dimensions of labor organization may be less similar empirically than has heretofore been believed. Fifth, the two business or- ganization indicators correlate strongly (.82), despite the fact that one is a meas- ure of centralization alone while the other incorporates both centralization and concentration. Interestingly, however, the correlations between these measures of business organization and the time-varying measures of union centralization and
union concentration within confederations are weak to moderate (.34 to .57). That suggests only moderate support for the common presumption that business and labor organization tend to go hand in hand (e.g., Schmitter and Streeck 1999; Ste- phens 1979).
There are six true measures of wage centralization – if we exclude the GWL measures of confederation and government involvement, which are combined to form the GWL summary indicator, and the Traxler-Kittel measure of bargaining governability. If one desires a single measure of the level of wage setting, the GWL summary centralization index seems likely to be the most useful of the six.
Unlike the Cameron, Calmfors-Driffill, and OECD wage centralization indicators, it is measured annually and thus incorporates changes in wage setting arrange- ments from year to year, which are not uncommon. Unlike the Traxler-Kittel centralization indicator, it takes into account the existence (or lack thereof) of a peace obligation, which surely affects the degree to which local bargaining alters wage agreements at the central or industry level. And unlike both the Traxler- Kittel and Iversen centralization indicators, it incorporates government-imposed wage schedules/freezes. One might reasonably argue that this latter feature makes the GWL measure less useful as an indicator of corporatism, since such government imposition does not involve participation by labor and/or business.
But it surely makes it a more accurate indicator of the level of wage setting.
The Calmfors-Driffill wage centralization indicator has been by far the most commonly used in studies of corporatism’s impact on economic performance. But its merits have been questioned (Traxler and Kittel 2000). It correlates relatively strongly with the Cameron, OECD, and Iversen measures but only moderately with the GWL and Traxler-Kittel measures. The most directly comparable indi- cator to Iversen’s in terms of conceptual intent is the GWL measure of union con- federation involvement in bargaining. Yet the two correlate at only .75. This is likely because the Iversen scores incorporate the share of workers covered at each bargaining level. In this respect it is the more precise of the two.
The six wage coordination indicators (the Traxler-Kittel measure is excluded be- cause it is categorical) correlate fairly strongly with one another. In particular, the Soskice, OECD, Hall-Franzese, and Kenworthy indicators correlate with each other at .89 or better. This is not too surprising, as the latter three all draw heavily on Soskice (1990). Among these, the Kenworthy indicator has the advantage of being measured annually.
In general the wage centralization indicators are only moderately and sometimes very weakly correlated with the coordination indicators. For instance, the GWL centralization index correlates between .32 and .52 with the six coordination indi-
ations between Corporatism Indicators12345678910111213141516171819202122232425262728293031323334353637383940NT.84.74.62.75.77.62.50.59.59.84-.20-.02.14.27.17.60.41.18.09.45-.53.72.55.52.62.61-.37.57.47.55.34.45.55-.43.54.82.70.89.65.65.78-.03.33.37.56.75.82.72.80.82.00.36.63.68.81.65.74.38.37.61-.15.33.35.59.80.75.51.57.37.52.31-.24-.07.40.45.55.62.65.63.56.29.53.32.03-.04.09.06.49.54.48.63.45.59.41.36.27-.37.17.38.47.57.59.63.79.75.76.79.55.80.72.03.31.58.52.74.86.75.75.71.72.26.53.33.40.33-.19.07.32.54.66.62.66.79.63.85.74.55.46.31.61.72.13.34.33.27.47.50.41.33.38.31.65.33.70.66.48.63.86-.11.69.71.66.69.70.54.31.22.34.68.40.71.83.56.51.57.52-.31.65.91.52.34.52.27.37.33.38.71.37.64.64.76.66.60.72.78-.30.53.86.76.61.86.64.58.34.52.79.44.54.83.82.70.51.41.61.56-.13.59.82.59.34.64.41.32.24.32.71.37.35.62.91.78.80.66.61.65.73-.29.65.92.73.52.74.51.47.23.46.75.35.53.82.94.94.87.85.70.53.60.60-.26.66.81.57.45.66.46.41.41.50.76.36.42.64.97.77.91.89.82.87.68.52.74-.44.76.79.77.86.76.61.39.24.46.65.40.26.79.87.75.74.79.82.50.72.65.44.59.15.12.50.06.78.42.41.31.23.29.60.37.56.56.77.49.48.61.69.52.42.61.46.46.32-.13.72.72.49.19.37.13.07-.12.10.39.04.40.66.90.54.70.75.70.73.42.43.72.48.48.34-.29.83.71.52.22.47.23.09-.05.16.42-.03.40.65.89.64.74.80.75.79.31.92.72.82.72.76.84.02.32.52.59.95.88.80.62.53.64.80.62.54.71.41.73.42.68.58.82.75.28.33.68.67.64.68.78-.09.74.77.66.62.75.43.29.21.37.68.39.59.89.74.79.72.84.74.88.51.82.81.62.71.90.78.79.83.04.23.60.61.88.87.72.64.46.58.81.55.46.65.48.78.50.73.62.77.61.35.39.98.66.82.66.61.64.69-.41.63.96.82.50.76.51.50.25.51.70.36.38.76.92.94.84.96.85.83.52.67.75.66.80.72.74.78.69.72.75-.11.23.60.64.72.87.74.75.50.62.80.42.52.65.47.83.46.74.59.64.42.33.43.92.61.95.73.79.71.71.60.72-.21.66.75.62.59.76.55.48.29.50.76.36.64.83.86.86.72.92.80.75.68.75.82.71.88.72.83.75.72.61.72.37.43-.23.71.65.45.37.41.32.28.26.36.61.29.39.57.88.53.78.75.89.80.72.77.73.46.65.43.66.37.73.88.84.37.65.80-.22.71.84.72.70.79.55.43.30.47.74.37.47.86.82.86.77.91.85.95.64.77.82.77.91.79.90.75.89.75.80.62.53.55.59-.15.58.74.48.38.53.37.40.21.34.69.21.53.64.92.72.80.89.88.65.69.79.81.57.69.60.77.61.87.89.79.83.81.69.87.93.05.40.77.50.81.85.55.58.60.42.89.39.73.81.81.85.75.86.83.76.62.57.63.82.79.86.82.83.83.67.89.83.55.77.62.66.57-.13.11.50.52.77.79.75.83.68.87.85.77.43.50.44.70.41.60.56.58.56.14.18.89.51.86.63.86.63.38.62.46.67.63.41.45.85.68.13.52.68.32.30.58.16.18.13.02.59.11.55.66.80.68.80.78.74.57.51.72.72.35.74.49.67.44.68.67.69.79.85.26.78.72.65.79.86-.14.57.87.77.61.85.55.42.30.45.74.34.48.79.73.90.75.89.79.79.43.61.67.78.85.83.92.78.78.54.89.69.88.65.74nding upon the indicators being correlated. For time-varying measures a period average over 1974–1989 is used. TKCOOR is not included because it is a categorical measure. For indicator descriptions
cators. This suggests that these two types of measure are not interchangeable; it may matter a great deal in terms of empirical findings which of the two is used.
Conceptually, centralization measures seem closer to the essence of what most analysts consider to be corporatism, but coordination seems more likely to be re- lated to wage restraint and thus to macroeconomic performance outcomes (see, e.g., Flanagan 1999; Soskice 1990; Traxler and Kittel 2000).
As noted earlier there are only two indicators of union participation in policy making, by Lehmbruch and Compston. Given that the Compston measure varies over time and appears to be based on more careful scrutiny of policy making pro- cesses, the .52 correlation between them casts serious doubt on the validity of the Lehmbruch measure, which has been fairly widely used in the literature. Then again, the Lehmbruch indicator includes wage setting as one of the types of pol- icy making in which unions may participate whereas the Compston measure ex- cludes wage setting. This difference could conceivably account for the low corre- lation. The correlations between the Compston indicator and the measures of in- terest group organization and wage setting are not especially strong. They are stronger for the Lehmbruch indicator, probably because it includes wage setting.
In contrast, the two indicators of economic consensus are highly correlated with each other. Interestingly, although they differ widely in the elements they aggre- gate, the composite indicators are generally strongly correlated with one another.
Of the 78 correlations among the composite indicators, 46 are larger than .70 and only nine are below .50.
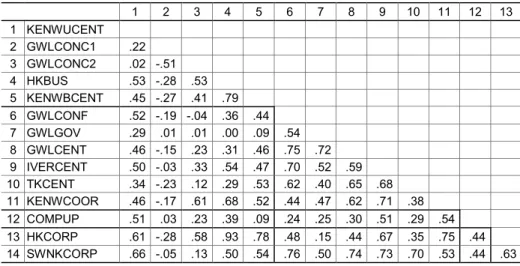
Finally, the correlations among the time-varying indicators based on annual data, shown in Table 1b, are generally consistent with those based on 1974–1989 period averages in Table 1a.
Table 1b Correlations between Time-Varying Corporatism Indicators Using Annual Data
1 2 3 4 5 6 7 8 9 10 11 12 13
1 KENWUCENT
2 GWLCONC1 .22
3 GWLCONC2 .02 -.51
4 HKBUS .53 -.28 .53
5 KENWBCENT .45 -.27 .41 .79 6 GWLCONF .52 -.19 -.04 .36 .44
7 GWLGOV .29 .01 .01 .00 .09 .54
8 GWLCENT .46 -.15 .23 .31 .46 .75 .72 9 IVERCENT .50 -.03 .33 .54 .47 .70 .52 .59 10 TKCENT .34 -.23 .12 .29 .53 .62 .40 .65 .68 11 KENWCOOR .46 -.17 .61 .68 .52 .44 .47 .62 .71 .38 12 COMPUP .51 .03 .23 .39 .09 .24 .25 .30 .51 .29 .54 13 HKCORP .61 -.28 .58 .93 .78 .48 .15 .44 .67 .35 .75 .44 14 SWNKCORP .66 -.05 .13 .50 .54 .76 .50 .74 .73 .70 .53 .44 .63 Note: N varies from 51 to 630 depending upon the indicators being correlated. TKCOOR is not included because it is a categorical measure. OECDCENT, OECDCOOR, and LNJCOOR are not included because they are scored in only a few years. For indicator descriptions see Appendix A.
5 Effects on Macroeconomic Performance
Probably three-quarters of the empirical research on corporatism since the early 1980s has involved attempts to assess its effects on macroeconomic performance outcomes (for references see Flanagan 1999; Franzese 1999; Kenworthy 1996). One of the striking features of this literature is the general lack of attentiveness to the potential impact of indicator choice.4 In this section I provide a preliminary as- sessment of the relative utility of the various corporatism indicators in accounting for cross-country variation in macroeconomic performance. Four performance indicators – change in nominal wages, inflation, change in real wages, and unem- ployment – are regressed on each of the corporatism indicators and a set of con- trol variables in each of two time periods, 1974–1979 and 1980–1989. The variables are described in Appendixes A and C.
The predominant notion in the literature has been that corporatism yields lower inflation and/or unemployment by generating wage restraint. The general logic is relatively simple, though specific applications of it can be complex (see, e.g., Franzese 1999; Kenworthy 1996). Where unions are encompassing and/or wage setting is centralized/coordinated, externalities of high wage increases tend to be taken into account by union negotiators, which creates a strong incentive for wage moderation. In fragmented bargaining systems, by contrast, prisoners’ di- lemma-type incentives create pressure for wage militancy. It is somewhat stun- ning that to my knowledge only three studies have actually examined the relation- ship between corporatism and wage changes: Bruno and Sachs (1985), Kenworthy (1996), and Traxler and Kittel (2000). All others have looked only at the relation- ship between corporatism and unemployment/inflation and simply presumed that the hypothesized links between corporatism and wage restraint and between wage restraint and macroeconomic performance exist. I explore these links here.
Inflation is most likely to be affected by increases in nominal wages, while unem- ployment is presumed to be a function of increases in real wages.
Much of the corporatist literature has focused on unemployment, and there are a number of other channels through which corporatism could affect this aspect of macroeconomic performance. First, centralized or coordinated wage bargaining may include a “political exchange” – government efforts to reduce unemploy- ment in exchange for union wage restraint (Pizzorno 1978). If so, indicators of wage centralization or coordination (and also perhaps interest group organiza- tion, consensus, and composite corporatism indicators) may be associated with real wage moderation and low unemployment, but real wage restraint itself
4 I am only marginally less guilty of this than most others – see Kenworthy (1996);
Hicks and Kenworthy (1998).
would not be the direct cause of low unemployment. Second, countries may be constrained (by, e.g., central banks or participation in a hard currency regime) to have low inflation. To ensure the wage restraint necessary to achieve this, nations with less centralized or coordinated wage setting may require higher levels of unemployment (Soskice 1990). If this is correct, indicators of corporatism may be unrelated to wage developments and inflation (neither of which would vary much across countries) but associated with lower unemployment. A third chan- nel shifts the focus away from wage setting to union participation in economic policy making. It asserts that “trade union influence over economic policy leads to more effective policies against unemployment and therefore to lower unem- ployment than would otherwise be the case” (Compston 1997: 733; see also Bore- ham and Compston 1992). If this channel is accurate, we would expect indicators of union participation in policy making to be associated with low unemployment though not with real wage restraint. A fourth suggests that encompassing, or- ganized interest groups reduce rent-seeking, thereby contributing to faster growth and lower unemployment (Olson 1982). If so, indicators of interest group organization should be related to low unemployment but not necessarily to real wage moderation. Finally, a fifth possibility is that consensus is a key to reducing joblessness – via, e.g., real wage restraint, more effective government policies, or less rent-seeking (McCallum 1986). If this is accurate, consensus indicators should be associated with lower unemployment and perhaps also real wage moderation.
In early corporatist studies it was common to assert that corporatism was a rele- vant factor in accounting for cross-national variation in macroeconomic perform- ance in the 1960s, but recent analyses suggest that this was not the case until the mid-1970s (Crouch 1993; Flanagan 1999; Kenworthy 1996). Given that most of the corporatism indicators do not vary over time and that most of the time-varying indicators do not extend beyond the early 1990s, the most reasonable time period to use for the analyses here is 1974–1989. I break this into the two business cycles:
1974–1979 and 1980–1989. Aggregating data within business cycles averts non- comparability (of, e.g., unemployment rates) due to differing phases of business cycles and avoids confounding business cycle and other effects (Kenworthy 1995;
Korpi 1985; Wolff 1996). The results for some of the indicators suggest that effects may have differed across these two time periods, which is the reason for exam- ining them separately.
While most tests have assumed a linear relationship between corporatism and performance outcomes, others have proposed that corporatism’s effects are hump-shaped (Calmfors and Driffill 1988) or interactive with institutions such as left government (Alvarez, Garrett, and Lange 1991), central bank independence (Hall and Franzese 1998), union density (Kittel 2000), or public sector union den- sity (Garrett and Way 1999). However, the hump-shaped and left government interaction hypotheses have found little or no support in follow-up analyses
(Beck et al. 1993; Flanagan 1999; Hicks and Kenworthy 1998; Kenworthy 1996;
Traxler and Kittel 2000). In any case, it is not possible to test a variety of alterna- tive specifications here. Instead, I simply enter each corporatism indicator in a bi- variate regression and then in a multivariate regression with each performance measure in each time period. The relationship in all of the regressions is pre- sumed to be linear. (I do, however, examine the central bank independence inter- action hypothesis; see below.) In the multivariate regressions I include four con- trol variables that have been commonly used in the literature and for which there exists a strong theoretical rationale for expecting a link with inflation and unem- ployment: growth of real GDP, central bank independence, left party govern- ment, and trade. Given the imposition of uniformity and simplicity in model specification, the results of these analyses should be taken as merely suggestive.
The regressions are estimated using ordinary least squares (OLS). I also run re- gressions using annual data for the 10 time-varying indicators that are measured across a reasonable number of years (this excludes the GWL measure of union concentration within confederations and the OECD and Layard-Nickell-Jackman measures of union centralization and coordination) and that contain a nontrivial degree of year-to-year variation (this excludes the two business organization measures). These latter are estimated using random-effects generalized least squares (GLS). This technique helps to control for “unobserved heterogeneity” or
“fixed effects” – a problem inherent to cross-sectional analyses, whereby apparent effects of a variable such as corporatism may actually be due to unmeasured country-specific characteristics such as culture (see Alderson and Nielson 1999).
These regressions include dummy variables for each year in the time period ex- cept one; this focuses on the cross-sectional variation, consistent with the regres- sions using period averages. In principle, the analyses using annual data should yield more trustworthy estimates because they control for unobserved heteroge- neity and because the larger number of observations reduces the likelihood of undue influence by outliers. On the other hand, a disadvantage of using annual data is that effects of institutions such as corporatism may lag, and by different lengths of time in different countries and years. Using period averages reduces the likelihood of misspecifying such lags.
The regression results are shown in Table 2. Consider first the findings for effects of the narrowly-targeted measures on nominal wage changes and inflation. Nei- ther of the two union participation in policy making indicators fares well, but that is not surprising since there is no hypothesized link between this aspect of corpo- ratism and wage restraint. Three of the interest group organization indicators perform impressively: Schmitter’s union centralization index, the GWL index of concentration within union confederations, and the Hicks-Kenworthy business organization measure. The same is true for the two measures of economic consen- sus. By contrast, the wage centralization measures yield unimpressive results.