AQUATIC SCIENCE
ISSN 1608-5914 EISSN 1727-9364 http://dx.doi.org/10.2989/16085914.2012.745806
African Journal of Aquatic Science is co-published by NISC (Pty) Ltd and Taylor & Francis To the best of our knowledge, all the c. 200 known
mormyrid fish species of Africa, including the Mormyrus species of the present study, possess electric organs for communication and electrolocation (reviews by Kramer 1990, Moller 1995, Kramer 1996, Bullock et al. 2005).
These organs are located in the caudal peduncle, which ends in a forked tail fin that provides the main thrust for locomotion. The tail fin is operated by trunk muscles through tendons that pass through the electric organ, which does not itself carry mechanically functioning muscle cells, but is stiffened by Gemminger bones (Taverne 1971, 1972).
Mormyrids are easily recognised in the field by their charac- teristic tail fin shape, and by their swimming mode reminis- cent of pikes (and hence their German common name Nilhechte, Nile ‘pikes’).
Fishes of the genus Mormyrus, which comprises about 24 species, are distinguished from all other mormyrids by their long dorsal and short anal fins (Figure 1). Mormyrus species are relatively large fishes, and therefore of commer- cial interest. In southern Africa a Mormyrus, said to represent M. longirostris Peters 1852, has been identified in a rock painting near Lake McIlwaine (Chivero), Zimbabwe.
Anglers have reported experiencing a mild electric shock when handling this species (Jubb 1967).
Mormyrus species prefer deep water, and are rarely caught in great numbers. A significant body of studies deals with their gonad condition, growth curves, age estimations, reproductive cycle, external morphology and feeding habits
(for example, Iles 1960, Scott 1974, Gilmore 1979, van der Waal 1985, Adebisi 1987, Zaher et al. 1991, Kolding et al.
1992, Kouamélan et al. 1999, Fawole 2002, Authman and Khallaf 2009, Khallaf and Authman 2009, 2010). Successful reproduction in the laboratory was reported by Kirschbaum and Schugardt (2002). Modern taxonomic studies, including at least one Mormyrus species, are those of Taverne (1972), Lévêque and Bigorne (1985), van der Bank and Kramer (1996), Lavoué et al. (2000). The ethology of Mormyrus rume has been studied in the laboratory by Bauer and Kramer (1974), Kramer (1974, 1976), von der Emde (1992), von der Emde and Ringer (1992) and Walton and Moller (2010).
Many studies of the electric fish community relied on fish imported to Europe or America by tropical fish dealers, i.e.
on fish of vague, one-word origin, such as ‘Lagos’, and of great taxonomical uncertainty. Field studies critically comparing populations are rare, and, with one exception, none linked morphological or genetic traits with electric organ discharge (EOD) characteristics. This is in contrast to Crawford and Hopkins (1989), who discovered a new species, M. subundulatus Roberts 1989, by comparing its EODs to those of the syntopical M. rume Valenciennes 1846 which has a similar EOD (see new species description by Roberts 1989).
The present report aims to characterise morphological and electrical differences among five Mormyrus species from selected locations in West, East and southern Africa
A morphological study on species of African Mormyrus (Teleostei:
Mormyridae) and their electric organ discharges
B Kramer
Zoological Institute, University of Regensburg, D-93040 Regensburg, Germany e-mail: bernd.kramer@biologie.uni-regensburg.de
Five species of Mormyrus Linné 1758, three from West Africa and one each from East and southern Africa, were compared morphologically, and their electric organ discharges (EODs) recorded in the field. The five species were morphologically well differentiated in terms of principal components analysis and discriminant analysis, with syntopical M. rume Valenciennes 1846 and M. subundulatus Roberts 1989 very close to but distinct from one another. Half the variation in the dataset was captured by PC1 alone, being mainly loaded by caudal peduncle depth and length, anal fin length, length of snout, pre-anal length, and dorsal fin ray count and length, in that order. Allopatric samples of M. lacerda Castelnau 1861 from the Upper Zambezi/Kwando system and Cunene River, Namibia, showed some differentiation regarded as infrasubspecific, similar to that of the M. rume samples from the Bandama River compared to those of the Comoé River, both in Côte d’Ivoire. The EODs, normalised to 25 °C, varied in average duration from 362 μs in the monopolar pulses of M. tenuirostris Peters 1882 sampled in Kenya, to 6 675 μs in the biphasic waveform pulses of M. lacerda, the waveform also displayed by all other Mormyrus species. The EOD of M. hasselquistii Valenciennes 1846 was so strong the fish was painful to handle. The EOD pulse duration of M. rume differed significantly between the sexes, being on average 1 334 μs (SE 106) in females and 2 008 μs (SE 195) in males.
Keywords: allopatric populations, body shape, intra-generic variation, intraspecific variation
Introduction
(Figure 2). Even though the specimens were collected over almost two decades, sample sizes from some of these locations are very limited. Nevertheless, it is considered that the results of this study add to the groundwork required for studies of the biogeography and diversity of African freshwater fish, such as that by Skelton (1994).
Material and methods Morphology
The fish specimens examined were identified using dichoto- mous keys by Bell-Cross and Minshull (1988) and Skelton (2001), which are considered effective for fish populations occurring in southern Africa, and by Lévêque and Paugy (1984), Lévêque et al. (1990), Paugy et al. (2003) for West African populations.
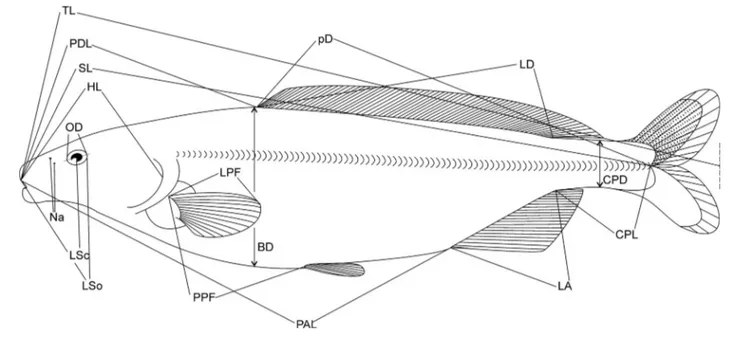
Sixteen anatomical measurements (Figure 3) and counts of four meristic variables were performed on 56 specimens from various origins in Namibia, Botswana, Kenya and Côte d’Ivoire.
The following abbreviations were used:
PDL = predorsal length (distance from the tip of the snout to the dorsal fin origin)
PAL = distance from tip of snout to anal fin origin LD = dorsal fin length
LA = anal fin length
pD = distance from dorsal fin origin to end of caudal peduncle
CPL = length of caudal peduncle (from end of anal fin base to midbase of caudal fin)
CPD = depth of caudal peduncle (least vertical distance across the caudal peduncle)
LSo = length of snout (distance from the tip of the snout to the posterior orbital rim of the eye)
LSc = length of snout (distance from the tip of the snout to the centre of the eye)
HL = head length (distance from the tip of the snout to the furthest bony edge of the operculum)
Na = distance between the centres of the pair of nares on one side
OD = eye diameter as defined by the orbital rims LPF = length of the left pectoral fin
PPF = distance from the origin of the pelvic fin to the origin of the anal fin (for the more recent specimens) SL = standard length (distance from the tip of the snout
to the midbase of the caudal fin) (a)
(b)
(c)
(d)
(e)
(f)
(g)
(h)
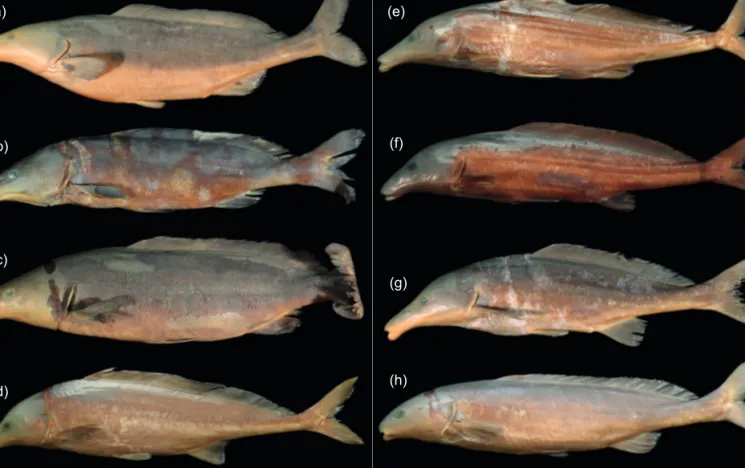
Figure 1: Photographs of the Mormyrus species studied: (a) Mormyrus lacerda from the Cunene River at Ruacana Falls, Namibia (ZSM 41770, field no. Ruac03); (b) Mormyrus lacerda, Upper Zambezi at Lisikili, Namibia (ZSM 41771, L11isi); (c) Mormyrus lacerda, Kwando River at Nkasa Island, Namibia (ZSM 41768, 5Fish); (d) Mormyrus rume, Comoé River at Kafolo, Côte d'Ivoire (ZSM 41788, Kaf117);
(e) Mormyrus rume, Bandama River at Lamto, Côte d'Ivoire (ZSM 41790, Lam08); (f) Mormyrus subundulatus, Bandama River at Lamto, Côte d'Ivoire (ZSM 41777, LAM005); (g) Mormyrus tenuirostris, Tana River at Tana Primate Research Centre, Kenya (ZSM 41766, Ta19na);
(h) Mormyrus hasselquistii, Comoé River at Kafolo, Côte d'Ivoire (ZSM 41783, Kaf116)
0°
10° S
20° S Okavango
Delta Kwando
Zambezi
Zambezi GABON
KENYA
TANZANIA
DEMOCRATIC
REPUBLIC OF CONGO
CONGO
ANGOLA
RWANDA
BURUNDI
ZAMBIA
ZIMBABWE
MOZAMBIQUE
BOTSWANA
NAMIBIA MADAGASCAR
COMOROS
AFRICA
Cotê D’Ivoire
COTÊ D’IVOIRE
Kenya
Mozambique Botswana Namibia
INDIAN OCEAN ATLANTIC OCEAN
INDIAN OCEAN ATLANTIC
OCEAN
Cunene
Tana
Tete
500 km 190 km
1° W 2° W
3° W 4° W
5° W
9° N
8° N
7° N
6° N
5° N
10° E 20° E 30° E 40° E
(a)
(b) (a)
(b)
Gulf of Guinea
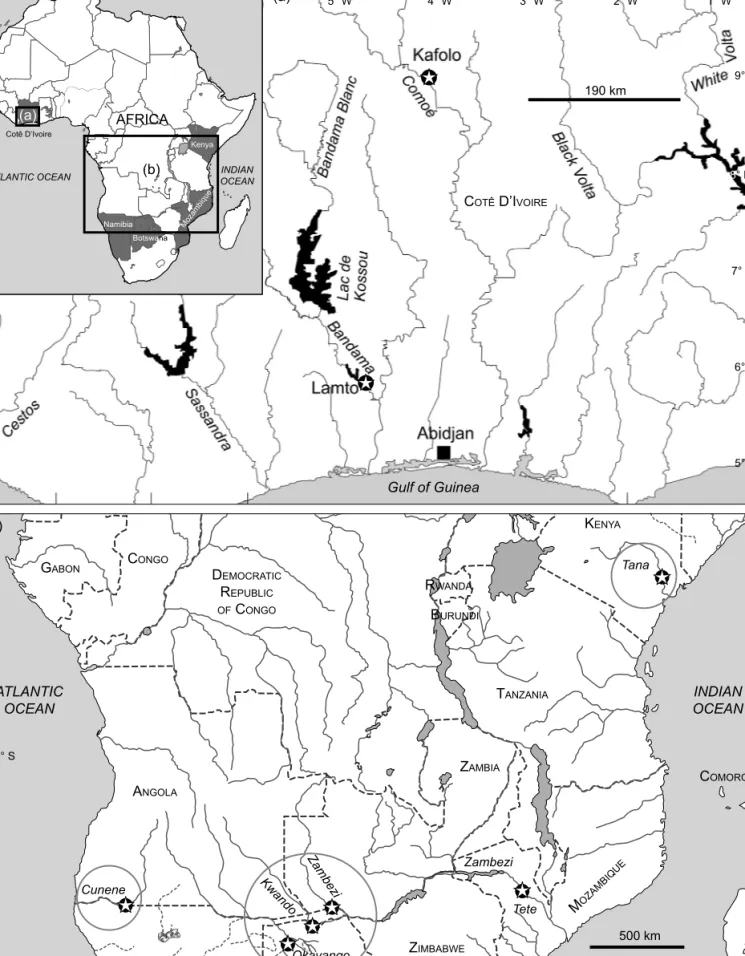
Figure 2: Maps of the collection sites for Mormyrus species used in this study: (a) West Africa with Côte d’Ivoire centred, showing locations Kafolo and Lamto; (b) East and southern Africa: the sampling locations on the Cunene River (Ruacana Falls, Namibia), Upper Zambezi/
Okavango system (Namibia, Botswana) and Tana River (Kenya) are highlighted; Tete is located on the Lower Zambezi (Mozambique)
Figure 3: Morphological characters and their definitions. For abbreviations, see Material and methods
BD = body depth (the greatest vertical distance across the body)
nD = number of dorsal fin rays nA = number of anal fin rays
SPc = number of scales around the caudal peduncle SLS = number of scales, in a linear series, along the lateral
line row, as detailed by Skelton (2001: 67) (range of accuracy ±2 counts)
Abbreviations for the institutions and collections cited followed Leviton et al. (1985) and Fricke and Eschmeyer (2012). All measurements were made point-to-point. No projections into other planes were used. The gonads of Mormyrus specimens from Côte d’Ivoire were dissected for histological examination. Paraffin-embedded sections were stained following the Azan protocol (see Kramer 1997).
Electric organ discharges
Electric organ discharges (EODs) of live fish were recorded in the field immediately after capture, using the methods described in Kramer and Swartz (2010). Recordings were taken in a 37-litre plastic aquarium filled with water from the river from which a fish was collected. Conditions in the aquarium were kept constant throughout the analysis to exclude the possibility that water conductivity and tempera- ture could affect EOD measurements.
Temperature (±0.1 °C) and water conductivity (±1 μS cm–1) were constantly monitored using an electronic apparatus (LF318 Wissenschaftlich-Technische Werkstätten WTW, Germany). Fish were placed between a pair of carbon rod electrodes that were connected to a differential amplifier with a variable gain (up to 10; 0.2 Hz ... 100 kHz; filter slopes,
−3 dB per octave; electronics workshop, Biology Department, University of Regensburg). Amplifier output was recorded with a digital storage oscilloscope (specified to at least 20 MHz at 8 bit vertical resolution and either 512, 2 048 or
4 000 points per sweep; but from 2002 onwards 100 MHz at 9 bit vertical resolution and 10 000 points per sweep). Data were numerically transferred onto disk via digital interface.
Usually eight traces per fish were recorded. Except during the first year of the study, 1990, all the field equipment was battery-operated.
Custom-designed computer programs, programmed using a software package for signal analysis, Famos v6, were used for analysis of EODs. When necessary, EOD duration was normalised to 25 °C using a Q10 value of 1.5 (Kramer and Westby 1985) before data analysis.
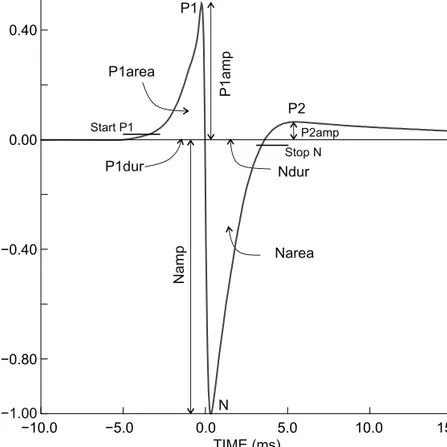
Except in one species, the EOD waveform variables can be defined as follows (Figure 4):
• Namp: head-negative peak amplitude of N phase (measured from baseline to minimum, which was equal to −1 V by definition);
• P1amp: peak amplitude of positive P1 phase (re: Namp);
• P2amp: positive peak amplitude of post potential;
• Ndur, P1dur: durations of respective phases;
• P1Nsep: separation (or interval) between the peaks of the P1 and N phases;
• P1area, Narea: areas under the P1 and N phases; and
• EODdur: total EOD duration.
Durations in microseconds or milliseconds, as indicated;
amplitudes in relative volts (re: N-phase amplitude = −1).
Area-under-curve measures, dimension (V microsec- onds). The start of the initial P1 phase and the end of the subsequent N phase were determined at a threshold level of + or −2% of Namp, respectively; P1 ended and N started at the zero-crossing between them. The reason why N ended at −2%, rather than at zero-crossing, was that the EODs of some specimens did not show an appreciable P2 phase, thus their return time to zero was extremely variable, and the value could not be determined due to noise.
A fast Fourier transform (FFT) routine provided by
Famos performed amplitude spectra of single EOD pulses.
Analogue-to-digital (A/D) sampling rates were reduced to between 100 and 125 kHz. The number of data points for FFT analysis was usually 216, obtained by extending the baseline with zeros such that a single EOD per record was centred (Davis and Hersh 1980, Bracewell 1986, Keuper 1988). Frequency resolution was <1.3 Hz. The peak power frequency (PPF in Hz) was determined from these spectra.
Subsequent to EOD recording, fish were killed with an overdose of MS222 or 2-phenoxy-ethanol anaesthetic.
Standard length (SL) was measured with Vernier callipers prior to fixing the specimen in 10% formalin for morpholog- ical studies.
Statistics
Univariate ANOVA and multivariate MANOVA were used to test for significant differences between samples. Means were given with ± standard errors, medians with ± semi- interquartiles. Principal component analyses (PCA) on correlations among anatomical characters were used to test differences in body shape among samples, because this does not require a priori assumptions about taxonomic groups. The component loadings, i.e. the principal component structure, were determined for interpreting the principal components in terms of the anatomical characters
(McGarigal et al. 2000). We followed Tabachnick and Fidell (2007) to interpret the significance of component loadings.
These authors recognised five levels of significance: loadings
>0.32 or <−0.32 = poor, >0.45 or <−0.45 = fair, >0.55 or
<−0.55 = good, >0.63 or <−0.63 = very good, and >0.71 or
<−0.71 = excellent. These benchmarks accounted for 10%, 20%, 30%, 40% and 50% of the variance in the component, respectively. Discriminant analysis (DA) was used to find the best separation among the specimens from different origins in multidimensional space, using JMP v.9 software (SAS Institute, Cary, North Carolina, 2007). The best result was obtained by stepwise variable selection, as measured by the smallest −2LogLikelihood (i.e. minus two times the natural log of the likelihood function evaluated at the best-fit parameter estimates).
Material examined
Mormyrus lacerda Castelnau 1861
ZSM 41768 (3), field nos 5Fish (8 September 1993), 8Fish, 9Fish (9 September 1993), Namibia: East Caprivi:
Kwando River: Nkasa Island in Mamili National Park, 18°26.5′ S, 23°38′ E, water: 108 μS cm–1 and 20 °C at 17:00, coll. FH van der Bank and B Kramer.
ZSM 41771 (3), field nos L03isi, L11isi, L21isi (5 March 1994); ZSM 41772 (4), L24isi, L25isi, L27isi, L34isi í0.80
í0.40 0.00 0.40
í10.0 í5.0 0.0 5.0 10.0 15.0
P1amp
Namp
P2amp
P1dur Ndur
P1
N
P2 Start P1
Stop N
TIME (ms)
AMPLITUDE (V) Narea
P1area
P1Nsep
í1.00
Figure 4: The common Mormyrus EOD type, present in all but the Kenyan sample of specimens, centred on the zero-crossing of the main transient, with baseline superimposed. Variables as used in the present study and their definitions. The beginning of an EOD was defined by
‘start P1’, at 2% of the absolute value of the amplitude of the N peak (or Namp that was −1 by definition). P1dur(ation) ended at time = 0 ms where the N phase started. An EOD (as well as Ndur) ended where the ascending slope of the N phase crossed the −2% threshold (‘stop N’).
This stop criterion was chosen because an appreciable P2 phase was not present in all Mormyrus specimens. P1Nsep, the interval between P1 peak and negative N peak. P1area and Narea, the areas under the P1 and N peaks, respectively. The EOD shown was recorded from a Mormyrus lacerda sampled from Guma/Okavango Delta. For the EOD waveform of Mormyrus specimens from Kenya, refer to Figure 7
(6 March 1994), Namibia: East Caprivi: Upper Zambezi River: Lisikili Lake, 17°33′ S, 24°29′ E, water: 56.1 μS cm–1 and 26.8 °C at 6:50, coll. FH van der Bank and B Kramer.
ZSM 41769, field no. 85, Namibia: East Caprivi: Upper Zambezi River: Kalimbeza fishing camp, 17°32′27.3″ S, 24°31′26.2″ E, 7 August 2004, water: 76.2 uS cm–1 and 18.9 °C at 07:00, coll. FH van der Bank and B Kramer.
ZSM 41770, field no. Ruac03, Namibia: Cunene River: just below Ruacana Falls, 17°24′24″ S, 14°13′01″ E, about 800 m altitude, 19 August 2006, water at 10:00: 45.8 μS cm–1 at 21.1 °C, coll. B Kramer and E Swartz.
Mormyrus tenuirostris Peters 1882
ZSM 41766 (4), field nos Ta19na (4 September 2001), Ta45na, Ta46na, Ta49na (6 September 2001), Kenya:
Tana River: Tana Primate Research Reserve, 1°52′38.1″ S, 40°8′22.5″ E, approx. 48 m altitude, Tana River water at 17:00 on 2 Sept 2001: 185.6 μS cm–1 at 25.7 °C, coll. Luc De Vos and B Kramer.
Mormyrus rume Valenciennes 1846
Six specimens: ZSM 41785, field no. Kaf013 (17 April 1990, 25.9 °C, 104 μS cm–1); ZSM 41786, Kaf020 (18 April 1990, 28.0 °C, 103 μS cm–1); ZSM 41788 (4), Kaf055, Kaf105, Kaf108, Kaf117 (26 April 1990, 29.1 °C, 99 μS cm–1); from Côte d'Ivoire: Comoé River: Kafolo (Campement de Recherche sur les Mouches Tsétsé), 9°36′ N, 4°19′ W, coll. B Kramer and M Postner.
Fifteen specimens: ZSM 41789 (4), field nos Lam57, Lam67, Lam67(A), Lamto102 (1 May 1990, 29.6 °C, 96 μS cm–1); ZSM 41791, Lam017 (12 April 1991, 29.5 °C, 79.8 μS cm–1); ZSM 41790, Lam08 (15 April 1991, 26.9 °C, 78.2 μS cm–1); ZSM 41792 (2), Lam12, Lam24 (20 April 1991, 28.5 °C, 81.0 μS cm–1); ZSM 41787 (2), Lam29, Lam30 (21 April 1991, 27.9 °C, 83.7 μS cm–1); ZSM 41792 (2), Lam33, Lam34 (22 April 1991, 32.9 °C, 81.5 μS cm–1); ZSM 41793 (3), Lam37, Lam38, Lam39 (22 April 1991, 32.9 °C, 81.5 μS cm–1), Côte d'Ivoire: Bandama River: Station d’Écologie de Lamto, 6°11′ N, 5°0′ W, coll. B Kramer and I Kaunzinger.
Mormyrus hasselquistii Valenciennes 1846
Three specimens: ZSM 41784, field no. Kaf107 (16 April 1990, water 94 μS cm–1, 26.4 °C); ZSM 41783 (2), Kaf026, Kaf116 (19 April 1990, water 26.1 °C, 110 μS cm–1); Côte d'Ivoire: Comoé River: Kafolo Tsetse Research Station, 9°36′ N, 4°19′ W, coll. B Kramer and M Postner.
Mormyrus subundulatus Roberts 1989
Sixteen specimens: ZSM 41777 (3), field nos Lam001, Lam005, Lam013 (12 April 1991, 29.5 °C, 79.8 μS cm–1);
ZSM 41778, Lam07 (13 April 1991, 30.0 °C, 76.9 μS cm–1);
ZSM 41779 (2), Lam09, Lam10 (19 April 1991, 28.8 °C, 77.0 μS cm–1); ZSM 41780 (5), Lam19, Lam23, Lam25, Lam26, Lam27 (20 April 1991, 28.5 °C, 81.0 μS cm–1);
ZSM 41781 (3), Lam28, Lam31, Lam32 (21 April 1991, 27.9 °C, 83.7 μS cm–1); ZSM 41782 (2), Lam35, Lam36 (22 April 1991, 32.9 °C, 81.5 μS cm–1); Côte d'Ivoire: Bandama River: Station d’Écologie de Lamto, 6°11′ N, 5°0′ W, coll.
B Kramer and I Kaunzinger.
Results
Anatomical comparisons
The morphological characteristics of the West African Mormyrus species (Appendix 1) were used to determine the species, following the key by Bigorne (2003). The number of dorsal fin rays (median nD = 65, range 60–70), in the M. subundulatus sample neither overlapped that of the Bandama River M. rume sample (median nD = 83, range 72–87) nor of the Comoé River M. rume sample (median nD = 84, range 83–89). Also, the counts of the scales in lateral series, SLS, were in almost perfect agreement with the key (see Appendix 1 for comparisons). As expected from the key, the median SLS counts were higher in the two M. rume samples (median SLS counts of 105 and 101.5, respectively) than in M. subundulatus (median SLS = 88.5, range 87–92), with a single M. rume specimen from the Comoé River also showing only 92 scales, which was the maximum count recorded in M. subundulatus. The fin ray and scale count data of the key clearly distinguished between the two species M. rume and M. subundulatus.
Among the measurements summarised by Bigorne (2003), LD/SL and HL/SL are in agreement with the present two samples of M. rume and M. subundulatus, respectively, whereas minimum LA/SL values in the Bandama sample of M. rume were still smaller than the minimum values of the key, though not so in the Comoé sample. These slight deviations from the summary given in Bigorne (2003) seem to show that the full extent of variation has not yet been determined in these two Mormyrus species from West Africa and Chad. As noted by Roberts (1989), and confirmed in the present sample, the caudal peduncle of M.
subundulatus is deeper than that of M. rume, whilst a local fisherman had reported that only the former species (which Roberts subsequently recognised as the new species M.
subundulatus) gave an electrical shock.
A characteristic trait of M. hasselquistii Valenciennes 1846 listed in the key and also present in our specimens, is that its dorsal fin begins far in advance of the pelvic fins. In combina- tion with the position of the pelvic fins relative to the dorsal fin, the count of the circumcaudal peduncle scales (key range 26–34; range in our specimens 28–30) distinguished M.
hasselquistii with certainty. Additional support for this were the dorsal and anal fin ray counts (nD and nA), the count of the scales in lateral series (SLS) and the measurements of LD/SL, LA/SL and BD/SL, which were all in agreement with the data of Bigorne (2003). OD/HL values in our sample overlapped, and extended to values greater than, the range given in Bigorne (2003). It should be noted that the manner in which this character is measured may vary among labora- tories — i.e. point-to-point, as in the present paper, or, for example, by projection into a parasagittal plane and following right angles in certain, but not all, characters — and that the number of specimens per species as summarised by Bigorne (2003) is not given, but appears to be small in certain species (see Lévêque and Bigorne 1985).
The M. lacerda Castelnau 1861 specimens were identi- fied according to Skelton (2001). The count data for nD, nA and SLS in this reference work corresponded to our samples’ counts in M. lacerda, with the exceptions of the Upper Zambezi sample, which had up to 21 anal fin rays,
and the Kwando sample, which had up to 20, rather than a maximum of 19, as given by Skelton (2001). As there has been no comparison of allopatric populations of M. lacerda to date, these range extensions are to be expected.
The East African M. tenuirostris Peters 1882 was identified by the late L De Vos (personal communication).
The present specimens sampled in the Tana River, Kenya, agreed with the original description by Peters (1882) of one specimen of 125 mm length from the Athi River, Kenya.
Whereas Copley (1941) did not list M. tenuirostris, Copley (1958) confirmed its presence in the Athi River. Whitehead (1959) cautiously confirmed the presence of ‘Mormyrus sp.’
in the Tana River. Probably the first reference confirming the presence of M. tenuirostris in the Tana River was Seegers et al. (2003). Referring to the Kenyan ichthyofauna in general, these authors stated that ‛the taxonomy of the genus Mormyrus is largely unresolved and tentative’ (p 18).
This call for caution evidently refers to Mormyrus bernhardi Pellegrin 1926, Mormyrus hildebrandti Peters 1882, and Mormyrus kannume Forsskål 1775, and concerns their validity or distribution within Kenyan freshwaters, but it does not cast doubt upon the validity of M. tenuirostris or its occurrence in the Tana River (p 29).
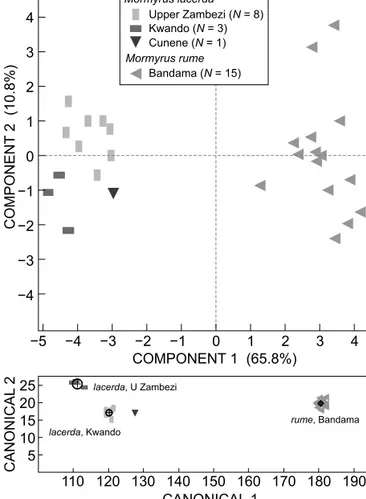
The first question of the present study was whether samples of M. lacerda from the Upper Zambezi, Kwando and Cunene rivers in southern Africa were differentiated from each other when compared to a distant relative, such as M. rume from the Bandama River, West Africa. Using principal components analysis (PCA), the three southern African samples of M. lacerda formed a close cluster that was well separated from M. rume. The three Kwando and the single Cunene specimens were close to, but a little outside the Upper Zambezi group. This was confirmed by discriminant analysis and, pending closer study using more individuals, this is considered evidence for intraspecific geographic variation in M. lacerda (Figure 5).
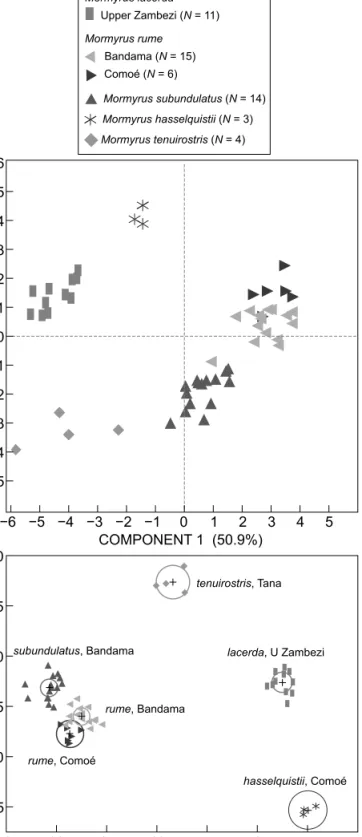
In a similar analysis including all samples studied, the M. lacerda specimens from the Upper Zambezi system, including the Kwando, were well differentiated from all other groups. The same held true for M. hasselquistii and M. tenuirostris, two species that are easily recognised both in the field and as collection specimens. This is in contrast to M. rume and M. subundulatus, which formed two clusters very close to, but distinct from, one another (non-overlapping 95% confidence limits to contain true mean of group; Figure 6), reflecting the great morphological similarity between these two species. The M. rume samples from the Bandama and the Comoé rivers were close together with some overlap of confidence limits, and thus the differentiation is regarded as infrasubspecific (Figure 6).
A PCA on all samples successfully reduced the redundancy: 76.6% of the variation in the dataset was explained by the first three components (Appendix 2).
PC1 was positively loaded by CPL, LSc, LSo, nD and SLS (all ‘excellent’), LD (‘very good’), and pD (‘good’); it was negatively loaded by CPD/CPL, LA, PAL, PPF (all
‘excellent’), BD (‘very good’), and PDL (‘good’). Thus PC1 is a complex gradient, first of all for a caudal peduncle that is deeper the shorter it is (or vice versa: the less deep the longer), exemplified by M. lacerda with the shortest caudal peduncle but the highest score for CPD/CPL, as opposed
to M. rume with the least deep but relatively longest caudal peduncle among the present samples (Appendix 1). PC1 also represents a shorter anal fin together with more rays in, and an increased length of, the dorsal fin (and vice versa); a greater number of scales in the lateral series together with a reduced PAL, reduced PPF, longer snout and decrease in body depth (and vice versa). PC2 is loaded positively by LPF (‘excellent’), pD, PPF and LD (‘good’), and negatively loaded by HL and PDL (both ‘very good’). Thus PC2 is a gradient for a shorter head length and PDL (the predorsal section of the fish) going together with a longer pD and LD (rear section of the fish), but also longer PPF (and vice versa). Mormyrus tenuirostris from Kenya exhibited the longest head and PDL, and M. hasselquistii the shortest.
Several characters loaded strongly on both PC1 and PC2, such as PDL, LD, PPF and pD. Only a single character loaded strongly, and negatively, on PC3: SPc (‘very good’).
In the present sample, the range of SPc scales spans a median of from 20 in M. lacerda and M. subundulatus to 30 in M. hasselquistii.
COMPONENT 1 (65.8%)
í5 í4 í3 í2 í1 0 1 2 3 4
COMPONENT 2 (10.8%)
í4 í3 í2 í1 0 1 2 3 4
lacerda, Kwando
lacerda, U Zambezi
rume, Bandama
CANONICAL 2
190 180 170 160 150 140 130 120 110 20 25 15 10 5
CANONICAL 1
Mormyrus lacerda
Mormyrus rume
Upper Zambezi (N = 8) Kwando (N = 3) Cunene (N = 1) Bandama (N = 15)
Figure 5: Principal components analysis (upper graph) and discriminant analysis (DA; lower graph) on the morphology of Mormyrus lacerda from three localities in southern Africa and of M.
rume from Bandama. The single sample from Cunene was excluded from the DA analysis but its position on the graph is shown. Circles in DA graph = 95% confidence limit to contain true mean of group (group mean indicated by + symbol). Based on all 19 available characters
EOD comparisons
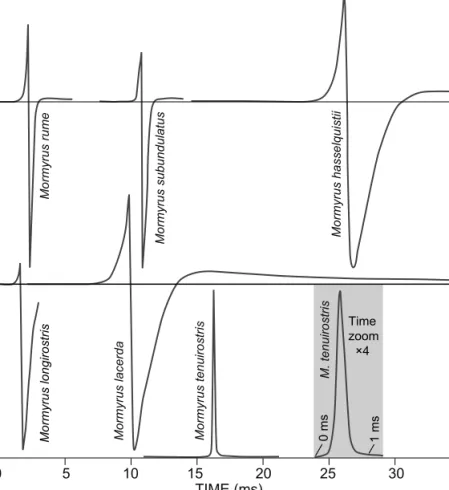
All but one Mormyrus species displayed an essentially similar, biphasic EOD waveform that varied in pulse duration
among species. However, for the exceptional M. tenuiro- stris, see below. An EOD started with a head-positive (P1) phase that was followed by a head-negative main potential (N phase) and, in most cases, was terminated by a weak head-positive P2 phase of long duration that approached the baseline asymptotically (Figure 7). Using a 2%-amplitude criterion for the beginning and end of an EOD (see Material and methods, Figure 4), the EOD of M. subundulatus from Côte d'Ivoire was the shortest (mean 1 232 ± 61.3 μs, N = 16), and that of M. lacerda from the Upper Zambezi River, Namibia, the longest (6 675 ± 285 μs, N = 8) (disregarding the weak P2 phase of usually long duration; Appendix 3). In morphology as in EOD waveform, the pair of species which most closely resembled one another was M. rume and M.
subundulatus, both being from the Bandama River, Côte d'Ivoire. The EOD of M. rume was longer (1 555 ± 118 μs) than that of M. subundulatus (1 232 ± 61 μs) from the same river, and the difference was significant (unpaired t-test, t = 2.56, N1 = 16, N2 = 11, p = 0.0164). This was in contrast to Crawford and Hopkins’ (1989) findings whose EOD duration values for the two species were shorter (average 966 μs for M. rume, and 961 μs for M. subundulatus) than those in the present study, and did not differ significantly from each other. As already seen by Crawford and Hopkins (1989), and confirmed in the present study, the P1 phase amplitude was stronger in M. rume than in M. subundulatus and did not have a notable inflection point. Also, the rising slope of the N phase usually followed a more markedly sigmoidal course in M. subundulatus than in M. rume.
The present study found the P1 amplitude in M. subundu- latus (mean amplitude 0.316, range 0.242–0.419) to be twice as strong as that reported by Crawford and Hopkins (1989) (mean 0.144, range 0.113–0.203), and hence more similar to that of M. rume. The difference between the two studies is explained in part by a difference in the size of the M. subundulatus specimens used: SL 22.5 cm (SD 1.2, N = 16) in the present study vs 8.48 cm (SD 4, N = 5) in the other study. The P1 amplitude of the present sample grew significantly with SL (y = 0.005x + 0.195; r2 = 0.320, F = 6.591, p = 0.0224, N = 16). Hence, the expected P1 amplitude for an SL of 8.48 cm would be about 0.24, rather than 0.144. However, a dependency of P1 amplitude on SL in M. rume could not be demonstrated. The two studies agree in that M. rume’s P1 amplitude was signifi- cantly stronger than that of the syntopical M. subundulatus (unpaired t-test, t = 5.256, N1 = 16, N2 = 13, p < 0.0001).
The EOD of M. hasselquistii resembled that of M. lacerda in waveform and duration (which was 5 283 ± 73.5 μs, N = 3, Appendix 3, Figure 7). Mormyrus hasselquistii was unique in its strong pulse amplitude, subjectively much stronger than that of at least two Mormyrus species, M.
longirostris (Jubb 1967) and M. rume (Kramer 1990: 62), long known to generate unusually strong EODs which can be felt with wet fingers. The field equipment used in the present study was not designed to measure EOD amplitudes, which would have required a strict recording geometry with an immobile, though fully conscious, fish. The EOD of M. hasselquistii was so strong that this species was painful for the researcher to handle, being more similar to an electric fence charge than that of a weakly electric mormyrid fish (personal observation).
hasselquistii, Comoé lacerda, U Zambezi
rume, Bandama
rume, Comoé subundulatus, Bandama
tenuirostris, Tana
í5 í4 í3 í2 í1 0 1 2 3 4 5 6
í6 í5 í4 í3 í2 í1 0 1 2 3 4 5 COMPONENT 1 (50.9%)
COMPONENT 2 (20.9%)CANONICAL 2
20
15
10
5
5 í5
í10 í5 í20 í5 í5
CANONICAL 1 0
0
Mormyrus lacerda Mormyrus rume
Mormyrus subundulatus (N = 14) Mormyrus hasselquistii (N = 3) Mormyrus tenuirostris (N = 4) Upper Zambezi (N = 11)
Comoé (N = 6) Bandama (N = 15)
Figure 6: Principal components analysis and discriminant analysis on morphology of Mormyrus lacerda (Upper Zambezi system);
M. rume (Bandama River and Comoé River); and M. subundulatus, M. hasselquistii and M. tenuirostris. Based on 18 characters, i.e. all except OD/HL, which did not contribute to discrimination
The recording apparatus detected M. hasselquistii’s EOD not only on its own, but also in fishless water-filled buckets some distance away, and similarly when a single mormyrid, such as Marcusenius sp., seemed to generate two different EOD waveforms at independent rates when an M. hasselquistii was kept in a separate bucket nearby.
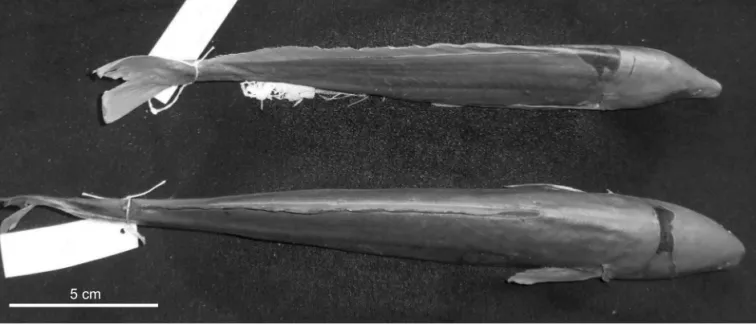
Mormyrus hasselquistii is physically a much stronger fish when compared to an M. rume of similar size (Figure 8).
Another surprising finding, and something hitherto unknown to science, was the discovery of a purely monopolar EOD in M. tenuirostris. This EOD was head-positive without even a trace of a head-negative pre- or after-potential, such as observed in the essentially monopolar EODs of the Upper Zambezi species complex of Hippopotamyrus ansorgii and H. szaboi (Kramer et al. 2004). Thus the M.
tenuirostris EOD waveform is totally different from all other known Mormyrus EODs, besides being unusually short:
362 ± 14 μs (N = 4) at 10% pulse amplitude (Figure 7).
The hypothesis of there being a sex difference in the EOD characteristics of M. subundulatus is suggested by its rather high coefficient of variation (CV, i.e. ratio of the standard deviation to the mean, given as percent) of EODdur of 19.9%. However, a MANOVA test including all seven waveform characters (in Appendix 3, excepting
EODdur to avoid redundancy with its constituents, P1dur and Ndur) yielded an insignificant result, i.e. no support for a sex difference (F7,3 = 0.759; p = 0.6577 for all four test variables, Wilks’ lambda, Roy’s greatest root, Hotelling- Lawley trace and Pillai trace). This was confirmed by subsequent univariate ANOVAs that also found no differ- ences among any of the characters tested (F1,9 ≤ 2.018; p ≥ 0.1892). In contrast, the EOD characteristics of syntopical M. rume (N = 11) sampled at the same time and place, with a CV of 28.7% in EODdur, differed significantly between the sexes (MANOVA on all EOD waveform variables in Appendix 3 except EODdur; F7,2 = 22.395; p = 0.0434;
same for all four test variables). This result was due to the significantly higher Ndur and Narea values observed in males than in females (Ndur: F1,8 = 6.467, p = 0.0345;
Narea: F1,8 = 8.617, p = 0.0189; univariate ANOVAs). The Ndur mean was 848.4 ± 128 μs in females and 1 489 ± 246.2 μs in males, and thus was almost twice as long in males. Narea was 322.8 ± 40 V μs in females and 486.6 ± 31.6 V μs in males. The EOD duration (EODdur) averaged 1 334 ± 106 μs in females vs 2 008 ± 195 μs in males. All seven characters of the M. rume sample from the Comoé River (N = 6, at least five being females; Appendix 3) closely resembled those of the female values from the
AMPLITUDE (V) (head-positive from baseline)
0 5 10 15 20 25 30 35 TIME (ms)
Mormyrus rume Mormyrus subundulatus Mormyrus hasselquistii 1 ms0 ms
Time zoom ×4
M. tenuirostris
Mormyrus tenuirostris
Mormyrus lacerda
Mormyrus longirostris
Figure 7: Diagrams of EODs from several African Mormyrus species. Head-positivity is upwards. Main potential scaled to 1 volt, which is head-negative in all but M. tenuirostris where it is head-positive. Same time-scale for all EODs, except for inset (grey background) which is 4. Baselines indicate 0 V in both upper and lower panels. Upper panel: West African species; lower panel: southern and East African species. The incomplete recording of an EOD attributed to M. longirostris was made in situ in the Lower Zambezi River at Tete of a fish that was neither seen nor caught
Bandama sample, i.e. no significant differences. In the PCA the sex difference was visible in M. rume, but not in M. subundulatus (Figure 9). Notwithstanding their great morphological similarity, in terms of PC and especially of DA, the two species’ EODs proved distinct when compared to that of M. lacerda (i.e. non-overlapping confidence circles, Figure 10).
Specimens of a second sample of M. rume (N = 6) from the independent Comoé River, all being females except one, the sex of which could not be determined, showed yet higher average P1amp scores, but somewhat lower EODdur scores than the Bandama specimens (Appendix 3). The Comoé sample overlapped the Bandama sample in both PCA and DA, and hence there is no reason to assume differentiation (Figure 10). The two Côte d'Ivoire species, M. rume and M. subundulatus, were strongly differentiated from the various southern African samples of M. lacerda on PC1, except for M. hasselquistii, the scores of which were close to, but distinct from, the southern African species.
Scores for the various M. lacerda samples were widely scattered along PC2, and therefore the question of EOD differentiation among them cannot be conclusively resolved at present for lack of more numerous samples from the Kwando, Okavango and Cunene rivers.
The next highest coefficient of variation for EODdur was 12.1% in M. lacerda from the Upper Zambezi, and was considerably lower for the remaining species and samples.
No further significant sex differences emerged from any of the present data.
The Lower and Middle Zambezi River is inhabited by M.
longirostris Peters 1852, whereas M. lacerda is restricted to the Upper Zambezi (Skelton 2001). It was not possible to catch specimens of M. longirostris, but its EODs were recorded in situ from fish hiding in dense reed beds 3 m offshore in the Lower Zambezi at Tete during the day. This was done by cautiously moving an electrode set mounted on a long wooden pole to near the spot from which strong
signals had been located by an electronic audio device.
Because bright sunlight blanched the oscilloscope screen, the result was a ‘blind’ recording: an unnecessarily high sweep speed (i.e. a short recording time window), which is suitable for other mormyrid species, was inadvertently used, and therefore the latter part of the EODs of M. longirostris was clipped (Figure 7). Attempts at making nocturnal record- ings were unsuccessful because the fish had dispersed and their constant moving about made recording difficult. In spite of the shortcomings of these recordings, of specimens that had neither been seen nor properly identified, they clearly betrayed the presence of what must have been M. longiro- stris. The EODs showed a Mormyrus discharge waveform similar to that of M. lacerda which, although shorter than that of the latter species, lasted much longer than the EODs of all other mormyrid species in this part of the river the EODs of which are known, such as M. macrolepidotus: Kramer et al.
2007; Cyphomyrus discorhynchus: Kramer and van der Bank 2011; and Mormyrops anguilloides: BK unpublished data.
The putative M. longirostris EOD also differed from that of M.
lacerda by a very low P1 phase amplitude (12.7% of N phase amplitude in the former vs a mean of 58.2% in the latter) of short duration (1.36 ms at ‘5% criterion’ in the former vs a mean 2.45 ms in the latter). At corresponding points of the clipped N phase, the duration of the N phase of M. longiro- stris was 1.36 ms vs 2.72 ms in M. lacerda (Figure 7).
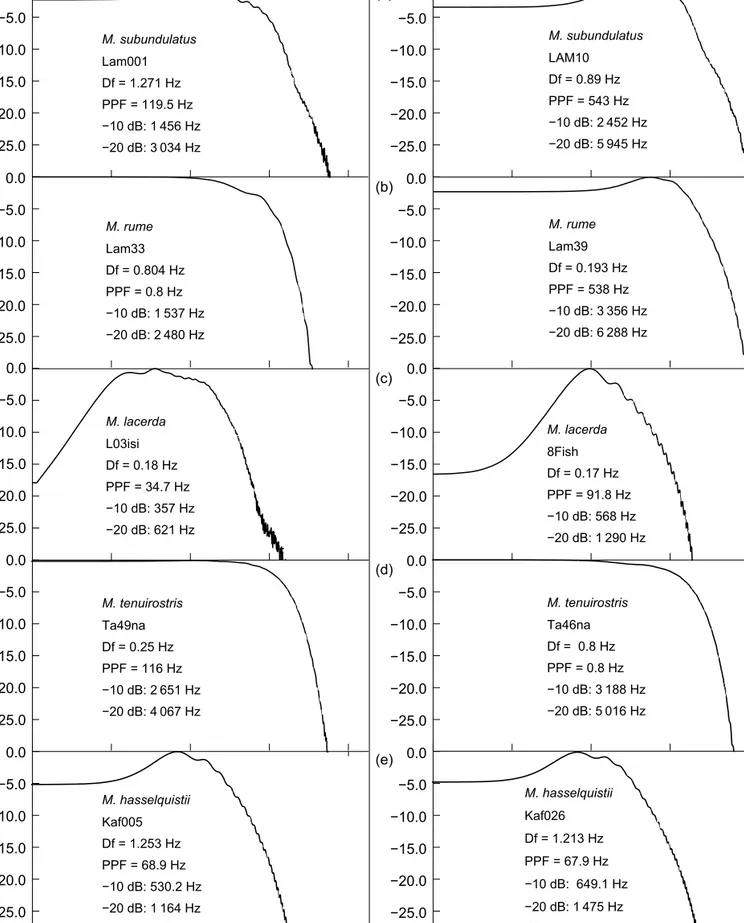
Amplitude spectra confirmed that the EODs of Mormyrus species occupy the very low-frequency range among mormyrids (Figure 11). The EODs of M. subundulatus showed weak peaks slightly rising above the lower frequen- cies. These peaks were at 119.5 and 543 Hz for the longest and the shortest EODs in the sample, respectively. On the high-frequency side, −10 dB values occurred at 1 456 and 2 452 Hz, respectively. The longest EOD of M. rume showed no attenuation throughout a wide low-frequency range, with
−10 dB attenuation occurring only at 1 537 Hz. The shortest EOD peaked at 538 Hz, and the −10 dB frequency value 5 cm
Figure 8: Mormyrus rume (top) and M. hasselquistii (25 cm SL, below) viewed from above
was observed at 3 356 Hz. The present study’s specimens thus showed EODs the spectral amplitude peaks of which were far below 1 kHz. This is in contrast to the spectra shown by Crawford and Hopkins (1989) which did not show the range below 100 Hz.
The EOD amplitude spectra of M. lacerda had pronounced peaks (PPFs) at 34.7 and 91.8 Hz for the longest and the shortest EODs, respectively. Similarly, low PPF values (below 70 Hz) were also observed in M.
hasselquistii that were markedly stronger in the very lowest frequency range, in agreement with their pronounced shocking power. Both species’ −10 dB frequencies were considerably lower than those of M. subundulatus and M.
rume: 357 and 568 Hz for the longest and the shortest EODs in M. lacerda, respectively, and 530 and 649 Hz, respectively, in M. hasselquistii. The flat spectra of the relatively short, purely monopolar EOD pulses of M. tenuiro- stris only levelled off at 2 651 and 3 188 Hz (−10 dB values for the longest and shortest EODs in the sample; Figure 11d). These very brief DC pulses were too weak to hurt one’s wet fingers.
Differences between the two studies of M. rume and M.
subundulatus EODs
Temperature was probably not a significant factor in explaining the differences between the two studies in EOD pulse duration. At 25.23 °C (SD 1.2), the average tempera- ture in Crawford and Hopkins’ (1989) study was similar to that in the present study, where EOD duration was normal- ised to 25 °C if necessary. There remain the possibilities
of ontogeny, or else a recording artefact associated with the use of a magnetic tape recorder, as employed by Crawford and Hopkins (1989), as confounding factors.
Tape-recording EOD pulses may dramatically alter their waveform, depending on pulse duration, spectral frequency content, tape recorder type, recording speed, and magnetic tape specifications, even when using the best equipment available (Kramer and Weymann 1987). This is because the í2 í3
0í1 21 3
í3 í2 í1 0 1 2 3
í2 í1
0 1 2 3 í3
í2 í1
0 1 2 3
4
í2 í3 0 í1 2 1
4 3
í2 í3 0 í1 2 1
4 3 PC 1
PC 3
PC 2
PC 1
PC 3
PC 2
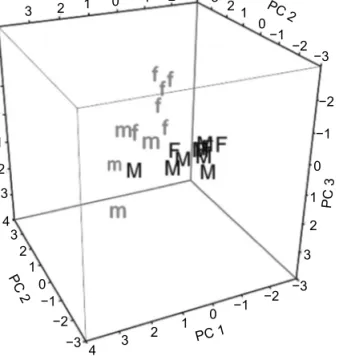
Figure 9: Principal components analysis for the EODs of two Mormyrus species from the Bandama River. Mormyrus rume: m = males, f = females; M. subundulatus: M = males, F = females.
Analysis based on seven EOD characters: P1amp, P2amp, P1dur, Ndur, P1Nsep, P1area, Narea. Note segregation of points for the two sexes in M. rume
B C
H
B
B B BB B BB BB B BB
CC C C C C
B B B B B BB B B BB B
CC CC C C
H HH
H H H B
V V
Mlac, Kwando R
Mlac, U Zambezi R Mrum, Bandama R
Msub, Bandama R
Mrum, Comoe
Mhas, Comoe
í2 í1 0 1 2
COMPONENT 2 (9.03%)
í2 0 2 4 6
COMPONENT 1 (81.6%)
CANONICAL 2
20 25 30 35 40
15 10 5 í5 í3 í1
í7 í9
CANONICAL 1 Mormyrus lacerda
Mormyrus rume
Mormyrus subundulatus (N = 16) Upper Zambezi (N = 8) Kwando (N = 4)
Comoé (N = 6) Bandama (N = 13) Cunene (N = 1) Capture wild
In captivity Okavango (N = 1)
Mormyrus hasselquistii (N = 3)
Figure 10: Principal components analysis and discriminant analysis (DA) on the EODs of Mormyrus species (seven characters shown in Appendix 3, with EODdur excluded): M. rume (Bandama River and Comoé River); M. subundulatus (Bandama River); M. hasselquistii (Comoé River); M. lacerda (Upper Zambezi River, Kwando River and Cunene River). Excluded from DA analysis but position on graph shown: M. lacerda (Okavango River: when caught wild in 2004, and in captivity 2009, respectively; same specimen)
M. hasselquistii Kaf026 Df = 1.213 Hz PPF = 67.9 Hz í10 dB: 649.1 Hz í20 dB: 1 475 Hz EODdur = 5 059 ms M. tenuirostris
Ta49na Df = 0.25 Hz PPF = 116 Hz í10 dB: 2 651 Hz í20 dB: 4 067 Hz
M. tenuirostris Ta46na Df = 0.8 Hz PPF = 0.8 Hz í10 dB: 3 188 Hz í20 dB: 5 016 Hz
M. hasselquistii Kaf005 Df = 1.253 Hz PPF = 68.9 Hz í10 dB: 530.2 Hz í20 dB: 1 164 Hz EODdur = 5 950 ms í30.0
í25.0 í20.0 í15.0 í10.0 í5.0 0.0
í25.0 í20.0 í15.0 í10.0 í5.0 0.0
í25.0 í20.0 í15.0 í10.0 í5.0 0.0 í25.0 í20.0 í15.0 í10.0 í5.0 0.0
í25.0 í20.0 í15.0 í10.0 í5.0 0.0
í30.0 í25.0 í20.0 í15.0 í10.0 í5.0 0.0
í25.0 í20.0 í15.0 í10.0 í5.0 0.0
í25.0 í20.0 í15.0 í10.0 í5.0 0.0 í25.0 í20.0 í15.0 í10.0 í5.0 0.0
í25.0 í20.0 í15.0 í10.0 í5.0 0.0
FREQUENCY (Hz)
AMPLITUDE (dB)
M. subundulatus Lam001 Df = 1.271 Hz PPF = 119.5 Hz í10 dB: 1 456 Hz í20 dB: 3 034 Hz
M. subundulatus LAM10 Df = 0.89 Hz PPF = 543 Hz í10 dB: 2 452 Hz í20 dB: 5 945 Hz
M. rume Lam33 Df = 0.804 Hz PPF = 0.8 Hz í10 dB: 1 537 Hz í20 dB: 2 480 Hz
M. rume Lam39 Df = 0.193 Hz PPF = 538 Hz í10 dB: 3 356 Hz í20 dB: 6 288 Hz
M. lacerda L03isi Df = 0.18 Hz PPF = 34.7 Hz í10 dB: 357 Hz í20 dB: 621 Hz
M. lacerda 8Fish Df = 0.17 Hz PPF = 91.8 Hz í10 dB: 568 Hz í20 dB: 1 290 Hz
100 10
1 1 000 10 000 1 10 100 1 000 10 000
(a)
(b)
(c)
(d)
(e)
Figure 11: Amplitude spectra of single EOD pulses of Mormyrus species. Amplitudes relative to the strongest spectral signal component = 0 dB. Note logarithmic abscissa for frequency in Hz. Left, a species’ longest EOD; right shortest EOD. (a) = M. subundulatus; (b) = M. rume (Bandama sample); (c) = M. lacerda (Upper Zambezi sample); (d) = M. tenuirostris; (e) = M. hasselquistii. Df, frequency resolution; PPF, peak power frequency; frequencies at −10 dB and −20 dB re: 0 dB on the high-frequency side
‘direct’ tape recording procedure differentially phase-shifts spectral components of the recorded signal.
Even though the EOD waveform recordings appeared good enough to the researchers, this explanation cannot be ruled out without further study. However, such an effect, if present, does not invalidate Crawford and Hopkins’ (1989) conclusion that there were two groups of Mormyrus fish that differed in EOD waveform: M. rume and an unknown species (their new species M. subundulatus), as the same recording procedure had been applied to both species.
The possibility of ontogenetic development as one reason for the differences between the two studies is supported by the great size differences between the two studies’ specimens, especially for M. subundulatus. The M. subundulatus specimens in the present study were on average much more than twice the size of those used in the 1989 study (22.5 cm, SD 1.2, N = 11 vs 8.48 cm, SD 4, N = 5), whereas the M. rume specimens in the present study were on average slightly less than twice the size of those in the 1989 study (29.7 cm, SE 1.6, N = 11 for the Bandama specimens alone, compared to 15.5 cm, SD 4.2, N = 9 for the 1989 study). Ontogenetic change was clearly observed in one 11.7 cm SL M. lacerda specimen (field no. 147) in the present study, caught in the Okavango Delta. After it had grown to 30 cm SL in captivity, the relative P1 amplitude of its EOD had increased by 16% from 0.431 to 0.499 and the total EOD pulse duration by 5%. Therefore, growth probably explains some of the differences between the EODs of M.
subundulatus and M. rume recorded in the two studies.
Discussion
The present study shows the EODs of five Mormyrus species that were all digitised and numerically stored immediately after capture in the field. It demonstrates a sex difference in the EOD of M. rume and demonstrates the great homoge- neity of Mormyrus species across Africa, both in morpholog- ical and electrical phenotype. With one exception, all species studied generated long, biphasic EODs of similar waveform, although variable in duration and strength. Mormyrus tenuirostris from Kenya is a notable exception, having a purely monophasic, very short DC pulse. Morphologically, M. tenuirostris is exceptional for its longer head, shorter dorsal fin with fewer rays than its congeners and a dorsal fin origin positioned behind that of the pelvic fins. It would be interesting to explore what caused M. tenuirostris to differen- tiate so strongly from its congeners in evolution.
Another notable finding was the great strength of the EOD pulses of M. hasselquistii. For a mormyrid with a sophisti- cated electrocommunication and electrolocation system, which must also be assumed for M. hasselquistii, it would appear counterproductive to generate EODs so strong they are painful to a human handling the fish, and probably also to other non-electroreceptive organisms if sufficiently close.
Neither ‘private’ communication, clandestine electroloca- tion, or even ‘electrofishing’ (i.e. immobilising prey by electro- shocking) appear to be possible, because the EODs of M. hasselquistii are almost certainly too strong for the first two functions, but probably not strong enough for the last.
It is unknown whether or not M. hasselquistii can electri- cally disable prey organisms, as can the electric catfish
Malapterurus. They might, however, deter predators, even though the fish appears to be so sturdy and strong that, from a certain size upwards, it might not need such protection.
Their unexpected EOD strength requires additional research.
Even though the ‘blind’ in situ EOD recording of the EOD of a putative M. longirostris in the Lower Zambezi was clipped at its phasing out (Figure 7), it clearly shows that differentiation from the Upper Zambezian species, M.
lacerda, is not limited to morphology but includes the EOD.
Principal component analysis revealed pertinent features of value in Mormyrus taxonomy. It is tempting to speculate that the variation in strength of the EODs of Mormyrus is correlated with caudal peduncle depth, the character that loaded PC1 most strongly. A fisherman reported that M.
subundulatus shocks more strongly than M. rume (Roberts 1989), the caudal peduncle of the former being deeper, whilst M. hasselquistii also has a deep caudal peduncle.
A more quantitative measure of EOD voltage and current output, or shocking strength, is desirable for future studies.
The present study has confirmed the validity of M.
subundulatus, a syntopical sibling species to Mormyrus rume discovered in the Bandama River, Côte d'Ivoire (Crawford and Hopkins 1989, Roberts 1989). The present study has added information on electrical and morphological charac- teristics of the two sibling species. The EODs of M. rume and M. subundulatus of a more mature size were substan- tially longer in the present study than in that of Crawford and Hopkins (1989), and the P1 phase amplitudes of the EODs of M. subundulatus were twice as strong. However, there was no notable difference in the P1 phase amplitudes for M. rume. These and other quantitative differences could be due to ontogenetic development, temperature difference, or recording artefact. Ontogenetic growth definitely partly explains the differences between the EODs of M. subundu- latus and M. rume recorded in the two studies.
A longer average EOD duration in M. rume than in M.
subundulatus is explained by a sex difference in the former:
the N phase duration in male M. rume was almost twice that of females. No such sex difference was observed in any of the other Mormyrus species.
In order to describe the marked degree of differentiation and its evolution within the genus Mormyrus across Africa, many more rivers and lakes need to be sampled for this genus. Especially needed are samples from Central Africa and Angola, and from East Africa and north-eastern Africa.
Acknowledgements — Many thanks go to Prof. R Vuattoux, Station d’écologie de Lamto, and Prof. M Mühlenberg, University of Würzburg, for support and hospitality in Côte d'Ivoire, and to the Governments of Côte d'Ivoire, Kenya, Namibia, Botswana and Mozambique for granting fieldwork permission. Prof. H van der Bank, University of Johannesburg, Dr E Swartz, Prof. P Skelton and R Bills of the South African Institute for Aquatic Biodiversity and the late Dr L De Vos, Nairobi Museum, are thanked for support in the field, with collections etc. Dr R Bigorne, Muséum d’Histoire Naturelle, Paris, for morphological information on West African Mormyrus species. Dr U Schliewen and D Neumann, Zoologische Staatssammlung München, for institutional collection support.
Prof. P Moller, Hunter College, New York, for a joint field trip to Côte d'Ivoire together with M Postner, and a second trip with I Kaunzinger. Sincere thanks are due also to the Regensburg University morphology team: B Otto, E Fröhlich, S Förster, B Blaul, S Füssel, T Gierl, S Hartl, M Lange, A Lechner and P Machnik.
Financial support from the Deutsche Forschungsgemeinschaft, grant KR 446/12-2 and previous grants, is gratefully acknowledged.
References
Adebisi AA. 1987. The relationships between the fecundities, gonadosomatic indices and egg sizes of some fishes of Ogun River, Nigeria. Archiv für Hydrobiologie 111: 151–156.
Authman MMN, Khallaf EA. 2009. Spermatogenesis of Mormyrus kannume (Forsskål, 1775) (Teleostei: Mormyridae) from Bahr Shebeen Nilotic Canal, Delta, Egypt. Egyptian Journal of Aquatic Biology and Fisheries 13: 361–384.
Bauer R, Kramer B. 1974. Agonistic behaviour in mormyrid fish: latency relationship between the electric discharges of Gnathonemus petersii and Mormyrus rume. Experientia 30: 51–52.
Bell-Cross G, Minshull JL. 1988. The fishes of Zimbabwe. Harare:
National Museums and Monuments of Zimbabwe.
Bertin L. 1940. Catalogue des types de poissons du Muséum National d’Histoire Naturelle. 2e partie. Dipneustes, Chondrostéens, Holostéens, Isospondyles. Bulletin du Muséum National d’Histoire Naturelle (Série 2), 12: 244–322.
Bigorne R. 2003. Mormyridae. In: Paugy D, Lévêque C, Teugels GG (eds), Poissons d’eaux douces et saumâtres de l’Afrique de l’Ouest. (The fresh and brackish water fishes of West Africa) Vol.
1. IRD Éditions, Paris. Publications scientifiques du Muséum, MRAC. pp 155–222.
Bracewell RN. 1986. The Fourier transform and its applications.
New York: McGraw-Hill.
Bullock TH, Hopkins CD, Popper AN, Fay RR (eds). 2005.
Electroreception. New York: Springer.
Copley H. 1941. A short account of the freshwater fishes of Kenya.
Journal of the East Africa and Uganda Natural History Society 16: 1–24.
Copley H. 1958. Common freshwater fishes of East Africa. London:
HF and G Witherby.
Crawford JD, Hopkins CD. 1989. Detection of a previously unrecognized mormyrid fish (Mormyrus subundulatus) by electric discharge characters. Cybium 13: 319–326.
Davis PJ, Hersh R. 1980. The mathematical experience. Boston:
Birkhäuser.
Fawole OO. 2002. Morphometry and diet of Mormyrus rume in the Lekki lagoon, Nigeria. Revista de Biología Tropicale 50:
689–694.
Fricke R, Eschmeyer WN. 2012. A guide to fish collections in the [CalAcademy] Catalog of Fishes database. On-line version, accessed August 2012.
Gilmore C. 1979. The effects of ULV aerial applications of endosulfan on the feeding habits of Schilbe mystus and Mormyrus lacerda in the Okavango delta, 1977. Botswana Notes and Records (Gaborone) 11: 107–114.
Iles RB. 1960. External sexual differences and their significance in Mormyrus kannume (Forskål, 1775). Nature 188: 516.
Jubb RA. 1967. Freshwater fishes of southern Africa. Cape Town, Amsterdam: Balkema.
Keuper A. 1988. FFT in der Praxis. Grundlagen und Hinweise zur Anwendung der Fast-Fourier-Transformation. Elektronik Journal 20: 104–110.
Khallaf EA, Authman MMN. 2009. Oogenesis of females of the Nile mormyrid fish, Mormyrus kannume (Forsskål, 1775) from Bahr Shebeen Canal, Egypt. Egyptian Journal of Aquatic Biology and Fisheries 13: 333–359.
Khallaf EA, Authman MMN. 2010. Some biological aspects of the Nile mormyrid fish, (Mormyrus kannume, Forsskål, 1775), from Bahr Shebeen Nilotic Canal, Egypt. World Journal of Fish and Marine Sciences 2: 357–375.
Kirschbaum F, Schugardt C. 2002. Reproductive strategies and developmental aspects in mormyrid and gymnotiform fishes.
Journal of Physiology - Paris 96: 557–566.
Kolding J, Tirasin EM, Karenge L. 1992. Growth, mortality, maturity and length-weight parameters of fishes in Lake Kariba, Africa.
NAGA 15: 39–41.
Kouamélan PE, Teugels GG, Gourène G, Ollevier F, Thys van den Audenaerde DFE. 1999. The effect of a man-made lake on the diet of the African electric fish Mormyrus rume Valenciennes, 1846 (Osteoglossiformes; Mormyridae). Hydrobiologia 380:141–151.
Kramer B. 1974. Electric organ discharge interaction during interspecific agonistic behaviour in freely swimming mormyrid fish. A method to evaluate two (or more) simultaneous time series of events with a digital analyser. Journal of Comparative Physiology A 93: 203–235.
Kramer B. 1976. Electric signalling during aggressive behaviour in Mormyrus rume (Mormyridae, Teleostei). Naturwissenschaften 63:
48.
Kramer B. 1990. Electrocommunication in teleost fishes: behavior and experiments. Berlin: Springer-Verlag.
Kramer B. 1996. Electroreception and communication in fishes.
Stuttgart: Gustav Fischer Verlag.
Kramer B. 1997. A field study of African elephantfish (Mormyridae:
Teleostei): electric organ discharges in Marcusenius macrolepidotus (Peters, 1852) and Petrocephalus catostoma (Günther, 1866) as related to sex. Journal of African Zoology 111: 313–341.
Kramer B, Skelton P, van der Bank H, Wink M. 2007. Allopatric differentiation in the Marcusenius macrolepidotus species complex in southern and eastern Africa: the resurrection of M. pongolensis and M. angolensis, and the description of two new species (Mormyridae: Teleostei). Journal of Natural History 41: 647–708.
Kramer B, Swartz E. 2010. A new species of Slender Stonebasher within the Hippopotamyrus ansorgii complex from the Cunene River in southern Africa (Teleostei: Mormyriformes). Journal of Natural History 44: 2213–2242.
Kramer B, van der Bank FH. 2011. The Victoria Falls, a species boundary for the Zambezi Parrotfish, Cyphomyrus discorhynchus (Peters, 1852), and the resurrection of Cyphomyrus cubangoensis (Pellegrin, 1936) (Mormyridae: Teleostei). Journal of Natural History 45: 2669–2699.
Kramer B, van der Bank FH, Wink M. 2004. The Hippopotamyrus ansorgii species complex in the Upper Zambezi River System with a description of a new species, H. szaboi (Mormyridae).
Zoologica Scripta 33: 1–18.
Kramer B, Westby GWM. 1985. No sex difference in the waveform of the pulse type electric fish, Gnathonemus petersii (Mormyridae). Experientia 41: 1530–1531.
Kramer B, Weymann D. 1987. A microprocessor system for the digital synthesis of pulsed or continuous discharges of electric fish (or animal vocalizations). Behavioural Brain Research 23:
167–174.
Lavoué S, Bigorne R, Lecointre G, Agnèse J-F. 2000. Phylogenetic relationships of mormyrid electric fishes (Mormyridae; Teleostei) inferred from cytochrome b sequences. Molecular Phylogenetics and Evolution 14: 1–10.
Lévêque C, Bigorne R. 1985. Répartition et variabilité des caractères méristiques et métriques des espèces du genre Mormyrus (Pisces – Mormyridae) en Afrique de l’Ouest. Cybium 9: 325–340.
Lévêque C, Paugy D. 1984. Guide des poissons d’eau douce de la zone du programme de lutte contre l’onchocercose en Afrique de l’Ouest. Convention ORSTOM-OMS, Paris.
Lévêque C, Paugy D, Teugels GG. 1990. Faune des poissons d’eaux douces et saumâtres de l’Afrique de l’Ouest. Tervuren (Belgium): Musée Royal de l’Afrique Centrale; Paris: Editions de l’ORSTOM.
Leviton AE, Gibbs RH, Heal E, Dawson CE. 1985. Standards in herpetology and ichthyology: Part I. Standard symbolic codes for institutional resource collections in herpetology and ichthyology.
Copeia 1985: 802–832.
McGarigal K, Cushman S, Stafford S. 2000. Multivariate statistics for wildlife and ecology research. New York: Springer Verlag.
Moller P. 1995. Electric fishes: history and behavior. London:
Chapman and Hall.
Paugy D, Lévêque C, Teugels GG. 2003. Poissons d’eaux douces et saumâtres de l’Afrique de l’Ouest. (The fresh and brackish water fishes of West Africa.) Paris: IRD Éditions; Publications scientifiques du Muséum, MRAC.
Peters WCH. 1882. Über drei neue Arten von Mormyrus aus Ost- und Westafrica und eine Art von Clarias aus Westafrica.
Sitzungsberichte der Gesellschaft naturforschender Freunde zu Berlin, 1882: 72–74.
Roberts TR. 1989. Mormyrus subundulatus, a new species of mormyrid fish with a tubular snout from West Africa. Cybium 13:
51–54.
Scott DBC. 1974. The reproductive cycle of Mormyrus kannume Forsk. (Osteoglossomorpha, Mormyriformes) in Lake Victoria Uganda. Journal of Fish Biology 6: 447–454.
Seegers L, De Vos L, Okeyo DO. 2003. Annotated checklist of the freshwater fishes of Kenya (excluding the lacustrine haplochromines from Lake Victoria). Journal of the East African Natural History Society 92: 11–47.
Skelton PH. 1994. Diversity and distribution of freshwater fishes in East and southern Africa. Annales du Musée Royal de l’Afrique Centrale — Série in-8° — Sciences Zoologiques 275: 95–131.
Skelton P. 2001. A complete guide to the freshwater fishes of southern Africa. Cape Town: Struik.
Tabachnick BG, Fidell LS. 2007. Using multivariate statistics.
Boston: Pearson Education.
Taverne L. 1971. Les os gemmingériens des Mormyridae, leur rôle et leur origine. Revue de Zoologie et de Botanique Africaines 83:
111–114.
Taverne L. 1972. Ostéologie des genres Mormyrus Linné, Mormyrops Müller, Hyperopisus Gill, Isichthys Gill, Myomyrus Boulenger, Stomatorhinus Boulenger et Gymnarchus Cuvier. Considérations générales sur la systématique des poissons de l’ordre des Mormyriformes. Annales du Musée Royal de l’Afrique Centrale — Série in-8° — Sciences Zoologiques 200: 1–194 + 2 plates.
van der Bank FH, Kramer B. 1996. Phylogenetic relationships between eight African species of mormyriform fish (Teleostei:
Osteichthyes): resolution of a cryptic species, and reinstatement of Cyphomyrus Myers, 1960. Biochemical Systematics and Ecology 24: 275–290.
van der Waal BCW. 1985. Aspects of the biology of the larger fish species of Lake Liambezi, Caprivi, South West Africa. Madoqua 14: 101–144.
von der Emde G. 1992. Electrolocation of capacitive objects in four species of pulse-type weakly electric fish. II. Electric signalling behaviour. Ethology 92: 177–192.
von der Emde G, Ringer T. 1992. Electrolocation of capacitive objects in four species of pulse-type weakly electric fish. I.
Discrimination performance. Ethology 91: 326–338.
Walton AG, Moller P. 2010. Maze learning and recall in a weakly electric fish, Mormyrus rume proboscirostris Boulenger (Mormyridae:
Teleostei). Ethology 116: 904–919.
Whitehead PJP. 1959. Notes on a collection of fishes from the Tana River below Garissa, Kenya. Journal of the East African Natural History Society 23: 167–171.
Zaher MM, Ashour MB, Rida S. 1991. Ecological studies on the female reproductive cycle of some fishes of the River Nile at Ben Suef area. Seasonal morphological and macroscopic changes of the ovary of Mormyrus kannume, Chrysichthys auratus and Schilbe mystus. Journal of the Egyptian-German Society of Zoology 3: 313–334.
Received 13 September 2012, accepted 13 October 2012 Edited by MM Coke