www.giga-hamburg.de/workingpapers
orking Papers serve to disseminate the research results of work in progress prior to publicaton to encourage the exchange of ideas and academic debate. n of a paper in the Working Papers series does not constitute publication and should not limit publication in any other venue. Copyright remains with the authors.
GIGA Research Programme:
Socio-economic Challenges in the Context of Globalisation
___________________________
MDG Achievements, Determinants, and Resource Needs: What Has Been Learnt?
Jann Lay
No 137 June 2010
GIGA Working Papers
Edited by the
GIGA German Institute of Global and Area Studies Leibniz‐Institut für Globale und Regionale Studien
The GIGA Working Papers series serves to disseminate the research results of work in progress prior to publication in order to encourage the exchange of ideas and academic debate. An objective of the series is to get the findings out quickly, even if the presentations are less than fully polished. Inclusion of a paper in the GIGA Working Papers series does not constitute publication and should not limit publication in any other venue. Copyright remains with the authors. When working papers are eventually accepted by or published in a journal or book, the correct citation reference and, if possible, the corresponding link will then be included on the GIGA Working Papers website at <www.giga‐hamburg.de/
workingpapers>.
GIGA research programme responsible for this issue:
Socio‐economic Challenges in the Context of Globalisation Editor of the GIGA Working Papers series: Bert Hoffmann
<workingpapers@giga‐hamburg.de>
Copyright for this issue: © Jann Lay English copy editor: Melissa Nelson
Editorial assistant and production: Silvia Bücke
All GIGA Working Papers are available online and free of charge on the website
<www.giga‐hamburg.de/workingpapers>.
For any requests please contact:
E‐mail: workingpapers@giga‐hamburg.de Phone: ++49 (0)40 ‐ 4 28 25 ‐ 548
The GIGA German Institute of Global and Area Studies cannot be held responsible for errors or any consequences arising from the use of information contained in this Working Paper; the views and opinions expressed are solely those of the author or authors and do not necessarily reflect those of the Institute.
GIGA German Institute of Global and Area Studies Leibniz‐Institut für Globale und Regionale Studien Neuer Jungfernstieg 21
20354 Hamburg Germany
E‐mail: info@giga‐hamburg.de Website: www.giga‐hamburg.de
MDG Achievements, Determinants, and Resource Needs:
What Has Been Learnt?
Abstract
This paper reviews the effectiveness and efficiency of key policy instruments for MDG (Millennium Development Goals) achievement. We first demonstrate that average MDG progress is likely to be too slow to meet the education and health sector targets in a num‐
ber of developing countries. We also show that MDG achievement can be described by a transition path with declining rates of progress. More detailed analysis reveals that the transition towards universal primary enrollment in poor countries with low initial enroll‐
ment has accelerated considerably in the more recent past. The paper then focuses on the role of demand‐ versus supply‐side factors in social service utilization in education and health. The main policy conclusions of the review reflect some of the key determinants of MDG achievement: First, specific single‐policy interventions can have a considerable im‐
pact on social service utilization and specific human development outcomes. For example, improving access to basic health services, in particular to vaccination, has been a key factor in reducing child mortality rates in a number of very poor countries. Second, demand‐side policies have proved extremely effective, for example, in increasing school enrollment and attainment levels. However, there may be more scope for targeting the demand side in the health sector. Third, policy effectiveness and efficiency are highly dependent on initial conditions and the specificities of the respective policy. Fourth, complementarities between MDG targets, in particular social service utilization, are likely to be very important.
Keywords: Millennium Development Goals, Public Services JEL‐Codes: H51, H52, I18, I28, I38, O21
J‐Prof. Dr. Jann Lay
is head of the GIGA’s “Socio‐economic Challenges in the Context of Globalisation” research program and a junior professor at the University of Göttingen. His research focuses on the poverty and distributional impact of economic and social policies in developing countries.
Contact: lay@giga‐hamburg.de
Website: http://staff.en.giga‐hamburg.de/lay
http://www.economics.uni‐goettingen.de/lay
Erfolge, Determinanten und Mittel zur Erreichung der MDG (Millenniums‐Entwicklungs‐
ziele): Was ist daraus zu lernen?
Ein primäres Anliegen dieses Beitrages ist die Untersuchung der Effektivität und Effizienz von Politikinstrumenten zu Erreichung der Weltentwicklungsziele. Zu Beginn wird ge‐
zeigt, dass der durchschnittliche Fortschritt zu langsam ist, um die angestrebten Ziele im Gesundheits‐ und Bildungssektor in einer Vielzahl von Entwicklungsländern zu erreichen.
Festzustellen ist, dass sich der Transitionspfad durch eine abnehmende Fortschrittsge‐
schwindigkeit auszeichnet. Detailliertere Analysen zeigen, dass es in jüngster Vergangen‐
heit beachtliche Erfolge bezüglich des Besuches von Primarschulen in armen Ländern – bei sehr schlechter Ausgangslage– gegeben hat.
Ein weiterer Aspekt der Untersuchung ist die Rolle von nachfrage‐ versus angebotsorien‐
tierten Faktoren, welche die Nutzung von öffentlichen Dienstleistungen im Gesundheits‐
und Bildungssektor beeinflussen.
– Erstens können spezifische einzelne Interventionen eine herausragende Wirkung in Bezug auf die Nutzung öffentlicher Dienstleistungen und direkter Entwicklungsindi‐
katoren erzielen. So ist beispielsweise der Zugang zu grundlegenden Gesundheits‐
dienstleistungen, insbesondere Impfungen, ein bedeutsamer Faktor für die stark ab‐
nehmenden Kindersterblichkeitsraten in einer ganzen Reihe von Ländern. Dennoch gibt es offenbar nicht ausgeschöpfte Potentiale im Gesundheitssektor.
– Zweitens haben sich nachfrageorientierte Maßnahmen – insbesondere zur Erhöhung der Einschulungsraten – als sehr effektiv herausgestellt.
– Drittens sind sowohl die Effektivität –als auch die Effizienz von politischen Maßnah‐
men entscheidend von den Ausgangsbedingungen und Charakteristika des jeweiligen Instruments abhängig.
– Viertens sind allem Anschein nach die Komplementaritäten zwischen unterschiedli‐
chen Weltentwicklungszielen von großer Bedeutung.
Jann Lay
Article Outline 1 Introduction
2 Social Sector MDGs: A Conceptual Framework 3 The Empirics of MDG Achievement
4 Conclusion
1 Introduction
With only five years left to 2015, it is clear that most of the Millennium Development Goals (MDGs) will not be attained within the envisaged timeframe—either globally or by a major‐
ity of individual countries.1 This likely failure tends to overshadow the many successes of individual countries or in specific areas. The world has witnessed rapid declines in child mortality in a number of countries in the past 20 years, and millions of poor children have been brought into schools. The failures as well as the successes of the MDG process provide an opportunity to learn for MDG planning, both in the short term and beyond 2015.
The MDG process has certainly helped poor countries and development policy to focus on specific development and poverty‐reduction challenges. An important element in this more focused effort has been the systematic monitoring of progress on the basis of quantita‐
tive indicators. Additionally, quite some effort has been dedicated to identifying key policy instruments, assessing their effectiveness for MDG achievement, and quantifying the related
1 The author gratefully acknowledges funding from the World Bank’s Knowledge for Change Program. The
work has also been supported by the PEGNet. Excellent research assistance has been provided by Ali Buchberger. Comments by Hans Lofgren and an anonymous referee at the World Bank have been very help‐
ful. All remaining errors are my own.
resource requirements. The core objective of this paper is to review these efforts in light of actual progress made and to assess recent evidence on the effectiveness and efficiency of se‐
lected policy instruments. A particular focus of the review is the role of demand‐ versus sup‐
ply‐side factors in social service utilization in education and health. Service utilization in these sectors represents both the target of, and input into, MDG achievement.
We first provide a conceptual framework of human development outcomes and their determinants. This framework, which focuses on social service utilization and highlights the role of demand‐side factors, is briefly compared to other frameworks used in MDG planning exercises. The second part of the paper is concerned with the empirics of MDG achieve‐
ments. Here, we take a bird’s eye view of the patterns of MDG achievement, before entering into a detailed discussion of recent microeconomic evidence with an emphasis on the role of demand‐ versus supply‐side factors in education and health service utilization. The final sec‐
tion concludes with the main lessons learnt for MDG planning.
2 Social Sector MDGs: A Conceptual Framework
The key role of social services in human development is manifest in the fact that some MDG targets are formulated in terms of social service utilization, for example, targets related to education. The starting point of our conceptual framework will therefore be a specification of the supply and the demand sides of public services.2 We want to express the supply of a so‐
cial service i by a function s where social services i = 1, 2, …, N include the provision of pri‐
mary and secondary schooling facilities, the provision of health‐care services, and the provi‐
sion of water and sanitation infrastructure. The supply of most public services can be mean‐
ingfully operationalized at the municipal, community, or somewhat larger regional levels.
The relevant localities are denoted by c.
) , , , , ,
( i i c
s
c s p w L LT G
q i = (1)
p (w) denotes a vector of (factor) prices; L is a vector of inputs (labor, capital, infrastructure) with i referring to sector‐specific (i) inputs; Ti captures sector specific but nationwide govern‐
ance and technology factors, while Gc refers to local geographical and governance factors.
The demand for social service i can be described as a function of individual, household and community factors summarized in a vector X, and again vectors of prices p and w. These de‐
terminants typically include education (of the household or individual household members, in particular mothers), ability, wealth, income, cultural factors, and awareness. Demand will be exercised by households hh (or individuals).
2 We presume to be able to distinguish precisely between demand‐ and supply‐side factors. For some variables that simultaneously affect demand and supply, for example, rural roads that facilitate access to health and education facilities, this distinction may be blurred.
) , ,
(X w p
d
qhhdi = hh (2)
The resulting level of public service use qhh*i at the household level will hence be a function of all the arguments in the respective demand and supply functions. It can be thought of as a dichotomous variable of use or nonuse of social services, but it may also be a continuous variable reflecting the intensity of use and/or the quality of the respective service, for example, education.3
) , , , , , ,
* ( i
hh c i i i
hh f p w L LT G X
q = (3)
Equation (3) typically underlies empirical work on the “demand” for public services, although such equations are in fact reduced‐form public service–use equations that incorporate both lo‐
cal supply and household‐ or individual‐level demand‐side factors. We now want to extend this basic framework by adding some features that are particularly relevant in the MDG con‐
text. The first such feature is the complementarity of social services, that is, the fact that utiliza‐
tion in different sectors tends to be mutually reinforcing. We can think of numerous examples of such complementarities: children of better‐educated parents are more likely to go to school and to receive regular health checks. In turn, healthier children (and children of healthier par‐
ents) are more likely to go to school. Within our analytical framework, these complementarities can be accommodated by “endogenizing” household characteristics (Equation 4), which are a function g of some truly exogenous characteristics Xhhi and social services j other than i. Note that complementarities are assumed to arise on the demand side only, although there may be supply‐side complementarities as well. Schools, for example, can be places where health inter‐
ventions can take place, thus lowering the cost of the respective intervention.
) , ( hh*j hhi
i
hh g q X
X = with i≠ j (4)
Which household characteristics can be assumed to be constant (or truly exogenous) de‐
pends on the time horizon of the analysis. While the effects of child health on school atten‐
dance will be immediate, the impact of better education of girls, that is, future mothers, on child health will take years to materialize.
The resulting level of aggregate service use Qi*will result from the matching of supply at the local level and demand at the household level. Let qhh*i be a dichotomous variable that assumes a value of one if the household uses service i. Then, the aggregate level of social ser‐
vice utilization will be the sum of qhh*i over all households hh divided by N, the total number of households.
N q Q
N
hh i hh
i* =
∑
* (5)
3 For illustrative purposes we ignore the quality of social services in the subsequent conceptual discussion and instead focus on quantity.
What the above framework effectively illustrates is that the final level of social service utiliza‐
tion will depend on the joint distribution of community‐ and household‐level factors over households. This has important implications, which can be exemplified as follows. We con‐
sider the household decision to enroll its children in school, a decision that in most poor coun‐
tries depends critically on household income.4 Poor households, for example, rely on child work, and reservation wages for those children are hence relatively low. For the individual household, we therefore expect that enrollment increases with greater per capita income.
More specifically, we assume that a child is enrolled when household per capita income passes a specific threshold. All other (demand and supply) factors are assumed to remain constant. We further assume that log per capita incomes are roughly normally distributed, as they often are in reality. This is illustrated in Figure 1 below, where the initial income distribu‐
tion of log incomes x is denoted by ha. In this situation, the share of children enrolled in school corresponds to the area below ha to the right of t. If all per capita incomes in this model econ‐
omy grow at the same rate, the income distribution shifts to the right (to hb) with mean b. The share of children enrolled increases to the area to the right of t and below hb. On the right in the figure below, we now relate mean per capita income (assuming distributionally neutral changes) and the Q*, that is, the area under the respective distribution function. It is clear that the partial derivative of Q* to changes in mean per capita income will be small at low levels of income, since few individuals pass the threshold. As the mode of distribution approaches the threshold, enrollment increases more quickly, before slowing again at higher levels of income.
Such a pattern would indeed result over time in our stylized world with log‐normally distrib‐
uted income when incomes grow at a constant rate. We will pick up on this point later.
Figure 1: Social Service Use as a Function of (Mean) Income with Threshold Effects
Source: Author’s compilation.
4 We ignore endogeneity of income in this simple example.
a b a b t
hx Q*
Mean(x) x
ha
hb
This simple example illustrates two important points. First, it highlights the importance of the distribution of determinants at both the household and the local(ity) level for social ser‐
vice use. Second, it implies that the level of public service use follows a pattern similar to the cumulative distribution function of any bell‐shaped distribution function—if the respective determinant follows such a distribution. This means that progress towards social service utilization would be slow initially, gain momentum at middle stages, and eventually slow down—an s‐shaped transition path.
The example uses the case of income, which may indeed represent an important de‐
mand‐side constraint in a number of social sectors. However, such factors are not limited to income. On the demand side, another important factor is education, and an argument similar to the one made for income can be made for educational levels. Another example is the dis‐
tance to the next urban area, for example, with a health facility. Here, a process of urbaniza‐
tion that typically accompanies economic development would not only decrease the mean but would also compress the distribution of these distances. This mechanism may thus also cause an s‐shaped transition.
In these examples, we have made our argument ceteris paribus, that is, assuming that other factors that influence service use remain constant. In reality, of course, this is not the case and all these determinants, for example, income, education, and the degree of urbaniza‐
tion, change simultaneously. As suggested above, intertemporal complementarities, for ex‐
ample, the role of future mothers’ education, would also have to be considered if one exam‐
ined transition paths through time. In Figure 1 the right‐hand panel would then depict t on the x‐axis. Although we do not intend to develop a full analytical argument here, many of the contemporaneous relationships between different determinants tend to be mutually rein‐
forcing and are therefore likely to render transition paths towards higher levels of service utilization steeper around the inflection point. Strong intertemporal complementarities would probably make transition paths flatter ceteris paribus, since they imply a lagged accel‐
eration of progress.
So far we have focused on social service use. Ultimately, however, human development goals are not equivalent to social service utilization but rather to capabilities and functioning, to use the concepts of Sen’s (Sen, 1999; Alkire, 2001) capability approach. The MDG targets include a number of quantitative indicators of these functionings and capabilities. For exam‐
ple, the ability to cover basic necessities, particularly freedom from hunger; the ability to read and write; and the achievement of low child mortality rates. Ultimately, social services are instruments to achieve these human development ends. The catalogue of MDG targets, however, is a list of both human development targets, in the sense of functioning and capa‐
bilities, as well as instruments, such as universal primary education and the measles vaccina‐
tion target.
We also want to briefly conceptualize these relationships with a focus on nonincome goals. MDG outcomes are first formulated at the household level (Equation 6). MDG
achievement should again be thought of as a dichotomous variable indicating the success or failure of the individual household to escape poverty or hunger, to send children to school, to prevent death in early childhood, etc.5
) , ,
( hh*k hhj hhi
i
hh g q mdg X
mdg = k∈Ki and i≠ j (6)
The set of social services Ki that enters into the achievement of MDG target i at the household level will differ across social targets. Child mortality, for example, will be influenced by a number of social services, such as child vaccination programs, professionally assisted deliv‐
eries, and access to water and sanitation. Equation (6) also illustrates that the human devel‐
opment targets may be interrelated, in addition to the relation between different social ser‐
vices (already incorporated in qhh*k). An important set of complementarities exists between health outcomes on the one hand and income‐, consumption‐, or food‐related outcomes on the other. These complementarities are known to run in both directions. In some cases there may be important time lags in these complementarity relationships. Considerable reductions in child mortality, for example, will increase the number of school‐age children. Educating young girls today will probably make them and their offspring healthier. Finally, we have in‐
cluded a vector of other household determinants Xhhi . Similarly to the above formulation for social service utilization, the formulation for individuals (households) can now be aggre‐
gated and divided by the total number of households N.
N mdg MDG
N
hh j hh
j =
∑
** (7)
This analytical formulation highlights the complexity of MDG achievement and its determi‐
nants. The framework stresses the importance of the interplay of demand‐ and supply‐side factors in social service use. It also illustrates that MDG targets operate at multiple levels, here, most importantly, in terms of social service utilization and human development out‐
comes. Many of these targets are interrelated horizontally, that is, at the service or outcome level, as well as vertically, that is, from services to outcomes or vice versa. An obvious—and empirically well established—horizontal relationship exists, for example, between income, poverty, and maternal and child health. Vertical relationships include the impact of social services on outcomes, for example, the effect of school enrollment on literacy, as well as the indirect links in the opposite direction that often operate with time lags, for example, the ef‐
fect of maternal literacy on the use of health care.
The importance of demand‐side factors in social service utilization and these (often re‐
lated) interdependencies would probably lead to important complementarities between dif‐
ferent MDG targets. These factors may also imply that MDG achievements follow s‐shaped transition paths, as indicated in Figure 1. Whether this is indeed the case, and which deter‐
5 As mentioned above, some MDG targets are directly equivalent to service utilization, which can be easily ac‐
commodated in this framework.
minants and interdependencies are of particular importance for MDG achievement, are em‐
pirical questions. Obviously, addressing (some of) these questions empirically is a daunting task, and we will review relevant evidence to date in the subsequent section.
The first set of questions regards the assumption of the presence of s‐shaped transition patterns in MDG achievement. More specifically, can we indeed detect an s‐shaped transition pattern for social service utilization and human development outcomes? Are these transition patterns universal across MDG sectors, for example, health and education; across different MDG target levels, for example, vaccination and child mortality (or school enrollment and literacy); and across countries? Can we identify countries that depart from such transition patterns? The second set of questions refers to the relevant determinants of MDG achieve‐
ment. Can we identify the key factors and interventions of social service use and human de‐
velopment outcomes? What is the role of supply‐ vis‐à‐vis demand‐side factors in social ser‐
vice utilization? In particular, what do we know about MDG complementarities? And finally, are these relationships quantifiable?
3 The Empirics of MDG Achievement
Addressing the first set of questions will require a bird’s eye view. Using a cross‐country re‐
gression framework, we attempt to identify universal transition paths and to highlight the selected peculiarities and possible deviations from such paths of specific (groups of) coun‐
tries. In this exercise we will focus on education (more specifically net primary enrollment6) and health (here (under‐five) child mortality) to illustrate our main arguments. The second set of questions will be investigated through a thorough review of the available and primar‐
ily microeconomic evidence on supply‐ and demand‐side factors in MDG achievement with a focus on social service utilization, again in primary education and health.
Progress and Transition Paths
In order to examine progress towards MDG achievement, we model MDG targets only as a function of time.7 The time path of MDGt ∈
] [
0,1 is assumed to follow an s‐shaped function.To represent such a shape, we will use the cumulative logistic distribution function denoted by F, a cumulative distribution function often chosen because of its simple form.
) , , ( )
(t F b t
MDG =
μ
(8)μ and b are parameters that describe the underlying logistic distribution function with μ, the mean, and b, a parameter related to the variance with 2 2 2
3 1π b
σ = . Equation (8) can then be writ‐
ten in closed form as
6 Net primary enrollment is the ratio of the number of children of official school age (as defined by the national education system) who are enrolled in primary school to the total population of children of official school age.
7 See Clemens (2004) and Clemens et al. (2007) for similar approaches.
(
1+ −(− )/) (
−1 = 1+ −( + ))
−1= t μ b βt α
t e e
MDG (9)
with
β
=1/b andα
=−μ
/b. Rearranging terms and taking logs on both sides yields the following equation:MDGt − =
α
+β
t− 1 1)
ln(
(10)
This growth curve assumes an increasing and then decreasing adjustment speed of attain‐
ments with an inflection point at t =
μ
=−α
b, the mean of the underlying (symmetric) logis‐tic distribution function. MDGt will be 0.5 at the inflection point: half‐way achievement. We now add a country‐fixed effect uc and a random error ε, which yields estimation equation (11).
ε β
α
+ + +=
−
− c
t
u MDG1 1) t
ln(
(11)
We estimate this equation using Ordinary Least Squares (with country‐fixed effects) on data on net primary enrollment for 1991, 1999 (or 2000), and 2006 (or 2007) from the MDG moni‐
toring website run by the United Nations. The sample only includes developing countries, here roughly defined as low‐ and middle‐income countries with a GDP per capita of less than US$10,000 in 1990 (in current USD). The inclusion of a country‐fixed effect allows coun‐
tries to start at different points in time. We then repeat this exercise for (under‐five) child mortality using data from the same source, but for 1990, 1995, 2000, and 2006. Note that we need to normalize child mortality by setting a maximum initial level, which we choose to be 300. The results of estimating equation (11) for both net primary enrollment and under‐five child mortality are reported in the Appendix.
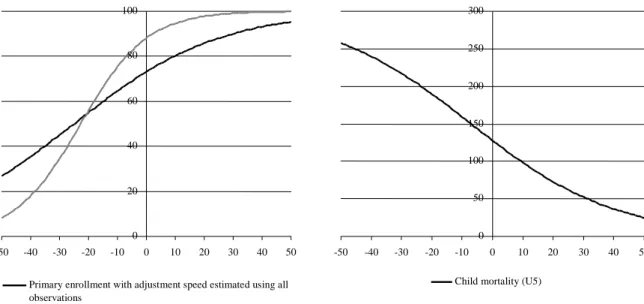
The empirical results for these two social sector targets are remarkable. Overall, there is quite some similarity, across countries as well as across sectors. On an unrestricted sample, the parameter β is 0.040 for primary enrollment and 0.042 for under‐five child mortality. Fig‐
ure 2 illustrates the implications of these parameter values in terms of MDG progress rates.
Note that the constant (plus the country‐specific fixed effect) puts each country at a different (starting) point on the time axis t. The black line in the graph on the left‐hand side shows that the average developing country would need, for example, approximately 25 years to increase enrollment from 40 percent (a rate common in poor Sahel countries in the early 1990s, for ex‐
ample) to 65 percent. Similarly, bringing child mortality from 250 to less than 100, that is, a two‐thirds reduction, would take more than 50 years. These results are in line with the find‐
ings by Clemens et al. (2007), who estimate similar specifications for a number of social de‐
velopment outcomes—albeit for much longer time spans (1960–2000). The authors conclude, first, that for the majority of developing countries, the attainment of most MDG targets was unrealistic to begin with. Second, they state that the expectations created by the MDG proc‐
ess were unreasonable, and that only under optimal circumstances and policies would poor countries be in a position to achieve the progress necessary to meet the MDGs.
Figure 2: Transition Paths of Net Primary Enrollment and (Under‐Five) Child Mortality
0 50 100 150 200 250 300
-50 -40 -30 -20 -10 0 10 20 30 40 50
Child mortality (U5) 0
20 40 60 80 100
-50 -40 -30 -20 -10 0 10 20 30 40 50
Primary enrollment with adjustment speed estimated using all observations
Using only observations with initial enrollment lower than 70 percent
Source: Author’s compilation based on the estimates reported in the Appendix.
Note: The horizontal axis refers to time t.
A less deterministic view that gives less weight to past experience as a benchmark would probably state that inputs into social services and human development outcomes (see equa‐
tions 3 and 6 above), even as part of the MDG process, have not been sufficient. Furthermore, the above regressions refer not only to the past—our estimates refer to a more recent past than those by Clemens et al. (2007)—but also to average paths. The extent to which countries devi‐
ate from this average path is reflected, for example, in the R‐squared of the above underlying regressions, reported in the Appendix. Despite their rudimentary specification, the regressions for child mortality rates exhibit astonishingly high explanatory power. They explain approxi‐
mately 70 percent of the variation. While Clemens (2004) reports similarly high R‐squared for primary enrollment based on a sample of more than 100 countries and data from 1960–2000, the R‐squared for our enrollment equations including all countries is fairly low with only 0.10.
This suggests considerable variation around a time path predicted on the basis of only t and a constant. Yet, when we restrict the sample to include only countries with initial enrollment rates of less than 70 percent, R‐squared increases to approximately 0.5 (see Appendix).
Yet, the unexplained and possibly random variation may not only be around the time path; parameters may also be different across different groups of countries.8 And indeed for primary enrollment, β, which determines the shape of the adjustment curve, is heterogene‐
ous across the sample. If we restrict the sample to the subsample just described, β turns out to be twice as high; that is, countries achieve higher levels of enrollment much more quickly.
This is illustrated in Figure 2, where the grey line shows the corresponding transition pat‐
8 We do not discuss heterogeneity over time here.
tern. Increasing enrollment from 20 to 80 percent would then only take around 30 years. For child mortality, the parameter estimates for a reduced sample of countries with initially high under‐five mortality rates (higher than 50 per 1000 births) do not differ much from those in the original sample.
This may indicate that for latecomers to universal enrollment there has been a consid‐
erable acceleration of progress in recent years. This evidence can be corroborated by taking a closer look at some of the oft‐cited “success” stories. These successes include Ethiopia, Ma‐
lawi, Rwanda, and Uganda, all poor countries whose primary enrollment rates have strongly increased in the past 20 years, potentially enabling some to achieve universal enrollment by 2015. However, these cases may have particular circumstances: a catching‐up process after conflicts in Rwanda and Uganda and relatively high rates of economic growth in Ethiopia and Uganda (and thus higher expected returns to education). Rapid progress in enrollment is also likely to be associated with a decrease in the quality of education, for example, in the case of Uganda (Kappel et al. 2006). Still, these cases indicate that progress in enrollment may be more rapid than in the past. Clemens (2004), however—referring to the same cases plus Togo, Botswana, and Indonesia—warns against such a conclusion. He suggests the care‐
ful evaluation of these experiences and points to problems of increased repetition rates masked by aggregate enrollment statistics, for example, in Togo and Malawi. Countries may also experience “enrollment bubbles,” that is, temporarily higher enrollment due to public policy, combined with a temporary period of very rapid economic expansion and high expec‐
tations. This was the case in Botswana and Indonesia, for example, where enrollment levels stagnated or even fell in the early 2000s.
While the regression results for child mortality seem to show that the scope for very fast improvement is limited, quite a number of examples suggest the opposite. In fact, de‐
creases in under‐five mortality have been well above historical antecedents in recent years in quite a number of developing countries. Recent success stories including countries as diverse as Nepal (142 of 1000 children to 55 between 1990 and 2007), Bangladesh (151 to 61), Eritrea (147 to 70), Lao People’s Democratic Republic (163 to 70), Mongolia (98 to 43), Bolivia (125 to 57), and Malawi (209 to 111) reveal huge mortality rate declines, making the achievement of MDG 4 very likely in these cases (You et al. 2009).9 These reductions of often more than 60 per thousand points were achieved much more quickly—in only 17 years—than would be suggested by the average progress rate above.10
9 At the same time, a number of sub‐Saharan countries have made very little or no progress, so that the subcon‐
tinent now accounts for half of early childhood deaths worldwide. Progress also needs to accelerate in India, Pakistan, and China.
10 These trends typically rest on few data points and should, for some cases, be treated with caution. Yet with the increasing frequency and higher quality of demographic and health surveys in the past 15 years, national health statistics have generally improved considerably.
In many of the success cases, different combinations of supply‐side interventions such as immunization and nutrition programs as well as the strengthening of the health system, particularly in terms of primary care at the community/village level, seem to have been key factors behind the rapid declines. In some cases, for example, Nepal and Laos, these meas‐
ures were accompanied by public awareness campaigns aimed at increasing demand for the services offered. In a cross‐country comparison of eight sub‐Saharan countries, Lay and Ro‐
billiard (2009) also find the expansion of vaccination coverage, a factor that is correlated with other early childhood interventions, to be among the major explanatory factors for the rela‐
tive successes in their sample, for example, in Mozambique and Niger. This is in line with the earlier cross‐country evidence from McGuire (2006), who shows child mortality rates to be strongly associated with maternal and infant health program efforts, while overall public health‐care spending turns out to have no significant effect.11
Supply‐side interventions thus appear to have played a major role in recent child mor‐
tality reductions. For education, in contrast, this first crude assessment of the determinants of MDG achievement suggests a more prominent role for demand‐side factors, specifically in‐
come growth and growth expectations, in recent increases in enrollment. Therefore, we can conclude that there are factors that allow some countries to depart from average trajectories, although the above analysis illustrates that there are probably limits to the variation around these paths. The regression results further indicate that there may indeed be an s‐shaped pat‐
tern of MDG achievement. This pattern may be taken as a sign of the important role of de‐
mand‐side factors, particularly income and its many household‐level correlates.
Determinants of MDG Achievement
It is obvious that social services, without doubt an important component of MDG achieve‐
ment, cannot be used if there is no supply. However, the above framework has illustrated that a given service supply only represents a hypothetical maximum amount of service utili‐
zation—because of the significance of demand‐side factors. Therefore, the following review will mainly be concerned with evidence that sheds light on the relative importance of these two sets of service‐utilization determinants. We then briefly discuss possible complementari‐
ties in service utilization that partly become effective through the influencing of relevant household characteristics, as described in equation (4) above. The focus of our review subse‐
quently shifts to human development outcomes and the links between social service utiliza‐
tion and these outcomes.
On the supply‐side, some of the elementary provisions need to be fulfilled. Social ser‐
vice facilities, particularly schools, health clinics, or vaccination posts, need to be accessible.
Buildings, equipment, and trained personnel therefore need to be available. Recent evidence suggests that absenteeism of teachers and health staff is a substantial problem in many de‐
11 The latter missing effect was identified in earlier studies, for example by Filmer and Pritchett (1999).
veloping countries (Chaudhury et al. 2006). The presence and qualification of personnel is a decisive factor for the quality of the service offered, although the best doctor will not be able to help much without the necessary drugs. In the health sector, poor quality of either equip‐
ment or health staff may even pose a threat to those who seek treatment. Similarly, it is cer‐
tainly not only the number of schools that matters, but also the quality of teaching.
The importance of these factors is well documented for the education sector.12 These supply‐side factors include not only the distance to a school (Glewwe and Jacoby 1994;
Bommier and Lambert 2000; Handa 2002; Glick and Sahn 2006) but also a number of quality‐
related variables ranging from more teachers (Case and Deaton 1999; Chin 2005; Glick and Sahn 2006)13 to building conditions (Drèze and Kingdon 2001; Bedi and Marshall 2002;
Handa 2002; Glick and Sahn 2006). Using a school construction program as a natural experi‐
ment, Duflo (2001) also documents the positive effect of supply‐side interventions, namely, the building of more schools in areas with low enrollment rates. An evaluation of the Boliv‐
ian Social Investment Fund’s school upgrading projects (Newman et al. 2002), however, finds only limited (and often insignificant) effects as a result of better building and equipment con‐
ditions in schools.
The quantitative effects of these interventions are very difficult to compare across stud‐
ies because of differences in interventions and outcome indicators, for example, enrollment versus grade attainment versus cycle completion. Additionally, quite a few of the studies do not (or are not able to) deal with possible biases in their parameter estimates, for example, due to endogenous program placement, and need to be interpreted with care. Chin’s (2005) evaluation of Operation Blackboard, a program which added a second teacher in many pri‐
mary schools in India, shows fairly large effects on primary completion rates, particularly for girls from poor households. Girls’ (and boys’) primary school completion rates increased by 1.6 (1) percentage points for each teacher added by the program per 1,000 students (the base‐
line completion rates for girls and boys were 46 and 64 percent, respectively). On the basis of simulations, Glick and Sahn (2006) report an increase of 6 percentage points (from 42 to 48 percent) in primary enrollment in public schools that hire an additional teacher (reducing multigrade teaching by 50 percent).
In the health sector, the evidence on supply‐side factors is somewhat fragmented along disciplinary lines. Most contributions on health interventions in developing countries come from the natural sciences. The focus of this literature is clearly the impact of interventions on health outcomes, that is, specific components of what a policy maker or economist would call a program. Priority interventions that the authors consider feasible in a low‐income setting are reviewed by Jones et al. (2003). Another more recent review of interventions for maternal
12 See Glewwe and Kremer (2006) for a detailed survey.
13 Better teachers and/or teachers who are present more often may also attract students. Direct evidence of this relationship is scarce, but there is a related literature that examines incentive schemes for teachers, for exam‐
ple, Glewwe at al. (2003) and Duflo and Hanna (2006).
and child undernutrition and survival by Bhutta et al. (2008) contains 209 references to stud‐
ies that examine specific interventions in a developing‐country context. These interventions include, for example, the promotion of breastfeeding, micronutrient interventions, and the reduction of the disease burden (promotion of hand washing and strategies to reduce the burden of malaria during pregnancy). While the cost‐effectiveness of these different inter‐
ventions is without doubt an important input into evidence‐based health policy (and even‐
tual health outcomes), researchers in public health increasingly seem to realize that ulti‐
mately it is the actual utilization of interventions that matters (Bryce et al. 2003; Victora et al.
2004; Kerber et al. 2007). The latter literature tries to identify effective modes of supply that are often specific to certain (types) of interventions and/or analyzes different health‐service delivery systems.
Compared to these approaches, the empirical analysis of the supply side of health ser‐
vices in economics takes a reduced‐form approach and therefore complements the above lit‐
erature. Often, socioeconomic studies first examine the impact of a program (typically not one specific intervention) on effective interventions and then the impact of the program on health outcomes. In their assessment of the Bolivian Social Investment Fund, for example, Newman et al. (2002) find that the program improves the quality of health facilities in par‐
ticipating communities and increases the actual use of services. These improvements have been accompanied by a considerable reduction in under‐five mortality rates, from a rate of 100 per 1000 newborns to a rate of 60 in participating communities. A number of studies fo‐
cus only on the first link in this chain, that is, the effect of supply‐side factors on service utili‐
zation (often called, somewhat confusingly, demand). Sahn et al. (2003) examine the deter‐
minants of health facility visits in Tanzania and find that the quality of medical care has a significant effect on the probability that people will actually seek treatment in these facilities.
Leonard (2007) supports these findings.
However, a recent review of the economics of health in developing countries by Mwabu (2008) for the Handbook of Development Economics concludes that the “developing country literature is largely silent on policies to improve health.” While this statement can hardly be supported beyond the discipline of development economics, there is some truth to it. In contrast to their contributions to study of education policies, development economists have been relatively silent on health policies. This silence partly reflects the relatively poor understanding of the complex interactions between health and socioeconomic factors over the life course, as exemplified by the newly emerging body of literature on the effects of health inputs at very early life stages, which—as we have argued above— interact with so‐
cioeconomic variables and have consequences throughout the life course.14
The silence is even more pronounced on interventions that improve health, as these seem to be difficult to find—at least on the supply side. In a survey on the effects of the
14 See Strauss and Thomas (2008) for a recent review.
availability of primary‐level health facilities, Filmer et al. (2000) conclude that the evidence of
“any effect on health” is mixed and that “even where such evidence exists, the impact is too small to explain the variation in health status.” They point to poorly functioning health facili‐
ties as a possible reason, but stress the possible role of demand‐side factors. We will return to these factors below.15 In fact, compared to Filmer et al.’s (2000) earlier review, our admittedly very selective review of more recent studies on supply‐side health interventions above sug‐
gests a slightly more favorable appraisal of the socioeconomic evidence on the effects of health interventions on the supply side. This may have to do with methodological advances that allow these studies to better account for demand‐side factors and/or endogenous pro‐
gram placement than earlier studies.
The admittedly incomplete literature review of supply‐side factors in the health sector suggests that the evidence is surprisingly patchy, particularly in light of the ample evidence on the medical effects of various supply‐side interventions. With some important exceptions, the debate in leading natural science journals on maternal and child health reflects the rela‐
tive neglect of the socioeconomics of the supply side of effective health service utilization.
This neglect is likely an important source of “randomization bias” in many medical trials of specific interventions in a developing‐country context. To give an example, while a vaccine may be highly effective in reducing child mortality in a randomized experiment (typically carried out in the presence of qualified field staff), the same vaccine may prove ineffective when delivered through local health clinics that lack adequate storage capacity.
Even more important, however, seems to be the neglect of a second socioeconomic component, the demand side, in the discussion on key health interventions in low‐income en‐
vironments. Accordingly, Ensor and Cooper (2004) find virtually no evidence on the effective‐
ness and costs of policy measures designed to overcome demand‐side constraints. This has changed recently, particularly because of the wave of impact evaluations that have accompa‐
nied conditional cash transfer (CCT) programs in a number of developing countries. These programs often have a maternal and child health component (Fiszbein and Schady 2009).
The lack of demand‐side intervention in the health sector may sound surprising in light of the many demand factors that are likely to affect the utilization of health care, including information on health‐care choices and providers; education; household income; indirect costs, such as distance and opportunity costs; and household, cultural, and community pref‐
erences, attitudes, and norms. Indeed, the importance of demand‐side constraints for health services has been demonstrated in a number of studies. Lay and Robilliard (2009), for exam‐
ple, show that the odds of receiving a BCG vaccination16 in a number of sub‐Saharan African (SSA) countries are about 50 percent higher for the children of mothers with primary educa‐
tion than for those of mothers without schooling. This result is obtained in an estimation that
15 In fact, demand‐side factors that could not be sufficiently controlled for may explain a large share of the varia‐
tion.
16 Bacillus Calmette‐Guérin (or Bacille Calmette‐Guérin, BCG) is a vaccine against tuberculosis.
includes a community‐fixed effect; that is, the effect refers to mothers who are likely to face the same (or very similar) supply‐side circumstances. Education is typically found to be an important idiosyncratic determinant of health service use (Lavy et al. 1996; Mwabu et al. 2003;
Sahn et al. 2003).
Another well‐documented constraint at the individual and household level is income and/or wealth. When other factors are controlled for, higher incomes are typically associated with much higher rates of health service use (Mwabu et al. 2003; Lay and Robilliard 2009).
Evidence of the importance of income constraints also comes from the literature that has ex‐
amined the effects of user fees. Mwabu et al. (2003), for example, investigate the role of user fees in Kenya. Their findings suggest that in government health facilities where relatively high fees have long been charged, the demand for medical care is income inelastic. However, they show that at government dispensaries where no fees were previously charged, even a modest increase in fees could lead to a considerable drop in service use. Similarly, Fafchamps and Minten (2007) find the suspension of user fees in Madagascar to be associated with a sig‐
nificant increase in visits to health centers. So do Deininger and Mpuga (2005) for Uganda.
In addition to these universal factors, a number of cultural, religious, and social factors, within both the households and the larger community, are extremely important determinants of health service use. These typically interrelated factors obviously differ across countries, regions, and ethnic and religious groups, making it difficult to distinguish general patterns.17 An important set of these factors is related to the role and status of women, both within the household and in society at large. In this regard—despite the difficulties of generalizing—an almost universal pattern is that women tend to allocate more resources to children’s health and education.18
Both income and “cultural” constraints are addressed simultaneously by CCT pro‐
grams, which provide cash transfers to poor households on the condition of a certain behav‐
ior, typically involving the use of social services. These programs often make use of the aforementioned empirical regularity that women tend to “better” allocate their resources by paying the transfer to a woman in the household. OPORTUNIDADES, for example, a pio‐
neering Mexican program, does this and makes these payments conditional on children’s school enrollment and regular visits to health facilities (Fiszbein and Schady 2009).
As indicated above, evaluations of these programs, most of which have been imple‐
mented in Latin America and the Caribbean (LAC), have produced an extensive body of em‐
pirical evidence on the effects of providing such transfers, not only on health and education outcomes but also on the use of preventive health care. Fiszbein and Schady (2009) provide on overview of nine case studies of such programs in different LAC countries and Turkey.
The results of the studies are mixed. In three of the cases, preventive‐care visits rose consid‐
erably. In Honduras, for example, the share of small children who had been taken to a health
17 A selective review of these studies can be found in Ensor and Cooper (2004).
18 See, for example, Quisumbing and Maluccio (2003).
center in the past month rose from 44 to 64 percent due to participation in the Programa de Asignación Familiar (Morris, Flores et al. 2004). Similar effects were reported for a Colom‐
bian and a Jamaican program, while the remaining programs seem to have had smaller and often insignificant effects on health‐care service use. An analysis of the impact of CCT pro‐
grams on vaccination and immunization rates yields comparable results (Fiszbein and Schady 2009). While some programs seem to be highly successful—in Nicaragua administra‐
tive records indicate that full vaccination coverage increased from 60 to 78 percent—others show little or no improvement. Expressed as a share of per capita consumption in participat‐
ing households, the conditional transfers that trigger these effects range between 7 percent for Chile and 27 percent for Nicaragua (Red de Protección Social); Honduras and Jamaica are at the lower end with approximately 10 percent. However, these results have to be inter‐
preted with care. While they point to the importance of demand‐side factors, an assessment of their precise role would need to look more deeply into the mechanics of each specific pro‐
gram, especially the size of the transfer and the modalities of the conditions. In addition, a number of CCT programs have at least some supply‐side components, in which case the im‐
pact evaluations show the effect of simultaneous supply‐ and demand‐side interventions. We will return to this point later.
While health components are an important part of some CCT programs, most focus on educational achievement. The effects of the programs are clearer with regard to enrollment than for health services. Fiszbein and Schady (2009) conclude that CCT programs have had a significant positive impact on enrollment, an effect that is very large for some countries. The Red de Protección Social in Nicaragua, for example, increased enrollment by 13 percentage points from a baseline enrollment rate of 72 percent for children aged 7‐13. In Ecuador, a conditional transfer of only 10 percent of per capita expenditure resulted in a 10‐percentage‐
point increase in enrollment of children aged 6‐17 from a baseline level of 75 percent. Most remarkably, the Japan Fund for Poverty Reduction increased the enrollment of girls in grades 7‐9 in Cambodia from 65 percent to more than 95 percent with a transfer volume of only 2 to 3 percent of per capita consumption (Filmer and Schady 2008). In light of the heterogeneity of these experiences, Fiszbein and Schady (2009) conclude that the effect of transfer size seems to be highly context specific and dependent on a variety of other factors.19
It is not the case, however, that these evaluation results come as a complete surprise.
Rather, these programs were initiated based on evidence that schooling choices depend on a number of demand‐side factors, particularly household income. Suggestive evidence again comes from some East African countries where the abolishment of school fees led to a mas‐
19 In light of the importance of income, it would be interesting to know whether the first C in CCT, condition‐
ality, really matters. A recent paper by Baird et al. (2009) that evaluates a (partly) conditional cash transfer program targeted at girls and young women in Malawi provides some evidence in this regard. The authors find that the (significant) impacts of the program were, on average, similar for conditional and unconditional payments.