Machine Learning Findings on Geospatial Data of Users from the TrackYourStress mHealth Crowdsensing Platform
R¨udiger Pryss1, Dennis John2, Manfred Reichert1, Burkhard Hoppenstedt1, Lukas Schmid1, Winfried Schlee3, Myra Spiliopoulou4, Johannes Schobel1, Robin Kraft1, Marc Schickler1, Berthold Langguth3, and Thomas Probst5
Abstract— Mobile apps are increasingly utilized to gather data for various healthcare aspects. Furthermore, mobile apps are used to administer interventions (e.g., breathing exercises) to individuals. In this context, mobile crowdsensing constitutes a technology, which is used to gather valuable medical data based on the power of the crowd and the offered computational capabilities of mobile devices. Notably, collecting data with mobile crowdsensing solutions has several advantages compared to traditional assessment methods when gathering data over time. For example, data is gathered with high ecological validity, since smartphones can be unobtrusively used in everyday life.
Existing approaches have shown that based on these advantages new medical insights, for example, for the tinnitus disease, can be revealed. In the work at hand, data of a developed mHealth crowdsensing platform that assesses the stress level and fluctu- ations of the platform users in daily life was investigated. More specifically, data of 1797 daily measurements on GPS and stress- related data in 77 users were analyzed. Using this data source, machine learning algorithms have been applied with the goal to predict stress-related parameters based on the GPS data of the platform users. Results show that predictions become possible that (1) enable meaningful interpretations as well as (2) indicate the directions for further investigations. In essence, the findings revealed first insights into the stress situation of individuals over time in order to improve their quality of life.
Altogether, the work at hand shows that mobile crowdsensing can be valuably utilized in the context of stress on one hand.
On the other, machine learning algorithms are able to utilize geospatial data of stress measurements that was gathered by a crowdsensing platform with the goal to improve the quality of life of its participating crowd users.
Index Terms— mHealth, crowdsensing, stress, geospatial data, machine learning
I. INTRODUCTION
The present life is increasingly characterized by psychoso- cial stress, which is a risk factor for mental and somatic diseases [1]. As a result, interdisciplinary teams try to find technical solutions that may empower patients to better man- age their stress-level over time [2], [3]. Mobile crowdsensing that incorporates Ecological Momentary Assessments (EMA)
1Faculty of Computer Science, Engineering and Psychology, Ulm Uni- versity, Germany
{ruediger.pryss,burkhard.hoppenstedt,lukas.schmid, manfred.reichert,johannes.schobel,
robin.kraft,marc.schickler}@uni-ulm.de
2Lutheran University of Applied Sciences Nuremberg, Germany dennis.john@evhn.de
3University Hospital Regensburg, Germany
winfried.schlee@ieee.org, berthold.langguth@medbo.de 4University of Magdeburg, Germanymyra@ovgu.de
5Department for Psychotherapy and Biopsychosocial Health, Danube University Krems, AustriaThomas.Probst@donau-uni.ac.at
is such a technology. EMA measurements, in turn, are repeatedly performed in daily life to capture the experience of a user in the best natural way to maximize the ecological validity of the gathered data. The concept is well-known in psychological research and has an already considerable history [4], [5]. Following this, mobile crowdsensing has sev- eral advantages compared to traditional assessment methods when gathering data over time.
First, data is gathered with high ecological validity, since smartphones can be unobtrusively used in everyday life.
Second, gathered data can be directly compared to data of other crowd users in a meaningful way. Third, individuals can collect data more easily compared to a traditional collection procedure (e.g., paper and pencil questionnaires). Fourth, the bias of experimenters is mitigated in crowdsensing collection procedures compared to data collection in the lab as experi- menters are not needed.
Technically, several sensing paradigms have been pro- posed to relate crowd users to sensing tasks [6]. Furthermore, it has been shown that sophisticated technical crowdsensing platform must be developed to enable meaningful mea- surements by crowd users [7]. In the context of mobile Health (mHealth) solutions, four technical developments are particularly important for the provision of a crowdsensing platform that incorporates EMA measurements:
1) A proper data model must be conceived [8].
2) A flexible Application Programming Interface, which han- dles data transfers based on the data model, must be imple- mented [8].
3) An architecture must be conceived that enables sophisticated crowdsensing collection procedures [9].
4) Mobile native apps must be implemented that enable (1) an user experience that is welcomed by the crowd users [10], [11] as well as (2) enables reliable sensor measurements.
Along these issues, including the use of results from the implementation of four other crowdsensing platforms [12], the TrackYourStress mHealth crowdsensing platform (TYS) was implemented. The goal of TYS is to improve the quality of life of its users by tracking their stress level and related variables (e.g., stress reactivity, coping skills) over time and providing personalized feedback. The daily tracking procedure of TYS, in turn, comprises specific questions to assess stress perception and stress-related parameters during the daily routine of a user. Additionally, the smart mobile device of a user can record the environmental sound level and the GPS position while the user fills in the assessment questionnaires, if he/she agrees in the app that these addi-
tional variables are recorded. The platform is now running for roughly one year and has already gathered valuable stress- related data of its registered users.
In the work at hand, the TYS data source was evaluated with the goal to get insights on the gathered GPS data and its relation to the collected daily stress values. As machine learning promises to be useful in this context [13], respective algorithms are applied to gathered data of TYS to find new insights. To be more precise, it was investigated whether geospatial data (i.e., the collected GPS positions) of TYS users can be used as a predictor for the individual stress situation of the participating users. The results that have been revealed show their value and that they can be a starting point for several other investigations. Furthermore, the results show that a combination of EMA, mobile crowdsensing, and machine learning is a powerful setting for collecting and evaluating ecological valid stress data of crowd users over time.
The remainder of this paper is organized as follows. In Section II, related work, which is relevant in the context of this paper, will be reviewed. Section III gives the background information on the TrackYourStress platform. The used ma- terials and methods for the data analysis are described in Section IV, while Section V presents the obtained results.
The latter are then discussed in Section V, whereas Section VII concludes the paper with a summary and an outlook.
II. RELATEDWORK
Four categories of related work are relevant in the context of this work. (1) Approaches that deal with mobile crowd- sensing and EMA in the healthcare domain, (2) approaches on stress measurement based on mobile technology in gen- eral, (3) approaches that link GPS data with health aspects, and (4) approaches that apply machine learning algorithms to GPS-based data.
Regarding the first category, some recent works exist that deal with generic crowdsensing approaches to enable human- subject studies [9]. However, the use of crowdsensing in the context of stress and related disorders is still rare. One example for a crowdsensing solution dealing with a chronic disorder that can be influenced by stress is the TrackY- ourTinnitus mHealth crowdsensing platform [14]–[17]. In turn, technical solutions that enable Ecological Momentary Assessments without using mobile crowdsensing technology have been already presented with valuable healthcare results [18], [19].
Regarding the second category, approaches can be found that utilize mobile technology in the context of stress mea- surements. A recent review on smartphone-based self-reports on stress provides an excellent overview [2]. Besides self- reports on stress levels, objective data was collected in some of these studies as well. Thereby, associations between stress- levels and objective data were investigated. For example:
Stress-levels were predicted with accuracies of60%and71%
by accelerometer data in the work shown by [20].
Regarding the third category, GPS data is another category of objective data that was considered and studies found
that stress-levels can be generally predicted by GPS data [21], [22]. Advantages of GPS measurements to study health aspects in general have been highlighted by [23], and a recent review summarizes the studies on smartphone-based passive sensing (including GPS) in the health context [24].
Regarding the fourth category, there exist approaches that consider machine learning algorithms in the context of GPS-based data. One important aspect is to identify the features for the input parameters of the algorithms [25].
Based on valuable features, many works exist that investigate mobility or travel behavior [26], [27]. Other approaches try to figure out anomalies in GPS trajectories [28]. One study, for example, used machine learning to link GPS-data with the behavior of cows [29]. For machine learning in the context of personal sensing and mental health in humans, this review provides a good overview: [30]. Stress predictions in the light of smartphone gathered data are also subject of existing works [31], [32]. However, these approaches do not particularly focus on stress predictions based on GPS-driven data that was gathered by a mHealth crowdsensing platform.
Altogether, the presented approaches show that mobile technology, Ecological Momentary Assessments, mobile crowdsensing, machine learning, and GPS data are a solid basis to address healthcare scenarios, but this discipline is still in its infancy.
III. TRACKYOURSTRESSPLATFORM
TrackYourStress (TYS) is a mHealth crowdsensing plat- form, which is built on four technical components. First, it offers a website for user registration and other user-related features (e.g., account management). Second, it offers an Android and iOS application. Third, a MariaDB database is used as the central repository for the data collected. Fourth, a RESTful API is provided that enables the communication be- tween the mobile applications, the website, and the database [8].
In general, TYS was developed to track the individual stress of its registered users. The tracking is based on a set of questionnaires (registration, daily, weekly, monthly). In addition, the environmental sound level and the GPS position can be measured. Note that the users must allow the sensor measurement when registering to TYS for the first time. This way, we consider the privacy of the users [33]. In general, TYS users accomplish three fundamental phases. First, they have to register through the website or the mobile apps.
Second, they have to fill in a so-called registration ques- tionnaire once. The latter captures the current stress situation, demographic data (e.g., date of birth), and other stress-related parameters. The completion of this registration questionnaire is a fundamental prerequisite for users who want to use the features of the continuous mobile crowdsensing procedure, i.e., the daily, weekly, and monthly measurements. Also, during the second phase, users have to accept or adjust a notification schema. The notification schema determines how often and in what way (i.e., fixed or random points in time) the daily, weekly, and monthly assessment questionnaires are
applied to them. The number of daily assessments, in turn, is restricted to a maximum of 20 times per day.
Third, after the registration questionnaire has been ac- complished and the notification schemas are determined, users can start with the daily, weekly, and monthly stress assessments. For the application of the daily assessment questionnaire, as well as the weekly and monthly ques- tionnaire, notification features for both Android and iOS, as well as a notification algorithm, were realized. After a notification appears, the user may click on it. In the latter case, the mobile application is started (if not already running) and the respective assessment questionnaire (daily, weekly, or monthly) is directly displayed to the user. Then, he or she can fill in the questionnaire, and finally saves the entered data. It is also possible that users can fill in the questionnaires without notifications. While filling in the questionnaire, either with or without using a notification, the GPS position and the environmental sound level are measured (if the app is allowed to measure them). The result is then transferred to the database through the RESTful API if the mobile app is online; otherwise the result is locally stored until the device gets an online connection. A more detailed technical description of the presented features can be found in [8], [17].
IV. MATERIAL ANDMETHODS
This section provides relevant materials and methods, which were the basis for this work. First of all, so far, TrackYourStress (TYS) is only available in German, while an English version is under development. Furthermore, the developed website is the only component that is currently public. The developed mobile apps are only available through private invitations, i.e., distributing the app without using the official App stores. For Android, we distribute APK files to the users, while for iOS, we use Testflight. However, we plan to release the mobile apps within this year to the Google Playstore and the Apple App Store. The users that have been invited and registered are recruited by students of the FOM University of Applied Sciences in Munich and Augsburg, Germany.
At the time of this analysis (January 2019), TrackY- ourStress (TYS) had 119 registered users with 2256 filled out daily assessment questionnaires. For the analysis of the work at hand, we only used the daily assessment questionnaire results. Its 9 questions are shown in Table I. It is noteworthy that we use sliders as visual analogue scales (VAS), cat- egories for Question 5 (C), and self-assessment manikins (SAM; [34]). As the first data preparation step, we filtered out all test users and all users without any GPS measurement.
104 users with 1879 daily measurements (including results to all of the 9 questions and a measured GPS position, which is related to the filled-out questions) remained after this phase.
Furthermore, we analyzed only those users, who had at least
> 10 daily measurements (including the GPS positions).
After that, we had 77 users with 1797 daily measurements and their related GPS positions.
As a next and very important step, we derived geospatial features as the input for the machine learning algorithms.
The identification of such features in general is challenging when applying machine learning algorithms. As for GPS- driven data less works exist that have presented such features [25], especially in the context of the work at hand, the derivation of respective features is a challenging task. In total, we derived 4 geospatial features for our analysis. These features were then used as the predictors of eight selected questions of the daily assessment questionnaire (see Table I). Note that Question 5 (What stresses you at the moment?) is not included in the analysis. Since it is the only question, which has no numeric result values, it was omitted in this analysis, but will be considered in future investigations.
For a better understanding of the used geospatial features, we provide the considerations behind them and then we present them more technically. The major idea is to identify movement patterns of TYS users. Apparently, location clus- ters may indicate striking whereabouts. Therefore, a cluster feature is used to reveal the locations, in which the TYS users are frequently remaining. Such clusters may indicate insights to stress-related parameters while being there. If valuable insights can be found, then they can be possibly predicted and users might be empowered to better cope with the stressful situations. Such clusters denote our first geospatial feature. We derive these clusters based on a threshold for the amount of GPS measurements within a specified location radius.
The remaining three geospatial features are related to movement patterns based on daily habits. The second feature shall capture if TYS users reveal large and different distances between many GPS measurement points. In this case, a TYS user might have less location clusters compared to other TYS users, and, in general, travels a lot. The third feature shall reveal whether TYS users have always a large distance between GPS measurements and, in addition, whether these distances reveal to be in strikingly similar orders of magni- tude. In other words, this feature expresses that TYS users have large movement distances between GPS measurements, but usually with a comparable distance between these GPS measurement points. The last feature was used to detect clusters, which cannot be considered as a normal location cluster. For example, if a user travels to another country and a cluster is identified there, this cluster shall be distinguished to those that have been identified on daily habits.
In the following, the four geospatial features will be technically described: First, we established the so-called location cluster for each user in order to be able to check whether a GPS measurement of this user is within this cluster {0,1}. To create a respective location cluster feature, we applied DBSCAN [35] to the measured GPS positions of a user, with a resolution of 0.1, which denotes 0.1◦ in the haversine distance (i.e., roughly 11.12km). Regarding DBSCAN, this leads to parameter values eps = 0.1 and min samples= 3. That means, a maximal distance of 0.1 to cluster neighbors and minimally 3 nodes are needed to form a cluster. This feature would require extra calculations
if a GPS measurement would be too close to the poles, but in our case, this cannot be happen. Following this, we receive a feature with a binary decision whether a GPS measurement is located within the cluster or not. The location cluster shall reflect a region, in which users often stay to detect outliers.
Second, a feature denoted with absolute distance was derived. For this feature, for each GPS measurement of a user, the sum of all distances to all other GPS measurements is calculated. This value is then divided through the amount of all GPS measurements of a user. This feature shall reflect large distances between all measured GPS positions of a user. If this value is thus high, the GPS measurements among each other reveal large distances, meaning that the user has less location clusters. More precisely, for a GPS measurement pi of a user with its latitude and longitude (xi, yi), this feature di is calculated as follows:
di:=
n
P
j=1
||pi−pj||2
n−1 =
n
P
j=1
√
(xi−xj)2+(yi−yj)2 n−1
Third, a feature denoted with relative distance was derived. Here, again, for each GPS measurement of a user, the sum of all distances to all other GPS measurements is calculated. Opposed to the latter feature, here, the calculated value is divided through the value with the largest distance.
This shall reflect the situation that a GPS measurement is at the boundaries of a users’ movement radius (i.e., the relative distance is high). More precisely, for a GPS measurement pi of a user with its latitude and longitude (xi, yi), this feature ri usesdi and is calculated as follows:
ri:= maxdi
i
di.
Fourth, a feature denoted with distance to central point was derived. For this feature, the central point of a user is calculated through the mean value of all GPS positions.
After that, for each GPS measurement, its distance to the central point is considered. This feature shall reflect outliers in the following sense: You do a business trip to another country, which is also identified as a location cluster, but the latter constitutes not a daily location cluster of the user.
Such alien clusters can then be considered as an outlier location cluster. More precisely, for a GPS measurement pi of a user with its latitude and longitude(xi, yi), this feature ci is calculated as follows:
ci :=||pi−c||2= q
(xi−c1)2+ (yi−c2)2,
whereby c = (c1, c2) denotes the central point of the respective user.
Using machine learning algorithms, these four features were investigated as predictors for the answers of 8 TYS questions of the daily assessment questionnaire. Then, with respect to the amount of data and a better insight into the data set, the value ranges of the 8 TYS questions were divided into 4 equally distributed quartiles, i.e., very low(0−25%)
Question Scale
1
How high is your momentary stress-level? VAS 2 How well can you control your momentary stress-level? VAS
3
How strongly are you experiencing your momentary stress-level as negative/impairing?
VAS 4
How strongly are you experiencing your momentary stress-level as positive/beneficial?
VAS 5
What stresses you at the moment? C
6 How is your mood right now? SAM
7
How is your arousal right now? SAM
8
How important is the current situation for you person- ally?
VAS 9
How would you assess your ability to cope with the currently experienced situation?
VAS
VAS=Visual Analogue Scale, C=Categories SAM=Self-Assessment Manikins
TABLE I: TrackYourStress Daily Assessment Questions
(Quartile 0), low(25−50%)(Quartile 1), higher(50−75%) (Quartile 2), and very high (75−100%)(Quartile 3). Note that very low means the lowest stress level, while the others mean an increased stress level up to very high. Thus, we predict for each of the 8 TYS questions these 4 quartiles, resulting in(8x4 = 32)prediction values.
For the quartiles, in turn, the respective predictions are based on the given assessments, while the user is reflected through the 4 geospatial input features. Following this set- ting, we can better compare different stress-levels and their obtained prediction accuracies within one question. After creating the features and the 4 quartiles for each TYS question, we used the input for a Decision Tree (DT) and a Support Vector Machine (SVM). For both methods, the distribution between training and validation set was defined as follows: For each of the four quartiles of each question, 100 random values were used for testing, while the rest of the values was used for the validation. The two machine learning algorithms have been chosen as they particularly address high-dimensional datasets, which is the case for the given dataset on TYS. Further note that the prediction models have been validated based on a 10-fold cross-validation approach.
Finally note, by the best of our knowledge, no other works could be found that have presented respective features in the context of stress predictions. Our feature set was mainly derived through interdisciplinary discussions with psychol- ogists, medical experts, and computer scientists. However, they are only a first step, and therefore be used as the basis for further investigations.
V. RESULTS
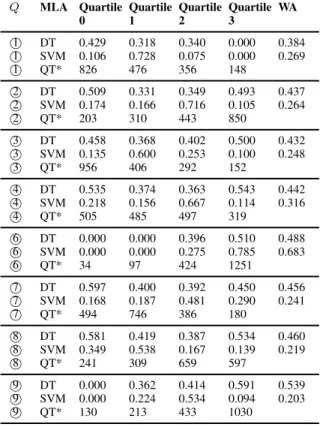
Of the 77 participants, 46 (59.7%) were female. On average, the participants wereM = 33.95years old (SD= 11.99). Table II shows the prediction accuracies for the quartiles of each of the 8 analyzed daily TYS questions.
Furthermore, Table II shows in the row denoted with QT*, how many GPS measurements could be evaluated in each quartile. We exemplarily describe the meaning of one se- lected accuracy results for a better understanding. Consider therefore the value of Quartile 1 and Question 1 computed
by the SVM. The achieved accuracy of 72.8% means that if a user has given an answer to Question 1 that would put him or her in the stress level Quartile 1, then we are able to predict this quartile with an accuracy of 72.8%, just based on his or her given geospatial data. The results of Question 1 for the SVM are also shown in Fig. 1
Overall, it can be seen that there is a large variance in the prediction accuracies among the four quartiles, as well as the two machine learning algorithms. We discuss only three selected and important results in the following. Although the overall prediction accuracies are not high (highest achieved accuracy is78.5%for the Question6-Quartile3 combination;
using the SVM), valuable indicators can be nevertheless obtained: (1) Some questions, for example, Questions 8 (How important is the current situation for you personally?), have revealed a higher accuracy when using the DT over all four quartiles than other questions (e.g., when comparing it to Question 1).
This indicates that some questions seem to be more accurately predicted based on the movement behavior of TYS users. (2) As can be also obtained, some quartiles have an accuracy of 0%. This can have several reasons: First, the gathered GPS data was not enough for a prediction or, second, the users have not provided GPS data that is valuable with respect to the used feature set. Another explanation is that the GPS data does not correlate with the stress parameters in these quartiles. However, when having a look at the row denoted with QT*, it is striking that prediction accuracies of 0% are accompanied by less GPS measurements. Therefore, the first explanation seems to be most likely. (3) Finally, for this study, it can be observed that the DT outperformed the SVM. Hence, further investigations must be accomplished to compare the suitability of the different algorithms. Note that in other works, also a DT has outperformed other approaches on GPS-based data [25].
Whether the reasons of our work and [25] can be compared, must be further on investigated. It can be possibly assumed that if GPS trajectories, for example, like presented in [25], show sudden transport changes (e.g., when changing from walking to driving), a DT copes better with such changes.
VI. DISCUSSION
In general, the results indicate that using movement behav- ior to predict stress parameters of the TYS users based on machine learning is promising. Yet, this study has several limitations, as explained below. First, the TYS data set is rather small, and the training sample is even smaller. While the choice of a small sample for training decreases the likelihood of overfitting, it also decreases accuracy. Other forms of sampling could be considered in the future. Second, the TYS mobile apps are not officially released to the App Stores. Following this, the invited TYS users might pose characteristics that bias the generalizability of the presented results. This includes the distribution of the sample data across the quartiles. Third, stress-levels have been designed manually and the features are also handcrafted. So, the relation between features and stress-level is not semantically
Q MLA Quartile 0
Quartile 1
Quartile 2
Quartile 3
WA
1 DT 0.429 0.318 0.340 0.000 0.384
1
SVM 0.106 0.728 0.075 0.000 0.269
1 QT* 826 476 356 148
2 DT 0.509 0.331 0.349 0.493 0.437
2
SVM 0.174 0.166 0.716 0.105 0.264
2 QT* 203 310 443 850
3 DT 0.458 0.368 0.402 0.500 0.432
3
SVM 0.135 0.600 0.253 0.100 0.248
3 QT* 956 406 292 152
4 DT 0.535 0.374 0.363 0.543 0.442
4
SVM 0.218 0.156 0.667 0.114 0.316
4
QT* 505 485 497 319
6 DT 0.000 0.000 0.396 0.510 0.488
6 SVM 0.000 0.000 0.275 0.785 0.683
6
QT* 34 97 424 1251
7
DT 0.597 0.400 0.392 0.450 0.456
7 SVM 0.168 0.187 0.481 0.290 0.241
7
QT* 494 746 386 180
8
DT 0.581 0.419 0.387 0.534 0.460
8 SVM 0.349 0.538 0.167 0.139 0.219
8
QT* 241 309 659 597
9
DT 0.000 0.362 0.414 0.591 0.539
9 SVM 0.000 0.224 0.534 0.094 0.203
9
QT* 130 213 433 1030
Q=Question, WA = Weighted Average MLA = Machine Learning Algorithm DT = Decision Tree, SVM = Support Vector Machine
QT* = Quantity, denoting the number of evaluated GPS measurements for this quartile
TABLE II: Prediction Results
0,106
0,728
0,075 0 0
0,1 0,2 0,3 0,4 0,5 0,6 0,7 0,8
0 1 2 3
Correctly Classified
Quartiles
SVM: training set = 400, validation set = 1431, folds = 10
Fig. 1: SVM Results for Question 1
grounded. Nonetheless, we belied that the results do not justify further investigations on the associations between geospatial and stress data that were gathered by a mHealth crowdsensing platform. In particular, it should be investi- gated next whether the differences in the obtained accuracies among the quartiles are due to differences in the population distribution, or that they can be explained differently. A further step would be also to monitor stress-levels through
sensors (e.g., through the performance of mobile cortisol assessments) rather than resorting to hand-crafted stress- levels. Finally, differences between iOS and Android users in the light of associations between geospatial and stress data seem also to be worth of being investigated.
VII. SUMMARY ANDOUTLOOK
This work has presented the TrackYourStress mHealth crowdsensing platform (TYS). It was developed to assess the stress levels and fluctuations of its users in daily life.
The goal of the platform is to learn more about stress and related factors. We have also shown that mobile crowdsens- ing combined with Ecological Momentary Assessments is less considered for stress in particular and health questions in general. As a particular question for TYS, we investigated in the work at hand whether geospatial data (i.e., GPS measurements) can predict stress-related data using machine learning algorithms. Although the presented setting has nu- merous limitations, the results have shown three valuable insights. First, mobile crowdsensing and Ecological Momen- tary Assessments are valuable instruments in the context of stress assessment. Second, geospatial data allows for the prediction of stress parameters with an accuracy that paves the way for further investigations. Third, machine learning algorithms seem to be worth being applied to EMA-driven mobile crowdsensing data in the context of stress.
REFERENCES
[1] S. Cohenet al., “Psychological stress and disease,”Jama, vol. 298, no. 14, pp. 1685–1687, 2007.
[2] H. ´orarinsd´ottir et al., “Smartphone-based self-assessment of stress in healthy adult individuals: a systematic review,”Journal of medical Internet research, vol. 19, no. 2, 2017.
[3] D. Mart´ın et al., “Managing and controlling stress using mhealth:
Systematic search in app stores,”JMIR mHealth and uHealth, vol. 6, no. 5, 2018.
[4] A. Stone, J. Schwartz, J. Neale, S. Shiffman, C. Marco, M. Hickcox, J. Paty, L. Porter, and L. Cruise, “A comparison of coping assessed by ecological momentary assessment and retrospective recall.”Journal of personality and social psychology, vol. 74, no. 6, p. 1670, 1998.
[5] S. Shiffman, A. Stone, and M. Hufford, “Ecological Momentary Assessment,”Annu. Rev. Clin. Psychol., vol. 4, pp. 1–32, 2008.
[6] H. Maet al., “Opportunities in mobile crowd sensing,”IEEE Com- munications Magazine, vol. 52, no. 8, pp. 29–35, 2014.
[7] R. Kraft et al., “Design and Implementation of a Scalable Crowd- sensing Platform for Geospatial Data of Tinnitus Patients,” in 32th IEEE Int’l Symposium on Computer-Based Medical Systems. IEEE Computer Society Press, 2019.
[8] R. Prysset al., “Requirements for a flexible and generic api enabling mobile crowdsensing mhealth applications,” in 4th Int’l WS on Re- quirements Engineering for Self-Adaptive, Collaborative, and Cyber Physical Systems. IEEE, 2018, pp. 24–31.
[9] H. Xiong et al., “Sensus: a cross-platform, general-purpose system for mobile crowdsensing in human-subject studies,” in Proc of the Int’l Conf on Pervasive and Ubiquitous Computing. ACM, 2016, pp.
415–426.
[10] K. Agrawal et al., “Towards incentive management mechanisms in the context of crowdsensing technologies based on trackyourtinnitus insights,”Procedia computer science, vol. 134, pp. 145–152, 2018.
[11] F. Beierleet al., “What data are smartphone users willing to share with researchers?” Journal of Ambient Intelligence and Humanized Computing, pp. 1–13, 2019.
[12] R. Prysset al., “Differences between android and ios users of the trackyourtinnitus mobile crowdsensing mhealth platform,” in 31st International Symp on Computer-Based Medical Systems. IEEE, 2018, pp. 411–416.
[13] M. L. P. et al., “Finding tinnitus patients with similar evolution of their ecological momentary assessments,” inIEEE 31st Int’l Symp on Computer-Based Medical Systems, 2018, pp. 112–117.
[14] T. Probst et al., “Emotional States as Mediators between Tinnitus Loudness and Tinnitus Distress in Daily Life: Results from the
“TrackYourTinnitus” application,”Scientific Reports, vol. 6, 2016.
[15] T. Probst, R. Pryss, B. Langguth, and W. Schlee, “Emotion dynamics and tinnitus: Daily life data from the “trackyourtinnitus” application,”
Scientific reports, vol. 6, 2016.
[16] W. Schlee et al., “Measuring the moment-to-moment variability of tinnitus: the trackyourtinnitus smart phone app,” Frontiers in Aging Neuroscience, vol. 8, 2016.
[17] R. Prysset al., “Prospective crowdsensing versus retrospective ratings of tinnitus variability and tinnitus–stress associations based on the trackyourtinnitus mobile platform,” International Journal of Data Science and Analytics, pp. 1–12, 2018.
[18] U. Ebner-Priemer and T. Kubiak, “Psychological and psychophysio- logical ambulatory monitoring,” European Journal of Psychological Assessment, vol. 23, no. 4, pp. 214–226, 2007.
[19] D. De Beurset al., “The role of mobile phone technology in under- standing and preventing suicidal behavior,” 2015.
[20] E. Garcia-Cejaet al., “Automatic stress detection in working environ- ments from smartphones’ accelerometer data: A first step.”IEEE J.
Biomedical and Health Informatics, vol. 20, no. 4, pp. 1053–1060, 2016.
[21] S. Vhaduri et al., “Estimating Drivers’ Stress from GPS Traces,”
in Proc of the 6th Int’l Conf on Automotive User Interfaces and Interactive Vehicular Applications. ACM, 2014, pp. 1–8.
[22] D. Ben-Zeevet al., “Next-generation psychiatric assessment: Using smartphone sensors to monitor behavior and mental health.”Psychi- atric rehabilitation journal, vol. 38, no. 3, p. 218, 2015.
[23] J. Kerret al., “Using global positioning systems in health research:
a practical approach to data collection and processing,” American journal of preventive medicine, vol. 41, no. 5, pp. 532–540, 2011.
[24] V. Cornet and R. Holden, “Systematic review of smartphone-based passive sensing for health and wellbeing,” Journal of biomedical informatics, vol. 77, pp. 120–132, 2018.
[25] Y. Zhenget al., “Understanding mobility based on gps data,” inProc of the 10th Int’l Conf on Ubiquitous Computing. ACM, 2008, pp.
312–321.
[26] K. Elliset al., “Identifying active travel behaviors in challenging envi- ronments using gps, accelerometers, and machine learning algorithms,”
Frontiers in public health, vol. 2, p. 36, 2014.
[27] A. Jahangiri and H. Rakha, “Applying machine learning techniques to transportation mode recognition using mobile phone sensor data,”
IEEE transactions on intelligent transportation systems, vol. 16, no. 5, pp. 2406–2417, 2015.
[28] Z. Liao et al., “Anomaly detection in gps data based on visual analytics,” inSymposium on Visual Analytics Science and Technology.
IEEE, 2010, pp. 51–58.
[29] M. Williamset al., “A novel behavioral model of the pasture-based dairy cow from gps data using data mining and machine learning techniques,”Journal of dairy science, vol. 99, no. 3, pp. 2063–2075, 2016.
[30] D. Mohret al., “Personal sensing: understanding mental health using ubiquitous sensors and machine learning,”Annual review of clinical psychology, vol. 13, pp. 23–47, 2017.
[31] M. Gjoreskiet al., “Automatic detection of perceived stress in campus students using smartphones,” inInt’l Conf on Intelligent Environments.
IEEE, 2015, pp. 132–135.
[32] H. Sarkeret al., “Finding significant stress episodes in a discontinuous time series of rapidly varying mobile sensor data,” inProc of the Conf on Human Factors in Computing Systems. ACM, 2016, pp. 4489–
4501.
[33] F. Beierleet al., “Context data categories and privacy model for mobile data collection apps,”Procedia computer science, vol. 134, pp. 18–25, 2018.
[34] M. Bradley and P. Lang, “Measuring Emotion: The Self-Assessment Manikin and the Semantic Differential,”Journal of Behavior Therapy and Experimental Psychiatry, vol. 25, no. 1, pp. 49–59, 1994.
[35] M. Esteret al., “A density-based algorithm for discovering clusters a density-based algorithm for discovering clusters in large spatial databases with noise,” inProc of the Second Int’l Conf on Knowledge Discovery and Data Mining, ser. KDD’96. AAAI Press, 1996, pp.
226–231.