Proceedings of the International Ocean Discovery Program Volume 357 publications.iodp.org
doi:10.14379/iodp.proc.357.102.2017
Expedition 357 methods
1G.L. Früh-Green, B.N. Orcutt, S.L. Green, C. Cotterill, S. Morgan, N. Akizawa, G. Bayrakci, J.-H. Behrmann, C. Boschi, W.J. Brazelton, M. Cannat, K.G. Dunkel, J. Escartin, M. Harris, E. Herrero-Bervera, K. Hesse, B.E. John, S.Q. Lang, M.D. Lilley, H.-Q. Liu, L.E. Mayhew, A.M. McCaig, B. Menez, Y. Morono, M. Quéméneur, S. Rouméjon, A. Sandaruwan Ratnayake, M.O. Schrenk, E.M. Schwarzenbach, K.I. Twing, D. Weis, S.A. Whattam, M. Williams, and R. Zhao2
Keywords: International Ocean Discovery Program, IODP, RRS James Cook, Expedition 357, Site M0068, Site M0069, Site M0070, Site M0071, Site M0072, Site M0073, Site M0074, Site M0075, Site M0076, seabed drills, RD2, MeBo, Atlantis Massif, Atlantis Fracture Zone, Mid- Atlantic Ridge, Lost City hydrothermal field, serpentinization, detachment faulting, oceanic core complex, hydrogen, methane, deep biosphere, carbon cycling, carbon sequestration, contamination tracer testing
1Früh-Green, G.L., Orcutt, B.N., Green, S.L., Cotterill, C., Morgan, S., Akizawa, N., Bayrakci, G., Behrmann, J.-H., Boschi, C., Brazelton, W.J., Cannat, M., Dunkel, K.G., Escartin, J., Harris, M., Herrero-Bervera, E., Hesse, K., John, B.E., Lang, S.Q., Lilley, M.D., Liu, H.-Q., Mayhew, L.E., McCaig, A.M., Menez, B., Morono, Y., Quéméneur, M., Rouméjon, S., Sandaruwan Ratnayake, A., Schrenk, M.O., Schwarzenbach, E.M., Twing, K.I., Weis, D., Whattam, S.A., Williams, M., and Zhao, R., 2017. Expedition 357 methods. In Früh-Green, G.L., Orcutt, B.N., Green, S.L., Cotter- ill, C., and the Expedition 357 Scientists, Atlantis Massif Serpentinization and Life. Proceedings of the International Ocean Discovery Program, 357: College Station, TX (International Ocean Discovery Program). http://dx.doi.org/10.14379/iodp.proc.357.102.2017
2Expedition 357 Scientists’ addresses.
Contents
1 Introduction 8 Core description 20 Geochemistry
22 Fluid inorganic chemistry analyses 23 Microbiology
28 Water sampling and sensor package data
33 Borehole plugs 34 Physical properties 39 Downhole logging 41 Paleomagnetism 42 References
Introduction
This chapter documents the primary procedures and methods employed by the operational and scientific groups during the off- shore and onshore phases of International Ocean Discovery Pro- gram (IODP) Expedition 357. This information concerns only shipboard and Onshore Science Party (OSP) methods described in the site chapters. Methods for postexpedition research conducted on Expedition 357 samples and data will be described in individual scientific contributions. Detailed drilling and engineering opera- tions are described in the Operations section of each site chapter.
Site locations
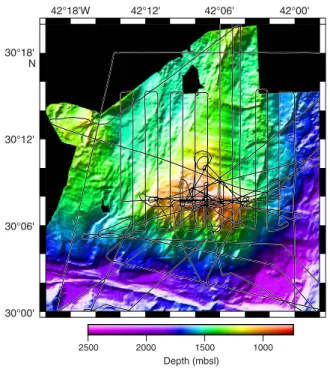
For all sites, coordinates supplied by the proponents from previ- ous site surveys were used as a guide for positioning at the proposed coring locations (Figure F1). Coordinates were supplied to the bridge via daily operations plans and were used to center the dy- namic positioning (DP) system over the specific drill operating at each site (i.e., the Meeresboden-Bohrgerät 70 [MeBo] drill at the stern of the vessel and the British Geological Survey (BGS) Rock- Drill2 [RD2] drill over the aft port side). In order to maintain station accuracy, the DP system ran for ≈15–20 min at each site to build a reliable DP model prior to operations. An ultra-short baseline bea- con was attached to each drill, communicating with a transceiver on a pole that was lowered from the starboard side to ≈3.5 m water depth, giving an accurate hole position and water depth. Coordi- nates in this report refer to the beacon positions on the drills rather than the position of the vessel. Table T1 summarizes the distances between Expedition 357 holes and sites.
Multibeam site surveys undertaken during the expedition Prior to coring operations, a multibeam echo sounder survey was conducted to accurately place the break of slope against two preexisting bathymetric data sets and the site locations. Multibeam Figure F1. Expedition 357 drill sites overlain onto multibeam bathymetry acquired during the expedition (50 m resolution). Expedition 304/305 sites are shown for context.
M0076 (AM-11)
30°06' 30°08' 30°10' 30°12'
M0074 (AM-09)
M0070 (AM-07)
M0075 (AM-03) M0073
(AM-05) M0071
(AM-04) M0068
(AM-02) M0069 (AM-06) M0072
(AM-01)
2500 2000 1500 1000
Depth (mbsl)
42°10' 42°08' 42°06' 42°04'
42°12'W N
U1309A−E U1309F
U1309G−H
U1310 U1311 MeBo
RD2
Expedition 304/305 Expedition 357
2 km AM-08
AM-10 Planned
Lost City
surveys were also conducted during down time and periods of bad weather when drilling operations could not be performed. The RRS James Cook operates a hull-mounted Kongsberg Simrad EM120 deep-sea multibeam echo sounder with an operating frequency of 12 kHz and 191 beams. To improve resolution and analysis of slope angles at each drill site, the beam angle on the EM120 was de- creased to 45° from the normal 60°. EQANGLE (equal angle) beam spacing was used to improve the resolution in the central swath area, and min/max depth settings were varied in an attempt to re- duce the impact of outliers. In marginal weather conditions, sea- floor detection was forced to only resolve below a certain depth (force depth) to assist with bottom detection. The combination of the above parameters gave a swath width approximately twice the water depth.
The sound velocity profile used was taken on 5 November 2015 and logged using the MIDAS sound velocity profiler (SVP) to 1009 m water depth. The sound speed transducer was set to “profile” for most of the multibeam survey. However, on 20 November, the transducer was set to “sensor” to utilize the surface sound velocities in marginal weather conditions. Heading, attitude, and positioning information were provided by the Seatex Seapath 200 positioning sensor. Sensor locations and offsets were all verified against the ves- sel’s 2014 Blom Survey Report.
The survey lines allowed between 50% and 100% overlap with a survey speed of 5–6 kt. The combination of beam focusing, survey speed, and overlap percentages meant that a 50 m resolution surface could be generated within Caris HIPS and SIPS hydrographic sur- vey software (version 9.1) to assess each location for slope prior to landing each rock drill. This procedure was later supplemented by further multibeam surveys over Atlantis Massif, the Atlantis Frac- ture Zone, the Mid-Atlantic Ridge, and some of the conjugate mar- gin when all coring operations were suspended due to sea state. The swath settings used were the same as for the initial site surveys, with the vessel running at a speed between 5 and 6 kt with variable line spacing dependent on depth. The surveys were run by either the vessel’s system support technician or the Expedition Project Man- ager, depending on shift patterns. Initially, raw data were provided for use by the science party along with 50 m resolution geotiff meta- data, with preliminary data cleaning undertaken by the vessel’s sys- tem support technician. More detailed data cleaning was later undertaken by a marine geophysicist from the BGS at the request of
the science party, removing anomalous data and outliers. This was done in Caris, generating fully cleaned 50 m and 20 m resolution per pixel surfaces and associated data sets:
•Cleaned x, y, z file,
•Fledermaus generated .sd file,
•Geotiff image, and
•ArcGrid ASCII file.
Because prior bathymetry of Atlantis Massif was acquired with a resolution of >100 m per pixel, the new survey provides a much more detailed view of the tectonic, volcanic, and mass-wasting structures of the area (Figures F2, F3).
Operational equipment
Drilling platform
The maximum required depth of the boreholes was 70 meters below seafloor (mbsf ), and water depth ranged between 720 and 1770 m. Because of the scientific need to acquire good quality cores of the surface carbonate cap and hard rocks at depth and the poten- tial to plug the boreholes to enable future observation, it was de- cided to utilize seabed drill technology. Therefore, a multirole oceanographic vessel and two seabed drills were selected to carry out Expedition 357 coring. The RRS James Cook, an 89.2 m long re- search vessel with DP capability (Figure F4), was donated as an “in- kind” contribution from the UK’s Natural Environment Research Council (NERC). The RRS James Cook has sufficient capacity by way of food and accommodation for 24 h operations for up to 50 days.
Seabed drills
Two seabed drill systems were utilized during Expedition 357:
the BGS RD2 (Figure F5) and the Center for Marine Environmental Sciences (MARUM; Bremen, Germany) MeBo70 (Figure F6). Both drills are remotely operated systems that are lowered onto the sea- bed, with power and control maintained from the surface via an umbilical cable. The systems use multiple drill rods and core barrels to progressively penetrate into the seabed. They are both based on an HQ size coring system (rod outer diameter [OD] = 88.9 mm; rod inner diameter = 77.8 mm; reaming shell diameter = 97.8 mm) and produce 61.1 mm diameter cores collected in steel core barrels. The core diameter is similar to standard IODP cores, whereas the hole Table T1. Distances (in kilometers) between holes, Expedition 357. Download table in .csv format.
Hole M0068A
Hole M0068B
Hole M0069A
Hole M0070A
Hole M0070B
Hole M0070C
Hole M0071A
Hole M0071B
Hole M0071C
Hole M0072A
Hole M0072B
Hole M0073A
Hole M0074A
Hole M0075A
Hole M0075B
Hole M0076A
Hole M0076B
Hole M0068A X 0.03 2.48 4.38 4.34 4.39 5.55 5.54 5.564 2.59 2.62 8.41 5.07 2.94 2.86 2.15 2.13
Hole M0068B — X 2.47 4.37 4.32 4.37 5.55 5.53 5.56 2.58 2.61 8.40 5.04 2.94 2.86 2.14 2.12
Hole M0069A — — X 1.94 1.89 1.94 3.23 3.21 3.24 0.34 0.35 6.04 3.57 5.28 5.21 0.63 0.64
Hole M0070A — — — X 0.05 0.02 2.25 2.23 2.27 1.98 1.96 4.62 2.81 7.03 6.96 2.48 2.49
Hole M0070B — — — — X 0.05 2.26 2.24 2.28 1.93 1.91 4.65 2.81 6.98 6.92 2.43 2.45
Hole M0070C — — — — — X 2.24 2.21 2.25 1.97 1.95 4.61 2.82 7.03 6.97 2.48 2.49
Hole M0071A — — — — — — X 0.02 0.02 3.01 2.98 2.86 5.01 8.46 8.38 3.41 3.42
Hole M0071B — — — — — — — X 0.04 2.99 2.97 2.88 4.99 8.44 8.36 3.39 3.41
Hole M0071C — — — — — — — — X 3.02 3.00 2.85 5.03 8.47 8.39 3.42 3.44
Hole M0072A — — — — — — — — — X 0.03 5.85 3.84 5.45 5.38 0.50 0.52
Hole M0072B — — — — — — — — — — X 5.82 3.84 5.48 5.41 0.53 0.54
Hole M0073A — — — — — — — — — — — X 6.90 11.30 11.23 6.26 6.28
Hole M0074A — — — — — — — — — — — — X 6.78 6.75 4.17 4.18
Hole M0075A — — — — — — — — — — — — — X 0.09 5.055 5.04
Hole M0075B — — — — — — — — — — — — — — X 4.98 4.96
Hole M0076A — — — — — — — — — — — — — — — X 0.02
Hole M0076B — — — — — — — — — — — — — — — — X
diameter, 98 mm (RD2) or 103 mm (MeBo), is narrower. By sitting on the seabed, the drills do not require heave compensation and consequently have good control on bit weight. These circumstances are analogous to land-based mine coring, where a thin-walled paral- lel drill string with a core barrel and liner is locked into an outer bottom-hole assembly (BHA) barrel. Each system has the capacity to operate with either a clear polycarbonate liner or stainless steel split liners.
The RD2 is a lightweight system (5 ton in water). It is a remotely operated multibarrel wireline drill capable of coring up to 55 mbsf (Figure F5). Drill rods, core barrels, wireline logging tools (see Downhole logging), and borehole plug units (see Borehole plugs) are stored in tool racks. The maximum length that can be cored by each barrel is 1.72 m. The RD2 is self-contained with its own Launch and Recovery System (LARS) and dedicated winch, occupy- ing a basic deck footprint of 5 m × 10 m. The system additionally includes four 20 ft containers (control, mechanical and electrical Figure F2. Multibeam data acquired over Atlantis Massif overlain with the
vessel’s navigation track plot, Expedition 357.
30°00' 30°06' 30°12' 30°18' N
2500 2000 1500 1000
Depth (mbsl)
42°18'W 42°12' 42°06' 42°00'
Figure F3. 3-D views of the multibeam data set gridded at 50 m resolution, Expedition 357.
Rift valley Nodal
basin Transf
orm fault View to W
View to N
View to N
Rift v alle
y Nodal
basin
Rift valley
-1000 -2000 -3000 -4000
Figure F4. The RRS James Cook, the drilling platform for Expedition 357 pro- vided by NERC as an in-kind contribution. Image courtesy of National Oceanographic Centre, Southampton (NOCS).
Figure F5. The BGS RD2 seabed drill deployed by its own LARS over the star- board side of the RRS James Cook, Expedition 357. Image courtesy of Dave Smith.
LARS
RD2
RD2 support containers
workshops, and spares). Launch and recovery is controlled wire- lessly by one person. The RD2 has a maximum operating water depth of 4000 m. Sensors on the drill enable the operator to monitor pitch and roll of the system and to inform adjustment of the extend- able legs to achieve the requisite vertical position of the drill for op- erations. The top drive provides a maximum 405 rpm.
The MeBo (Figure F6) is a portable drill rig lowered to the sea- bed on a steel armored umbilical cable, allowing it to be remotely operated from a control cabin on the vessel. It weighs 7.5 tons (in water) and is capable of working in water depths up to 2000 m. The drill has two rotating magazines that hold the drill rods, core bar- rels, wireline logging tools, and borehole plug units and can core to a maximum depth of 70 mbsf. It has four plate-like feet that can be individually adjusted to maintain the vertical position required for coring operations. Sensors, video cameras, and lights are used to monitor performance while on the seabed. The maximum length each core barrel can core is 2.5 m. The top drive provides a maxi- mum of 200 rpm. The complete MeBo LARS is mounted on a bed plate tailored to the vessel. During Expedition 357, the LARS re- quired the use of the RSS James Cook’s “A” frame (with a minimum capacity of 20 tons). Accompanying this are four 20 ft containers (winch, control, workshop, and spares).
Coring methodology
To ensure flexibility during operations, a number of different drill bits were available for coring. The diamond cutting bit is on the outer BHA barrel, with an OD of 103 mm for the MeBo drill and 98 mm for the RD2 drill. Both drills maximized flexibility during drill- ing operations by deploying the drills with 2–4 BHAs, often with different bits installed, on each dive. The MeBo drill utilized 20/30 surface-set (Geogem) and G4 impregnated (DATC) bits. The RD2 drill utilized 30/40 surface-set (Geogem), 60/80 surface-set (Rock-
max), and G7 and G10 impregnated (Rockmax) bits. Seawater was the drilling fluid utilized in all holes, with no addition of muds.
Because rig floor and seafloor are effectively the same when us- ing seabed drill technology, many of the IODP depth conventions are not appropriate (IODP Depth Scales Terminology at http://www.iodp.org/policies-and-guidelines). All depths are therefore reported as meters below seafloor.
Additional developments
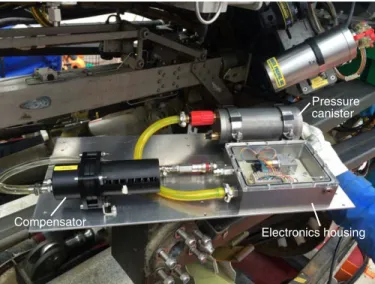
The scientific drivers for IODP Expedition 357 required the de- velopment of several bespoke pieces of equipment designed or modified to be operated remotely from the seabed drills (Früh- Green et al., 2015):
•A water sensor/sampling package mounted on both seabed drills for monitoring in situ parameters and collecting water flushing out of the borehole (details available in Water sam- pling and sensor package data),
•A tracer injection system mounted on both seabed drills to in- ject perfluoromethylcyclohexane (PFC) into the drilling fluids to assess potential contamination of core materials (details avail- able in Microbiology),
•Borehole plugs for sealing off drilled boreholes to prevent fluid circulation and enable future fluid sampling access (details avail- able in Borehole plugs), and
• Wireline logging tools (details available in Downhole logging).
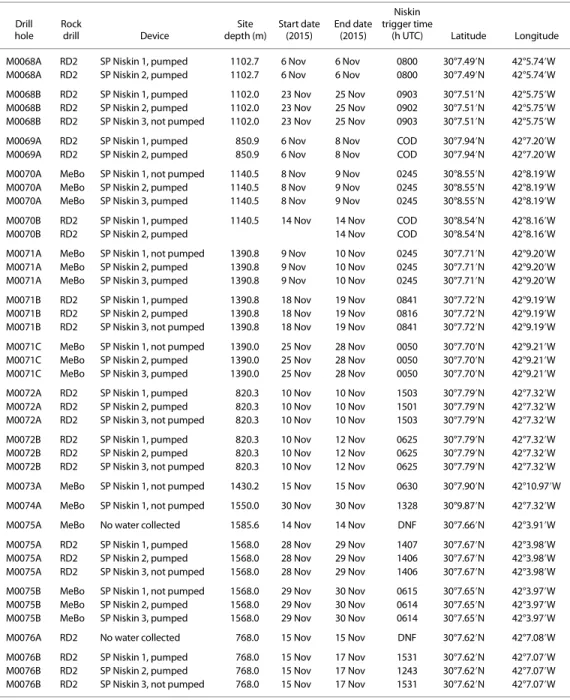
Water column operations
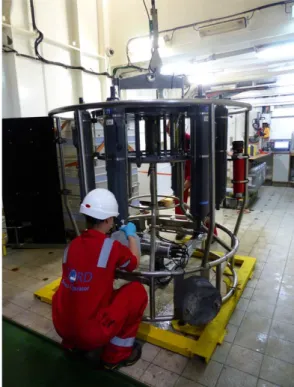
Before commencing drilling operations at each site, a cast of the ship’s conductivity, temperature, and depth (CTD) Niskin rosette system was undertaken to capture a water column profile prior to coring and any associated disturbance (Figure F7). With bottom wa- ter a priority, three Niskin bottles were fired at the bottom of the cast, and one was fired near the surface (see Water sampling and Figure F6. The MARUM MeBo70 seabed drill deployed from the stern of the
RRS James Cook, utilizing the vessel’s A-frame, Expedition 357. Image cour- tesy of Dave Smith.
MeBo A-Frame
Figure F7. CTD rosette, RRS James Cook, Expedition 357. Image courtesy of Carol Cotterill.
sensor package data). The other three Niskin bottles were fired at equal spacing in the water column. The CTD used on the RRS James Cook incorporated the following:
•10 Niskin bottles (6 were used),
•Chelsea Technologies Group (CTG) AquaTracka MkIII fluoro- meter,
•CTG AquaTracka MkII transmissometer,
•Sea-Bird Electronics (SBE) 43 dissolved oxygen sensor,
•Benthos 916T altimeter,
•SBE 3P primary and secondary temperature sensor,
•SBE 4C primary and secondary conductivity sensor,
•Digiquartz pressure sensor, and
•WETLabs BBRTD light scattering sensor.
In addition to the site-related CTD casts, a deeper cast was con- ducted in the Atlantis Fracture Zone to 4135 m water depth, and another was conducted in the Mid-Atlantic Ridge to 4221 m water depth. The purpose of these casts was to provide baseline geochem- istry readings at sites located away from Lost City and any possible venting of methane or hydrogen.
The ship’s crew deployed the CTD, firing the Niskin bottles ac- cording to a depth schedule provided by the offshore Science Party members. Sensor data were recorded in the Sea-Bird Seasave (v7) software package, and the processed data were exported as CNV and ROS files.
Shipboard scientific procedures
Numbering of sites, holes, cores, and samples
Expedition numbers for IODP expeditions are sequential, start- ing with 301. Drilling sites are numbered consecutively, and for a European Consortium for Ocean Research Drilling (ECORD) Sci- ence Operator (ESO)–operated platform, numbering starts with Site M0001 (the “M” indicates the ESO-operated mission-specific platform [MSP]). For Expedition 357, the first site was Site M0068.
Multiple holes may be drilled at a single site, with the first hole as- signed the site number with the suffix “A,” the second hole the site number and the suffix “B,” and so forth. For sites where coring was not conducted but CTD casts were undertaken, the suffixes “X” and
“Z” were applied.
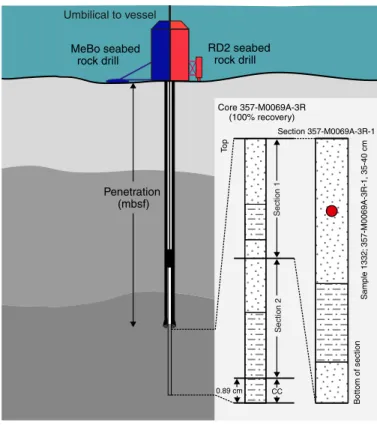
The cored interval is measured in meters below seafloor as mea- sured by the drilling apparatus. For Expedition 357, the cored inter- val consisted predominantly of the entire drilled section, with only one hole (M0072B) having a short open-hole section of 0.825 m. Re- covered core is cut into sections with a maximum length of 1.5 m and numbered sequentially from the top, starting at 1 (Figure F8).
By convention, material recovered from the core catcher is treated as a separate section labeled “CC” (core catcher) and placed below the last section recovered in the liner. The core catcher is assigned to the top of the cored interval if no other material is recovered.
When recovered core is shorter than the cored interval, the top of the core, by convention, is equated to the top of the cored interval to achieve consistency in reporting the depth in core.
Any sample removed from a core is designated by distance mea- sured in centimeters from the top of the section to the top and bot- tom of the sample removed. A full identification number for a sample consists of the following information: expedition, site, hole, core number, core type, section number, piece number (for hard rock), and interval in centimeters measured from the top of section.
For example, a sample identification of “357-M0069A-3R-2, 35–40 cm,” represents a sample removed from the interval 35–40 cm be- low the top of Section 2, Core 3R (“R” indicates core type; see be-
low), from Hole M0069A during Expedition 357 (Figure F8). All IODP core identifiers indicate core type. For Expedition 357, the following abbreviations are used:
•O = noncoring assembly/open hole.
•R = rotary coring.
The meters below seafloor of a sample is calculated by adding the depth of the sample below the section top and the lengths of all higher sections in the core to the core-top datum measured with the drill rods.
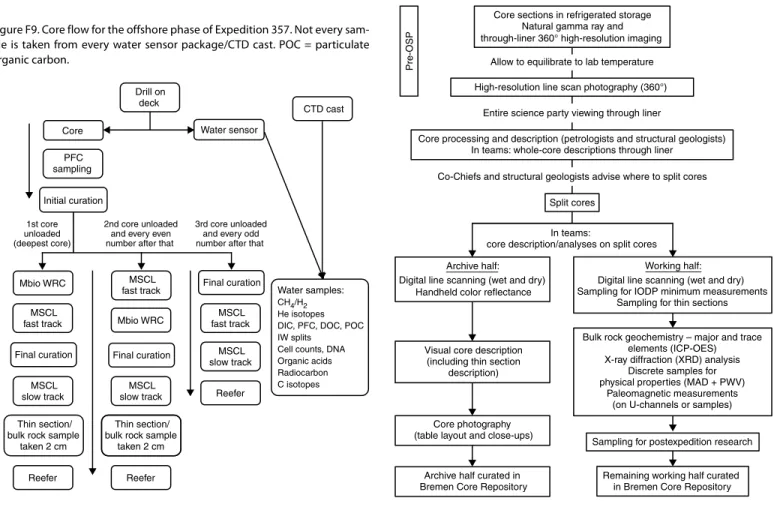
Core handling during the Expedition 357 offshore phase Because Expedition 357 utilized seabed drills, all core material arrived on deck at the same time. It was therefore necessary to mod- ify the usual IODP core flow to accommodate this novel sampling scheme, which is illustrated in Figure F9. Because of the ephemeral nature of the microbiology and geochemistry samples (see Micro- biology and Geochemistry), it was decided that the deepest core would be the first to be unloaded from the drill tool racks and deliv- ered to core curation and sampling because it had been in the core barrel for the least amount of time and represented the most pris- tine sample. Subsequently, each core barrel, working from deepest to shallowest in the hole, was removed from the tool racks and de- livered to the curation bench. Plastic “tags” were clipped onto each liner removed from the core barrels identifying the core run num- ber to prevent confusion from working in reverse order. To prevent cores from warming up, they were temporarily stored in a +4°C temperature-controlled reefer if they could not be immediately cu- rated. As the core barrels were unloaded from the drill tool racks, liner fluid was collected for PFC tracer, cell counts, and organic ac- ids analyses.
Figure F8. IODP depth and naming conventions, Expedition 357. CC = core catcher.
RD2 seabed rock drill
Core 357-M0069A-3R (100% recovery)
Top Bottom of section
Section 1
CC
Section 357-M0069A-3R-1
Sample 1332; 357-M0069A-3R-1, 35-40 cm
Penetration (mbsf)
Section 2
0.89 cm
Umbilical to vessel
MeBo seabed rock drill
As soon as a core was removed from the core barrel, it under- went preliminary curation by the ESO curators and was cut into maximum 1.5 m length sections. Where metal splits were used in- stead of polycarbonate liner, the core was transferred from the splits into polycarbonate liner by the curators prior to marking and cut- ting the cores into sections. Each section was sealed at the top and bottom by a color-coded plastic cap in line with IODP convention:
blue for the top of a core section, white for the bottom, and yellow where a whole-round core (WRC) sample for microbiology was re- moved. The core lengths in each section were entered into the Off- shore Drilling Information System (OffshoreDIS). No core splitting took place during the offshore phase of the expedition.
Curation procedures and core processing
Because the deepest core was anticipated to have changed the least with respect to the microbial communities, a WRC was taken prior to any further curation or nondestructive analyses (see Micro- biology). The WRC was photographed to document removed ma- terial. Core sections were then transferred to a fast-track multisensor core logger (MSCL) on which high-resolution (2 cm) magnetic susceptibility data were acquired without allowing any time for temperature equilibration of the cores (see Physical prop- erties). After the fast-track MSCL, for the second deepest core and every other core moving uphole, a WRC was taken for later micro- biology subsampling (see Microbiology). Next, all core section lin- ers were permanently labeled with an engraving tool. The shipboard petrologist made a brief description of the core recovered through the clear plastic liner. Cores were allowed to equilibrate to ambient temperature in the petrophysics laboratory before being measured on the standard MSCL (MSCL-S) with a measurement resolution of 2 cm (see Physical properties). Following this, a small thin section
billet was cut for thin sectioning and bulk rock characterization.
The cores were then transferred to a +4°C temperature-controlled reefer for shipping back to the IODP Bremen Core Repository (BCR; Germany).
Curation procedures and core processing for sediment cores For sediment cores, initial sampling of liner fluid and full cura- tion of the core into sections (including permanent labeling of sec- tions through engraving) was completed, and the sections were then measured on the fast-track MSCL. Windows were then cut into the liner at specific points for syringe microbiological sampling and in- sertion of Rhizons for interstitial water (IW) sampling. The ship- board petrologist made a brief description of the core recovered through the clear plastic liner, and the cores were then measured on the MSCL-S and stored in the reefer, as described above.
Core handling during the Expedition 357 Onshore Science Party
The OSP was held at the BCR from 20 January to 5 February 2016. The onshore core flow is summarized in Figure F10. Prior to the OSP, and hence before splitting, all cores were measured for nat- ural gamma radiation (NGR) and underwent 360° through-liner high-resolution digital line scanning (see COREDESC in Supple- mentary material; see Physical properties).
After removal from refrigerated storage, cores were described through the liner by the structural, igneous, and metamorphic pe- trologists using the 360° scans as a guide (see Core description).
Once this preliminary description was completed, the line-scan im-
Figure F9. Core flow for the offshore phase of Expedition 357. Not every sam- ple is taken from every water sensor package/CTD cast. POC = particulate organic carbon.
Initial curation
Final curation
CTD cast
Water samples:
CH4/H2 He isotopes DIC, PFC, DOC, POC IW splits
Cell counts, DNA Organic acids Radiocarbon C isotopes Drill on
deck
Water sensor
Reefer Final curation
Final curation MSCL
fast track Core
PFC sampling
2nd core unloaded and every even number after that 1st core
unloaded (deepest core)
Thin section/
bulk rock sample taken 2 cm
Thin section/
bulk rock sample taken 2 cm
3rd core unloaded and every odd number after that
MSCL slow track
Reefer MSCL
slow track Reefer
MSCL slow track
MSCL fast track Mbio WRC
MSCL
fast track Mbio WRC
Figure F10. Core flow for the onshore phase of Expedition 357.
High-resolution line scan photography (360°) Allow to equilibrate to lab temperature
Pre-OSP
Entire science party viewing through liner
Archive half: Working half:
Co-Chiefs and structural geologists advise where to split cores
In teams:
core description/analyses on split cores
Core processing and description (petrologists and structural geologists) In teams: whole-core descriptions through liner
Core sections in refrigerated storage Natural gamma ray and through-liner 360° high-resolution imaging
Split cores
Digital line scanning (wet and dry) Handheld color reflectance
Core photography (table layout and close-ups)
Visual core description (including thin section
description)
Archive half curated in Bremen Core Repository
Digital line scanning (wet and dry) Sampling for IODP minimum measurements
Sampling for thin sections
Sampling for postexpedition research Bulk rock geochemistry – major and trace
elements (ICP-OES) X-ray diffraction (XRD) analysis
Discrete samples for physical properties (MAD + PWV)
Paleomagnetic measurements (on U-channels or samples)
Remaining working half curated in Bremen Core Repository
ages were marked up by the structural geologists to indicate the pre- ferred orientation for core splitting. The cores were split lengthwise into working and archive halves from top to bottom.
The working and archive halves were taken for high-resolution digital line scanning, both wet and dry, followed by color reflectance spectrophotometry measurements on the archive halves. The ar- chive halves were then described by the structural, igneous, and metamorphic petrologists aided by thin sections (see Core descrip- tion), including the preferred locations for shipboard sampling, to ensure comprehensive coverage of all lithologies and structural fea- tures. Following description, archive halves were wrapped in poly- ethylene (PE) stretch film and put back into the core repository reefer.
On completion of core description, the working halves were sampled, following a Sample Allocation Committee (SAC) meeting to agree on sample locations. The first samples taken were for IODP minimum measurements, including paleomagnetism analysis on discrete cubes, physical property measurements (P-wave and mois- ture and density [MAD]), X-ray diffraction (XRD), and bulk rock measurements (see Physical properties, Paleomagnetism, Geo- chemistry, and Core description). Analyses were conducted on samples taken offshore, as were total carbon (TC)/total inorganic carbon (TIC) measurements (see Geochemistry). Additionally, standard geochemical measurements were performed on fluid sam- ples collected during the offshore phase.
Following these measurements, sampling for postexpedition re- search was undertaken, following review by the entire science party.
Locations for preferred samples were indicated using stickers, and these were reviewed by the SAC prior to postexpedition sampling.
The working halves were then wrapped and moved to the core re- pository reefer. Each sample taken was logged into the Expedition Drilling Information System (ExpeditionDIS).
Data handling, database structure, and access
Data management during the offshore and onshore phases of Expedition 357 had two stages. The first stage was the capture of metadata and data. Central to this was the ExpeditionDIS, which stored information about drilling, core curation, sampling, and pri- mary measurements. The second stage was the longer term post- expedition archiving of Expedition 357 data sets, core material, and samples. This function was performed by the World Data Center for Marine Environmental Sciences (PANGAEA) and the BCR.
The ExpeditionDIS is a flexible and scalable database system originally developed for the International Continental Scientific Drilling Program (ICDP) and adapted for ESO. The underlying data model for the ExpeditionDIS is compatible with those of the other IODP implementing organizations. For the specific expedition plat- form configuration and workflow requirements of Expedition 357, the ExpeditionDIS data model, data import pumps, and user inter- faces were adapted to form the Atlantis Massif ExpeditionDIS (DIS Version 6). This also involved some new functionality, including the set-up of predefined series for quicker entry of microbiology sam- ples, interstitial water subsamples, and CTD water samples.
The ExpeditionDIS was implemented in SQLServer-2008 R2 in- stalled on a central server with Microsoft-based client PCs connect- ing to the system through a Microsoft Access 2010 user interface.
The work on DIS development is carried out by Smartcube GmbH.
Offshore, the ExpeditionDIS was used to capture metadata re- lated to core and sample curation and downhole logging, store core catcher and WRC sample photographs, and to print section, sam- ple, and subsample labels. During Expedition 357, Niskin water
samplers with CTD were used to collect water samples prior to drilling (standard CTD) and during drilling (sensor package). The metadata from these tools and resulting samples were also captured in the ExpeditionDIS. Additionally, the database stored primary measurement data:
•MSCL data (both MSCL-S and fast-track MSCL) and
•Visual core descriptions (VCDs) of core catcher material, core sections (through liner), and WRC samples taken for microbiol- ogy.
The expedition scientists and ESO staff generated a variety of spreadsheet files, text documents, and graphics containing opera- tional and scientific data, geological descriptions, and interpreta- tions. Therefore, in addition to the structured metadata and data stored in the ExpeditionDIS, all data files were stored in a struc- tured file system on a shared file server. Full backups of the server were made twice daily, incremental backups were made continu- ously, and the main server was also replicated on the backup server.
The European Petrophysics Consortium was responsible for the capture and processing and archive of the downhole logging data (see Downhole logging).
On completion of the offshore phase of the expedition, the Ex- peditionDIS database and file system were transferred to the BCR to continue data capture during the OSP. On shore, additional data were captured in the ExpeditionDIS, including samples, thin sec- tion scans, thin section photomicrographs, core close-up images, high-resolution line-scan images (for both through-liner and split cores), color reflectance data, thin section data, NGR data, and full VCDs of split cores. All other data were loaded to the shared file server.
During the onshore phase, line-scan images were viewed in the core description laboratory across three screens using the Corelyzer Corewall application.
After the expedition, the sampling and core curation data were exported from the ExpeditionDIS to CurationDIS, the long-term BCR core curation system.
During the second stage, all Expedition 357 data were trans- ferred to the PANGAEA information system. PANGAEA is a mem- ber of the International Council of Scientific Unions World Data Centre system. It has a flexible data model that reflects the informa- tion processing steps in earth science fields and can handle any re- lated analytical data (Collier, 2015; Diepenbroek et al., 1999, 2002).
It is used for processing, long-term storage, and publication of geo- referenced data related to earth sciences. Essential services supplied by PANGAEA are project data management and distribution of vi- sualization and analysis software. Data management functions in- clude quality checking, data publication, and metadata dissemination that follows international standards.
The data captured in the Atlantis Massif ExpeditionDIS and the data stored on the shared file server were transferred to PANGAEA following initial validation procedures. The data transfer process was completed by the time of publication of the expedition reports section of this Proceedings of the International Ocean Discovery Program volume. Until the end of the moratorium period, data ac- cess was restricted to the expedition scientists. Following the mora- torium, all data except downhole wireline data were published online (http://www.pangaea.de), and PANGAEA will continue to acquire, archive, and publish new results derived from Expedition 357 samples and data sets. Downhole wireline data were archived at http://brg.ldeo.columbia.edu/logdb with a link from PANGAEA.
IODP MSP data are also downloadable from the MSP data portal at http://iodp.pangaea.de.
Core, section, and sample curation using the Atlantis Massif ExpeditionDIS
Expedition 357 followed IODP protocols and naming conven- tions (see Numbering of sites, holes, cores, and samples). The Ex- peditionDIS captured the curation metadata and printed the appropriate labels, also to IODP standards. The curation metadata comprise
•Expedition information,
•Site information (latitude, longitude, water depth, start date, and end date),
•Hole information (hole naming by letter, latitude, longitude, wa- ter depth, start date, and end date),
•Core information (core number, core type, top depth, bottom depth, number of sections, core catcher availability, curator on shift, time and date for core on deck, and any additional re- marks),
•Section data (section number and length, curated length, and curated top depth),
•Sample information (repository, request number, code observer, expedition, site, hole, core, section, half, sample top and sample bottom, and sample volume),
•Calculated core recovery percentage (on the basis of drilled or cored length versus curated recovery), and
•Calculated section recovery (on the basis of section length ver- sus curated recovery).
Core description
Core material from Expedition 357 was subject to description during both the offshore and onshore phases. As is standard for MSPs, cores were not split offshore but were cut into sections (see Introduction). Recovery was variable, and cores exhibited drilling- induced fracturing in some intervals. However, numerous intact and continuous sections of core were recovered, which indicated that significant drilling-induced rotation had not occurred, and those cores preserve the relative orientation of veins, contacts, and other structures.
Macroscopic and petrographic core observations made during the offshore and onshore phases of Expedition 357 are stored in handwritten and electronic media (see COREDESC in Supplemen- tary material). Preliminary lithologic descriptions were made off- shore by the Co-Chief Scientists on microbiology whole-round samples and on the remaining WRCs through the plastic liners. In some cases, photographs were taken of cores through the liner with a handheld camera. These photographs were provided to the sci- ence party prior to the onshore phase of the expedition. At the OSP, detailed rock descriptions and measurements of the cores through the liners followed by descriptions on split cores were made by teams assigned to three disciplines: igneous petrology, alteration petrology, and structural geology.
At the OSP, observations and measurements were carried out on the archive halves of the cores, except where otherwise noted. All observations and measurements for each site were recorded on IODP VCD forms (see COREDESC in Supplementary material;
see Core descriptions) and entered as input variables in the Expe- ditionDIS. Observable parameters in the ExpeditionDIS were fixed drop-down menu items, free text, and predefined value lists of min- eralogy and features related to structure, veins, and fractures.
Offshore visual core description
During the offshore phase of Expedition 357, general lithology, structure, lithologic contacts, major vein generations, and crosscut- ting relationships were summarized using preliminary descriptive terminology and definitions and a simplified version of the VCD form. When possible, macroscopic descriptions were confirmed with observations on small fragments of the core using a binocular microscope. Samples taken offshore for microbiology were photo- graphed on two sides where possible (see MBIOWRC in Supple- mentary material) and briefly described. Microbiological samples taken on board have the notation “MBio.” Where microbiology sam- ples were taken from intervals of coherent rock, 2–5 cm slabs were cut for OSP thin section and bulk rock analyses.
Onshore visual core description
Though-liner descriptions
Prior to the OSP, NGR was measured on the unsplit cores, and through-liner digital images were taken of the outside of each core, rotated 90° with each pass (four in total for each core section), cov- ering the whole circumference (see Physical properties). Because of the heterogeneity of the cores, a preliminary description was con- ducted prior to splitting to determine the most appropriate axis for cutting the cores. The preliminary description included rock type, metamorphic alteration, and structures through the liner, recorded on A2-sized prints of the core line scans (see COREDESC in Sup- plementary material). The desired cutting line was drawn in red wax pencil on the liner and the printed image. Core were split, ini- tially keeping the two sides together, and then carefully separated into archive and working halves. The cut core was curated, and the archive half was described following the methods explained below (Figure F10).
Cut-core descriptions
During the onshore phase of Expedition 357, detailed macro- scopic descriptions of lithology, alteration features, structures, and major vein generations and crosscutting relationships were re- corded by hand on A3-sized VCD forms that included scanned split-core images (see COREDESC in Supplementary material).
Two teams of petrologists and structural geologists working in shifts described the igneous petrology, metamorphic petrology, and structural features of all cores and thin sections. Each team was as- signed shifts that provided time and space to examine the cores and ensure overlap with the other team for information exchange. At the beginning of the OSP, each expertise group agreed on descriptive terminology and definitions for each type of measurement, which were summarized in classification diagrams and glossaries. After core descriptions were complete, the petrological and structural data were entered as input variables in the ExpeditionDIS and re- corded in logs as Microsoft Excel spreadsheets (see COREDESC in Supplementary material).
Classification and description criteria
A summary of the lithologies, line-scan images, core recovery, and most pertinent macroscopic features in each hole are repre- sented graphically in the compiled VCDs (see Core descriptions).
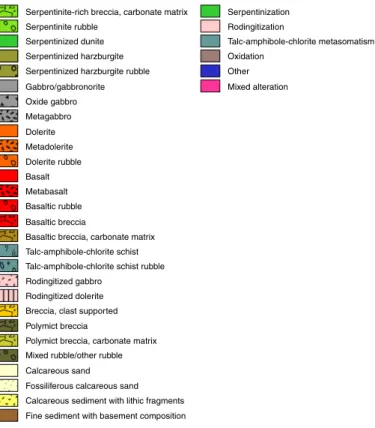
VCD information was plotted as symbols, patterns, and line plots against depth using the commercial plotting program Strater. An example of a VCD is shown in Figure F11, and a summary of the legend used for lithologic units and alteration types used in the sheets is given in Figure F12. Tabulated section data were extracted from the ExpeditionDIS or Excel spreadsheets. The locations of
samples taken for microbiology and onshore analyses are noted in the Shipboard samples column. Complete macroscopic descrip- tions and measurements are available for each site in the VCDs and in the igneous, metamorphic, and structural core logs (see CORE- DESC in Supplementary material). Microscopic descriptions on petrographic thin sections were made on selected samples at each site and recorded in thin section logs as Excel files (see COREDESC in Supplementary material). The science party also selected key intervals for shipboard XRD and bulk rock analyses.
Interval descriptions and lithologic units
Lithologic characterization was based on the homogeneity of in- tervals recovered within a section of core. If sequential intervals and pieces were homogeneous with respect to magmatic or alteration features, they were combined into one lithologic unit and described macroscopically in the corresponding ExpeditionDIS input form.
Lithologically and texturally similar pieces or intervals from consec- utive core sections were curated as the same lithologic unit. If a con- tact (e.g., change in primary mineralogy, color, grain size, or Figure F11. Example of a compiled VCD form that summarizes dominant lithologies, alteration features, and structure logged in each hole, Expedition 357. See Figure F12 for explanation of color scheme, symbols, and abbreviations.
9
9.1
9.2
9.3
9.4
9.5
9.6
9.7
9.8
9.9
10
10.1
10.2
10.3
10.4
10.5
10.6
10.7
10.8
10.9
200 100 0
1
2
XRD
TSB XRD XRD XRD
XRD TSB XRD Liner fluid
BULK XRD
XRD
XRD
XRD
WRBio_flamed
WRBio_unflamed
WRBio_flamed
XRD
Rubble of talc-amphibole-chlorite schist and serpentinite clasts (angular to rounded).
21-28 cm 3 bigger pieces but most of them are < 2mm.
For the description see units below
Semi-quantitative XRD: 25-27 cm - liz (85), clay (10), mgt (4), ox (2)
Serpentinized dunite. Very fine-grained mesh texture.
Patchy talc-rich alteration.
Gradational planar contact to unit 3.
At 33 cm is a fault with true dip 20 towards 000 in the core reference frame. A lineation plunges towards 295 degrees (data measured in working half during sampling)
Talc-amphibole-chlorite schists with two areas (37-40 and 53-59 cm) of light brown altered (rodingite?) mafic units.
In more details, the two fractured gabbro-like units show pink large clasts and black small clasts (< 1mm to about 1 mm).
The talc-amphibole-chlorite-rich area zone is more sheared at the top of the unit (light green layers alternating with black elongated clasts) that at the bottom. From 39 to 44 cm the metasomatic area is more deep green. From 44 to 51 cm it shows lighter green color; schistosity is irregular in this interval.
The deep green metasomtic area is concentrated at the contact with the alterd gabbro unit.
XRD profile made from 34 to the bottom of the core to follow the alteration/deformation linked to the mineral assemblage.
Thin section at 58-59.5cm appears to be an altered pyroxene clast in relatively undeformed chloritized rock. Possibly metagabbro? May be some talc (thin thin section) Semi-quantitative XRD: 34-35.5 cm - amph (68), chl (24), cchrys (8)
40-42 cm - chl (96), amph (29) 45-45.5 cm - chl (71), amph (29) 58-59 cm - chl (92), cchrys (7), clay (1)
62-63 cm - amph (43), chl (34), cchrys (13), clay (6), zeo (1) Serpentinized harzburgite.
Bastite 1-4 mm, most < 2 mm, mode 5%.
Mesh texture observed in few places. Most of the time is covered by reddish or deep green isotropic material.
Some late metasomatic light green veins intruded the unit and come from the previous unit. The contact between the two units is gradational.
Semi-quantitative XRD: 74-75 cm - tlc (62), amph (17), liz (12), cchrys (9), chl (1)
Talc-amph-chl schist with rodingite gabbro-like intrusion, same as unit 3. Maybe more ligth green in color with respect to the unit 3 (talc more abundant?).
There is a gradational transition from static alteration to sheared zone from the top to the bottom.
Intensely deformed zone with schistosity and mylonitization and cataclasis at the end of the unit.
100-104 cm ("left side" of the core)+ gabbro-like rodingite zone.
104-to the end; MBIO look like rodingite and talc-amphibole-chlorite schists.
Semi-quantitativet XRD: 83-84 cm - tlc (56), amph (31), chl (11), liz (3)
89-90 cm - tlc (35), amph (26), chl (34), liz (2), pl (3) 97-98 cm - amph (63), chl (30), ant (7), hydr (1) Three big angular pieces of partially rodingitized gabbro. In some clasts the alteration is more intense, in some others is restricted to the rim (0.5cm). The alteration results in a black to light brown reddish massive mineral assemblage.
Semi-quantitative XRD: 12-13 cm - chl (71), amph (15), clay (14)
Site M0072 Hole B Core 7R Cored 8.988-10.708 mbsf
Depth (mbsf) Core length (cm) Section Section image Major lithology Dominant
alteration types and abundances (%)
100
50
0
Vein intensity
(0-5)
5
0
Magmatic fabric intensity (0-3)
3
0
Schistose fabric intensity (0-3)
Crystal-plastic fabric intensity (0-5)
5
0
Brittle- semibrittle fabric instensity
(0-5)
2000
1000
0 Shipboard sample
Description Magnetic
susceptibility (SI x 10-5)
structural or textural variation) was recognized within a given piece or interval, a new lithologic section unit was defined and described.
In this way, all important lithostratigraphic information was pre- served on a truly descriptive basis. Where contacts and/or boundar- ies deviated from horizontal within the core reference frame, their depths were logged on the right-hand side of the cut face of the ar- chive half when viewed upcore. A summary of the lithologic units, including the description of the lithologic contacts, was logged into the corresponding ExpeditionDIS section unit input form. Subdivi- sions were occasionally defined for specific intervals where subtle changes in lithology occur over short intervals (e.g., grain size and modal abundance of principal phases).
Based on the description of lithologic intervals and their con- tacts, coherent rock type units were defined on a broader, more in- terpretative scale after discussions with the entire scientific party.
Description, characterization and explanations, and reasoning for combination of lithologic units are summarized for each hole sepa- rately in the Lithology, alteration, and structure section of each site chapter. Entries into ExpeditionDIS include each lithologic interval;
core, section, interval; interval depth (in mbsf ) of top and bottom;
piece numbers; complete lithologic name (of the principal lithology and modifiers, if used); and description of the contacts. Average grain sizes and modal contents of the principal minerals for individ- ual intervals can be obtained from the VCDs (see Core descrip- tions).
Contacts between lithologic intervals and units
Distinctions between lithologic units include the following:
•Contact nature: sharp, gradational, and sutured (contacts where individual mineral grains interlock across the contact).
•Contact geometry: planar, curved, or irregular.
•Degree of deformation and relationship to bounding units:
sheared, foliated, diffuse, or fractured.
Dikes/veins
The term “dike” refers to any sharp, well-defined, and relatively thick (>1 cm) crosscutting feature formed by injection of magma.
This contrasts with “igneous vein,” which describes a thin (<1 cm) crosscutting feature formed by injection of magma with generally less well defined contacts. Dikes were generally designated as indi- vidual intervals, whereas igneous veins were typically designated as subintervals or noted within the section description. Igneous veins are described in Igneous protoliths and petrology; veins that are mineralized fractures and their infilling mineral phases and textures are described in Alteration and metamorphic petrology.
Core disturbances
Seabed drilling during Expedition 357 produced relatively con- tinuous sections of core that often preserve primary relationships between lithologic units and veined intervals. However, drilling of- ten resulted in fracturing and core disturbance. The following cate- gories of core disturbances were recorded as a comment in the ExpeditionDIS:
•Undisturbed.
•Slightly disturbed: possible core rotation and cracking.
•Moderately disturbed: partial fracturing.
•Highly disturbed: fragmented framework and fractured inter- vals.
•Rubble: drilling-induced strong fragmentation and formation of rubbly pieces.
•Soupy: water-saturated intervals that show loss of cohesion.
Lithologies
Sediment, breccia, and rubble
At a number of sites, sediment cores were collected at the top of the massif, which can provide information about the timing and tec- tono-depositional history after the surface of the massif was ex- posed on the seafloor. Sediment components were described offshore on simplified VCD forms, but no detailed lithostratigraphy was determined. Distinctions were made according to sediment type, degree of lithification, and composition and structure of detri- tal components. The sedimentary sequences include the following:
•Unconsolidated calcareous ooze or sand, commonly with abun- dant foraminifers.
•Variably lithified, fossiliferous calcareous sediment with lithic fragments and commonly with abundant foraminifers. The lithic fragments occur in varying amounts and have varying lithologies, angularity, and sizes.
•Breccias with varying amounts and composition of fossiliferous carbonate matrix and varying lithologies, angularity, and sizes of the lithic fragments. These can be matrix supported or clast sup- ported.
The cores also comprised several intervals of the following:
•Fine sandy to gravelly sediment with basement composition.
Their origin is unknown but may be attributed to drilling-in- duced fragmentation. We recorded the lithologic nature, angu- larity, and sizes of lithic fragments, as well as the color and, if possible, the composition of the finer grained material.
•Polymict breccia with subangular to angular clasts of ser- pentinite, metagabbro, and metadolerite in a carbonate matrix.
Figure F12. Lithologies, symbols, and abbreviations used in VCDs, Expedition 357.
Serpentinized harzburgite rubble Gabbro/gabbronorite Oxide gabbro Metagabbro Dolerite Metadolerite Dolerite rubble
Metabasalt Basalt
Basaltic rubble
Basaltic breccia, carbonate matrix Basaltic breccia
Talc-amphibole-chlorite schist Talc-amphibole-chlorite schist rubble Rodingitized gabbro
Rodingitized dolerite Breccia, clast supported Polymict breccia
Polymict breccia, carbonate matrix Mixed rubble/other rubble Calcareous sand Fossiliferous calcareous sand Calcareous sediment with lithic fragments Fine sediment with basement composition Serpentinite-rich breccia, carbonate matrix Serpentinite rubble
Serpentinized dunite Serpentinized harzburgite
Other Mixed alteration Serpentinization Rodingitization
Talc-amphibole-chlorite metasomatism Oxidation
Major lithology Alteration type
The origin of these breccias was subject to discussion: (1) sedi- mentary in origin with a matrix lacking obvious foraminifers or (2) tectonic in origin with extensive posttectonic carbonation of a finely grained cataclastic matrix. In several instances, this question was answered with the observation of thin sections.
Igneous protoliths and petrology
For consistency, qualitative measurements including unit con- tacts and lithologic variations were discussed between the igneous petrologists during each shift crossover. The rocks recovered during Expedition 357 were generally moderately to highly altered but in many cases preserved igneous precursor textures. Igneous units were defined on the basis of estimates of primary igneous rock types and textures. Where primary textures were preserved, mineral modes were estimated visually (after Compton, 1962). Subintervals with subtle variations or sharp changes in grain size and/or mode on a centimeter scale were grouped into a single lithologic unit. If significant, minor variations within a unit were described in the text of the hard rock VCDs and entered into the ExpeditionDIS. Mineral habits, igneous structures, and igneous fabrics were also recorded, as well as the nature of igneous contacts. Details of individual mea- surements are given below.
Primary minerals
In oceanic plutonic rock, the primary rock-forming minerals are olivine, plagioclase, clinopyroxene, orthopyroxene, amphibole, Fe- Ti oxides, sulfides, and rarely quartz. Four major classes of rock (peridotite, gabbro, dolerite, and basalt) are delineated on the basis of their igneous mineral assemblages and texture. Textures are de- fined on the basis of grain size, grain shape and habit, preferred mineral orientation, and mineral proportions.
For each primary silicate observed, the modal percentage within the lithology was visually estimated. In many cases, the estimation of primary modal mineralogy involved the observation of secondary mineralogy and inference from likely replacement reactions (e.g., replacement of plagioclase by chlorite). Visually estimated modal percentages likely reflect the primary igneous assemblages prior to alteration in most cases. Accessory phases such as additional oxide minerals, sulfide minerals, or others (e.g., zircon) were also noted where observed.
For each mineral where grain boundaries were distinguishable, the minimum, maximum, and modal grain size was recorded along with any observations of mineral shape and habit (see below). Grain size refers to the average long dimension of the minerals and is given in millimeters, as are the minimum and maximum crystal sizes. The following definitions and criteria were used.
•Dominant grain size:
•Very fine: <0.2 mm.
•Fine: >0.2–1.0 mm.
•Medium: >1.0–5.0 mm.
•Coarse: >5–30 mm.
•Mineral shape: euhedral, subhedral, and anhedral.
•Mineral habit:
•Equant: aspect ratio <1:2.
•Subequant: aspect ratio 1:2 to 1:3.
•Tabular: aspect ratio >1:3 to 1:5.
•Elongate: aspect ratio >1:5.
•Lath-shaped: long and narrow, as for tabular-elongate.
•Granular: aggregate of interlocking roughly equant crystals.
Oxide and sulfide minerals
The abundance of primary Fe-Ti oxides and sulfides in the cores was visually estimated. Textures of oxide and sulfide minerals are described in terms of the habit of the mineral and its relationship with adjacent minerals. Relative sulfide abundance in hand speci- men was visually estimated when possible. Oxide observed in hand specimens was divided into the following categories:
•Disseminated: scattered grain to grain clusters with no pro- nounced fabric.
•Interstitial network: oxides that occur interstitial to silicates.
In hand specimens, oxide minerals are also differentiated ac- cording to morphologies: euhedral, anhedral, angular aggregates, amoeboidal aggregates, and interstitial lenses. “Euhedral” and “an- hedral” are used where isolated individual grains are present and oxide grain boundaries are observable. In plutonic rocks, oxides commonly occur as aggregates, and for grain size determination, an aggregate is counted as a single grain.
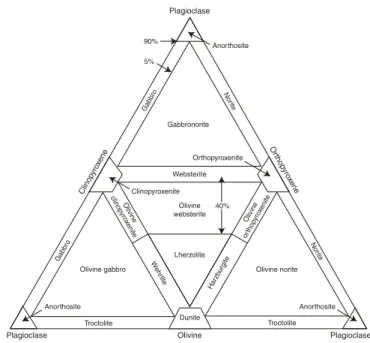
Plutonic and mantle lithologies
Igneous mafic and ultramafic rocks recovered during Expedi- tion 357 are classified on the basis of abundance, grain size, and tex- ture of their primary minerals based on the International Union of Geological Sciences (IUGS) system (Streckeisen, 1974; Le Maitre, 1989; Le Bas and Streckeisen, 1991) (Figure F13). Plutonic rock names were assigned on the basis of primary phases present prior to alteration. We have attempted to follow as closely as possible the de- scriptions from Ocean Drilling Program (ODP) Legs 153 and 209 and Integrated Ocean Drilling Program Expeditions 304/305, 309/312, 335, and 345 to allow comparison of these records. Ac- cording to the definition of the Streckeisen (1974) diagram, gabbros are the most prevalent mafic plutonic rock in Expedition 357 cores and are defined as
plagioclase + clinopyroxene > 95%;
plagioclase > 10%, clinopyroxene > 10%;
quartz < 5%.
Figure F13. Modal classification scheme for plutonic igneous rocks, Expedi- tion 357 (after Streckeisen, 1974).
Plagioclase
Anorthosite
Or tho
pyro xene 90%
5%
Gab
bro Nor
ite
Gabbronorite
Websterite Clinopyroxenite
Olivine websterite
40%
Orthopyroxenite
Clinop yro
xene
Gab bro
Olivine gabbro
Anorthosite
Plagioclase Plagioclase
Dunite
Troctolite Troctolite
Anorthosite Olivine norite Wehr
lite
Ha rzb
urgite Lherzolite Olivine
clinop yroxe
nite Olivin
e
orthop yro
xenite
Nor ite
Olivine