Structure, Magnetism, and Binding of Novel Two-Dimensional Materials:
Europium-Intercalated Graphene,
Cluster Lattices, and Polar Oxide Bilayers
I n a u g u r a l - D i s s e r t a t i o n zur
Erlangung des Doktorgrades
der Mathematisch-Naturwissenschaftlichen Fakultät der Universität zu Köln
vorgelegt von
Dipl.-Phys. Stefan Schumacher
aus Köln
Köln 2014
(Gutachter) Prof. Dr. Tim O. Wehling Prof. Dr. Heiko Wende Vorsitzender der
Prüfungskommission: Prof. Dr. Sanjay Mathur
Beisitzer: Priv.-Doz. Dr. Carsten Busse
Tag der mündlichen Prüfung: 22. Mai 2014
Abstract
In this thesis, novel two-dimensional materials are grown by molecular beam epitaxy and studied in detail. The surface structure is investigated by scanning tunneling microscopy (STM) and low energy electron diraction (LEED), whereas the magnetic properties are determined by X-ray magnetic circular dichroism (XMCD). The experimental results are supported by density functional theory (DFT) calculations.
The rare earth metal europium (Eu) intercalates at elevated temperatures underneath graphene (Gr) on iridium (Ir), driven by a large energy gain. Low energy electron mi- croscopy (LEEM) and photoemission electron microscopy (PEEM) show that penetration at wrinkles is the dominating pathway for intercalation. Depending on the coverage, the Eu atoms arrange in a p 2 2 q or a p ?
3 ?
3 qR 30
superstructure with respect to Gr.
The intercalated material forms complex patterns of stripes and islands. The underlying mechanism is explained to be an interplay of local binding inhomogeneities and relaxation of pre-exisiting strain in Gr. As a side benet, the initial strain distribution is directly visualized by local variations in the intercalation step density.
Angle-resolved photoemission spectroscopy (ARPES) reveals that Eu and cesium (Cs) intercalation induce a strong local n-doping. By deposition of cationic adsorbates onto partially intercalated Gr a preferential binding to the non-intercalated regions is found.
This preference is attributed to changes in the local work function caused by the n-doping.
DFT calculations show that charge redistributions and substrate-dependent screening yield corrections to this elementary model.
Moreover, fully closed Eu monolayers are grown on intercalated Gr and structurally com- pared with the growth of Eu on pristine Gr. Furthermore, the structure of Eu on Ir(111) is investigated. For deposition of gadolinium (Gd) on Ir(111), alloying with the substrate is observed and a comparison to other surface alloys is drawn.
The two intercalated Eu layers have fundamentally dierent magnetic properties: Whereas the p 2 2 q structure is paramagnetic, the p ?
3 ?
3 qR 30
layer shows a substantial mag-
netic coupling. For the latter, a strong in-plane anisotropy arising from the low aspect
ratio is found. DFT calculations indicate the relevance of the Ir substrate for the mag-
netic coupling, which explains deviations from the corresponding graphite intercalation
compound. For samples with Eu adsorbed on top of Gr a partial oxidation to europium
oxide (EuO) is identied, which dominates the magnetic properties.
investigated. An improved recipe for the cluster growth reduces undesired eects of cluster coalescence. Small platinum-seeded Pt
15Co
28clusters are superparamagnetic at 10 K, whereas larger Ir
50Co
500and Co
2700clusters exhibit a hysteresis due to the higher blocking temperature. The orbital moment is enhanced for the smallest clusters and gradually decreases towards the bulk value with increasing cluster size. The clusters do not show magnetic anisotropy, indicating a weak interaction with the substrate. Furthermore, rhodium (Rh) clusters are analyzed, but they do not reveal magnetic moments.
Finally, an O terminated polar EuO(111) bilayer of high quality and exceptional stability
is grown on Ir(111). DFT calculations show that the interlayer spacing is strongly reduced
compared to the bulk material, which results in an expanded in-plane lattice parameter
and rotational epitaxy. The layer contraction reduces together with a surface metalization
the electrostatic potential of the lm. For higher coverages and Eu rich growth conditions
the polarity is additionally reduced by a partial Eu adlayer. The apparent height of the
EuO(111) islands in STM strikingly depends on the type of co-adsorbed species on the
adjacent Ir terraces, which can be attributed to dierent work functions. The EuO(111)
bilayer does not exhibit ferromagnetism down to 45 K as revealed by magneto-optical Kerr
eect (MOKE) measurements.
Kurzdarstellung
Im Rahmen dieser Arbeit werden verschiedene neuartige zweidimensionale Materialien mittels Molekularstrahlepitaxie gewachsen und detailliert untersucht. Zur Bestimmung der Oberächenstruktur dienen dabei Rastertunnelmikroskopie (STM) und niederener- getische Elektronenbeugung (LEED), während die magntischen Eigenschaften mit zirku- larem Röntgendichroismus (XMCD) gemessen werden. Die experimentellen Ergebnisse werden durch Dichtefunktionaltheorie-Rechnungen (DFT) gestützt.
Das Seltenerdmetall Europium interkaliert bei erhöhten Temperaturen getrieben durch einen groÿen Energiegewinn unter Graphen auf Iridium. Niederenergetische Elektronen- mikroskopie (LEEM) und Photoemissionselektronenmikroskopie (PEEM) zeigen, dass die Europiumatome dabei hauptsächlich an Falten der Graphenlage eindringen. Ab- hängig von der Bedeckung, formen die Europiumatome entweder eine p 2 2 q- oder eine p ?
3 ?
3 qR 30
-Überstruktur in Bezug auf Graphen. Das interkalierte Material bildet komplexe Muster aus Streifen und Inseln. Der zugrundeliegende Mechanismus wird durch das Zusammenspiel von lokalen Bindungsinhomogenitäten und der Relaxation von präexistenter Dehnung im Graphen erklärt. Als Nebeneekt, wird die ursprüngliche Dehnungsverteilung direkt durch die Interkalationsstufendichte abgebildet.
Winkelaufgelöste Photoemissionsspektroskopie (ARPES) zeigt, dass sowohl Europium- als auch Cäsiuminterkalation eine starke n-Dotierung des Graphens verursacht. Bei der Deposition von kationischen Adsorbaten auf teilinterkaliertem Graphen wird eine bevorzugte Bindung an die nichtinterkalierten Bereiche beobachtet. Diese Bevorzugung liegt in einer Veränderung der lokalen Austrittsarbeit durch die Dotierung begründet.
DFT-Rechnungen zeigen, dass Ladungsumverteilungen und ein substratabhängiges Ab- schirmverhalten Korrekturen zu diesem eingängigen Modell liefern.
Des Weiteren werden volle Europiummonolagen auf interkaliertem Graphen gewachsen und strukturell mit dem Wachstum von Europium auf nichtinterkaliertem Graphen ver- glichen. Zudem wird die Struktur von Europium auf Ir(111) untersucht. Bei der Depo- sition von Gadolinium auf Ir(111) bildet sich eine Legierung mit Substrat, sodass ein ein Vergleich zu anderen Oberächenlegierungen gezogen werden kann.
Die beiden interkalierten Europiumlagen besitzen grundsätzlich verschiedene magnetische Eigenschaften: Während die p 2 2 q-Struktur paramagnetisch ist, weist die p ?
3 ?
3 qR 30
-
Lage eine substantielle magnetische Kopplung auf. Für die letztere Struktur liegt die
tiert. DFT-Rechnungen weisen auf eine besondere Bedeutung des Iridiumsubstrats hin, was Unterschiede zur entsprechenden Graphitinterkalationsverbindung erklärt. Für alle Proben, bei denen Europium in adsorbierter Form vorliegt, ndet eine teilweise Oxidation zu Europiumoxid statt, welches die magnetischen Eigenschaften dominiert.
Darüber hinaus werden die magnetischen Eigenschaften von Cobalt-Clustergittern auf dem Moiré von Graphen mit Ir(111) untersucht. Ein verbessertes Wachstumsrezept min- imiert dabei unerwünschte Eekte durch die Koaleszenz von Clustern. Während kleine Pt
15Co
28-Cluster mit Platin-Keimen superparamagnetisch sind, weisen gröÿere Ir
50Co
500- und Co
2700-Cluster auf Grund der höheren Blockingtemperautur hysteretisches Verhalten auf. Das magnetische Bahnmoment ist für die kleinsten Cluster erhöht und nähert sich mit zunehmender Clustergröÿe stetig dem Wert im Festkörper an. Die Cluster besitzen keine magnetische Anisotropie, was auf eine schwache Wechselwirkung mit dem Substrat hindeutet. Des Weiteren werden Rhodium-Cluster untersucht, die jedoch keine messbaren magnetischen Momente aufweisen.
Zuletzt wird eine sauerstoterminierte polare EuO(111)-Doppellage von hoher Qualität
und auÿergewöhnlicher Stabilität auf Ir(111) untersucht. DFT-Rechnungen zeigen, dass
die Doppellage einen stark reduzierten Lagenabstand aufweist, der einen erhöhten Gitter-
parameter in der Ebene sowie Rotationsepitaxie nach sich zieht. Der reduzierte Lagenab-
stand verringert gemeinsam mit einer Metallisierung der Doppellage das elektrostatische
Potential. Für höhere Bedeckungen und europiumreiche Wachstumsbedingungen wird
die Polarität zusätzlich durch eine adsorbierte Europium-Teillage minimiert. Die schein-
bare Höhe der EuO(111)-Inseln im STM hängt stark von der Art der Adsorbate auf den
umgebenden Ir(111)-Terrassen ab, was in unterschiedlichen Austrittsarbeiten begründet
liegt. Die Doppellage zeigt keinen Ferromagnetismus bis hinab zu 45 K, wie Messungen
des magneto-optischen Kerr Eekts (MOKE) belegen.
Contents
1 Introduction 1
2 Background 5
2.1 Graphene . . . . 5
2.1.1 Graphene on Ir(111) . . . . 7
2.1.2 Graphene as Cluster Template . . . 10
2.1.3 Intercalation Underneath Graphene . . . 11
2.1.4 Magnetism and Graphene . . . 13
2.2 Europium . . . 16
2.2.1 Magnetism of Bulk Europium . . . 16
2.2.2 Europium Graphite Intercalation Compounds . . . 17
2.2.3 Europium Oxide . . . 20
2.3 Nanomagnetism . . . 21
2.3.1 Magnetic Moments . . . 21
2.3.2 Magnetic Anisotropy . . . 23
2.3.3 Superparamagnetism . . . 24
2.4 Polar Oxide Surfaces . . . 26
3 Experimental Methods 29 3.1 Scanning Tunneling Microscopy . . . 29
3.2 X-Ray Magnetic Circular Dichroism . . . 32
3.2.1 X-ray Absorption Spectroscopy . . . 32
3.2.2 Two Step Model . . . 33
3.2.3 Sum Rules . . . 35
3.3 Low Energy Electron Diraction . . . 36
3.4 Low Energy Electron Microscopy . . . 38
3.5 Photoemission Electron Microscopy . . . 40
3.6 Angle-Resolved Photoemission Spectroscopy . . . 41
4 Setup and Procedures 43 4.1 Ultrahigh Vacuum System ATHENE . . . 43
4.2 XMCD Beamline . . . 45
4.3 ARPES Setup . . . 45
4.5 Sample Preparation . . . 47
4.6 Density Functional Theory . . . 48
5 Intercalation of Europium 51 5.1 Submonolayer Regime . . . 51
5.1.1 Atomic Structure . . . 52
5.1.2 Energy Gain upon Intercalation . . . 53
5.1.3 Pattern Formation . . . 54
5.1.4 Visualization of Strain by Intercalation . . . 66
5.2 Compaction of the Monolayer . . . 67
5.3 Band Structure and Doping . . . 68
5.4 Mechanism of the Intercalation Process . . . 72
5.5 Summary . . . 78
6 Adsorption on Intercalated Graphene 81 6.1 Manipulating Adsorption by Intercalation . . . 82
6.2 Formation of Complete Adlayers . . . 91
6.3 Summary . . . 96
7 Rare Earth Layers on Iridium 97 7.1 Europium on Iridium . . . 97
7.2 Gadolinium on Iridium . . . 100
7.3 Summary . . . 105
8 Magnetism of Europium Layers 107 8.1 Intercalated Structures . . . 107
8.2 Europium Sandwich Structures . . . 118
8.3 Europium on Iridium . . . 122
8.4 Summary . . . 123
9 Magnetism of Metal Clusters on Graphene 125 9.1 Moiré-Templated Cobalt Clusters . . . 125
9.2 Larger Cobalt Clusters . . . 135
9.3 Rhodium Clusters . . . 137
9.4 Europium Clusters . . . 142
9.5 Summary . . . 143
10 Polar Europium Oxide on Ir(111) 145
10.1 DFT Calculations . . . 146
10.2 Structure and Growth . . . 148
10.2.1 Rotational Misalignment . . . 152
10.2.2 Apparent Height and Work Function . . . 154
10.2.3 Defects in the Bilayer . . . 160
10.2.4 Inuence of the Europium Excess . . . 162
10.3 Temperature Stability . . . 164
10.4 Magnetic Properties . . . 165
10.5 Summary . . . 166
11 Summary and Outlook 169 A Appendix 175 A.1 Band Structure of Graphene at the M Point . . . 175
A.2 Higher Gadolinium Coverages on Ir(111) . . . 176
A.3 Magnetic Properties of Cobalt on Ir(111) . . . 178
A.4 Magnetism of Gadolinium Layers . . . 179
Bibliography 181
List of Publications 213
Acknowledgement 215
Ocial Announcement 217
Frequently Used Abbreviations
Chemical elements frequently used in this thesis are carbon (C), oxygen (O), iron (Fe), cobalt (Co), rhodium (Rh), cesium (Cs), iridium (Ir), platinum (Pt), europium (Eu), and gadolinium (Gd). Furthermore, graphene is abbreviated by Gr.
ARPES - Angle-Resolved Photoemission Spectroscopy CVD - Chemical Vapor Deposition
DFT - Density Functional Theory fcc - face-entered cubic
FWHM - Full Width at Half Maximum GIC - Graphite Intercalation Compound hcp - hexagonal close-packed
(L)DOS - (Local) Density of States
LEED/LEEM - Low Energy Electron Diraction/Microscopy MBE - Molecular Beam Epitaxy
ML/BL - Monolayer/Bilayer (see each chapter for denition) MOKE - Magneto-Optical Kerr Eect
(N)NN - (Next) Nearest Neighbor
PEEM - Photoemission Electron Miscoscopy
RKKY - Ruderman-Kittel-Kasuya-Yoshida (interaction) STM/STS - Scanning Tunneling Microscopy/Spectroscopy TBA - Tight-Binding Approximation
TEY - Total Electron Yield
TPG - Temperature Programmed Growth
UHV - Ultra High Vacuum
vdW - van der Waals
XAS - X-Ray Adsorption Spectroscopy
XMCD - X-Ray Magnetic Circular Dichroism
CHAPTER 1
Introduction
Magnetism has fascinated mankind at least since the invention of the compass by the early Chinese civilization. The applications of magnetism are manifold and range in size from several meters down to the nanometer regime. When reducing the dimensions, often novel magnetic phenomena occur which cannot be deduced from the bulk counterpart [1].
Thus, the eld of nanomagnetism, which deals with nanoparticles and -wires, thin lms, and multilayer systems, is a fertile eld for scientic research.
Small magnetic particles often occur in nature: They are found in living beings from bacteria [2] to higher organisms, such as insects or birds [3], and allow them to orient in the Earths magnetic eld. Fossils of magnetotactic bacteria [4] and naturally occur- ring magnetic nanoparticles in rocks and soils contain comprehensive information about geology, environmental conditions, and past anthropic activities [5].
Also in the view of technological applications, nanomagnetism is an integral part of to- day's world: In medicine, it may be used for drug delivery to specic organs and tissues [6], cancer therapy by magnetic hyperthermia [7], or magnetic resonance imaging [8].
Moreover, small magnetic structures are indispensable for magnetic recording and data storage: The discovery of the giant magnetoresistance (GMR) eect [911] made it possi- ble to reduce the bit size in hard disk drives down to the nanometer regime [12]. Closely related to nanomagnetism is the eld of spintronics, which wants to use the electron's spin instead of its charge as information carrier [13, 14]. Since a pure spin current does not produce ohmic losses, spintronics potentially oers highly energy-ecient logic devices.
In order to either improve existing or to develop novel nanomagnetic materials, it is
of fundamental importance to understand not only the magnetic behavior, but also the
structural and binding properties. Therefore, this thesis combines classical techniques of
surface science such as scanning tunneling spectroscopy and low energy electron diraction
with magnetic measurements by means of X-ray magnetic circular dichroism. Supported by density functional theory calculations, a profound understanding on structure, mag- netism, and binding of novel two-dimensional materials is obtained.
A promising material in the view of spintronics is graphene (Gr). The two-dimensional carbon allotrope has a high electron mobility [15] and a long spin diusion length [16], which turns it into an excellent spin conductor. Since the electrons in Gr are inherently not spin-polarized, one needs to bring Gr in contact with magnetic materials to make full use of this potential. However, the extended d orbitals of the ferromagnetic transition metals Fe, Co, and Ni destroy the unique band structure of Gr by forming covalent bonds [17, 18]. Therefore, it is a promising approach to contact Gr with rare earth elements, since most of them do not possess occupied d orbitals, and the magnetic moment carried by the localized 4f shell is highly robust to the chemical environment.
With this in view, the intercalation of Eu underneath Gr on Ir(111) is investigated. Inter- calation has previously been shown to be a exible means to manipulate the properties of Gr [1923]. Furthermore, it allows to eciently protect a reactive layer against oxidation [24]. Several points motivate the choice of Eu as intercalant: First, Eu has a large mag- netic moment of 7 µ
Band displays magnetic order in the bulk [2527]. Second, the binding of Eu to Gr is predominantly of ionic character and thus leaves the band structure of Gr intact [28, 29]. Finally, the corresponding graphite intercalation compound EuC
6shows an unusual metamagnetic behavior [30, 31]. Thus, one may conjecture also exceptional magnetic properties for Eu intercalated Gr. Moreover, changes in magnetism when going from the bulk compound to a single monolayer can be analyzed.
While investigating the intercalation of Eu, two side benets were discovered: First, it became apparent that the intercalated material forms complex and appealing patterns.
Pattern formation has always fascinated surface scientists, ranging from early investiga- tions of the Si(111) p 7 7 q reconstruction [32], via self-assembly of Pb on Cu(111) [33], right up to ion beam induced pattern formation on Si [34]. Hence, it is interesting to reveal whether novel pattern formation mechanisms are involved in the present system.
Second, it turned out that the binding of ionic adsorbates to Gr is inuenced by the inter- calation. Although similar eects have been reported before [3538], the Eu intercalation pattern with patches of intercalated and non-intercalated Gr side by side is a unique tool to directly visualize a preferred binding to certain regions.
In addition to the interest for Gr itself in the context of nanomagnetism, the moiré pattern
of Gr with Ir(111) can serve as a template for the growth of well-ordered, monodisperse
clusters with tunable size [39, 40]. Lattices of ferromagnetic transition metal clusters
are highly interesting in respect of their potential use in magnetic data storage devices, since they provide a high density of well-separated magnetic domains [41]. Furthermore, their systematic investigation allows to address several fundamental questions: How do the magnetic properties change with the cluster size? Do the clusters show an anisotropy as strong as the one predicted for Co dimers on Gr [42] or measured for adsorbed and intercalated Co layers on Gr on Ir(111) [43, 44]? And nally, is there a magnetic coupling between the clusters, since they are separated by only 2.5 nm? Moreover, it is interesting to investigate clusters made of 4d transition metals such as Rh, Ru, or Pd which are non-magnetic in the bulk, but have been either predicted or proven to exhibit magnetic moments when present in the form of small clusters [45, 46].
Besides ferromagnetic metals, also ferromagnetic semiconductors such as EuO are promis- ing materials for spintronics [47]. Previously, EuO(100) lms on Ni(100) [48, 49] and Gr [50, 51] have been successfully investigated by our group. In this thesis, EuO is grown on Ir(111), resulting in the formation of a EuO(111) bilayer, where the oppositely charged Eu and O layers are stacked on top of each other. Such a polar surface orientation is usually avoided by nature since it involves a high electrostatic energy [52, 53]. Hence, it is inviting to discover which polarity-compensating mechanisms are at work to stabilize the surface. Moreover, polar surfaces are of special interest since their magnetic, elec- tronic, and catalytic properties often strongly dier from the corresponding bulk material [5456]. Whereas in the past polar oxide bilayers based on a variety of transition and earth alkali metals have been investigated [5761], the properties of rare earth polar oxide bilayers have never been studied up to now.
The thesis at hand is organized as follows: In Chap. 2, I introduce the fundamental
properties of the investigated materials and the basic concepts of nanomagnetism. Chap. 3
reviews the experimental techniques used in this thesis. The corresponding setups and
procedures are described in Chap. 4. In the following chapters, I present the structural
and electronic properties of intercalated Eu (Chap. 5), the impact of intercalation on the
binding of ionic adsorbates (Chap. 6), and the growth of rare earth layers on Ir(111)
(Chap. 7). Afterwards, I discuss in Chaps. 8 and 9 the magnetic properties of intercalated
and adsorbed Eu monolayers, and of dierent metal cluster lattices. Results on the
polar EuO bilayer on Ir(111) are presented in Chap. 10. To conclude, a summary with
perspectives for future research is given in Chap. 11.
CHAPTER 2
Background
Secs. 2.1.1, 2.1.3, 2.2.3 and 2.4 are partially published in Refs. [62], [63] and [64].
In this chapter, I review the properties of the two main ingredients of this thesis, which are (i) epitaxial Gr on Ir(111), and (ii) Eu in intercalated, adsorbed, or oxidized form.
Furthermore, I introduce the basic concepts of nanomagnetism, and give a short overview of polar oxide surfaces.
2.1 Graphene
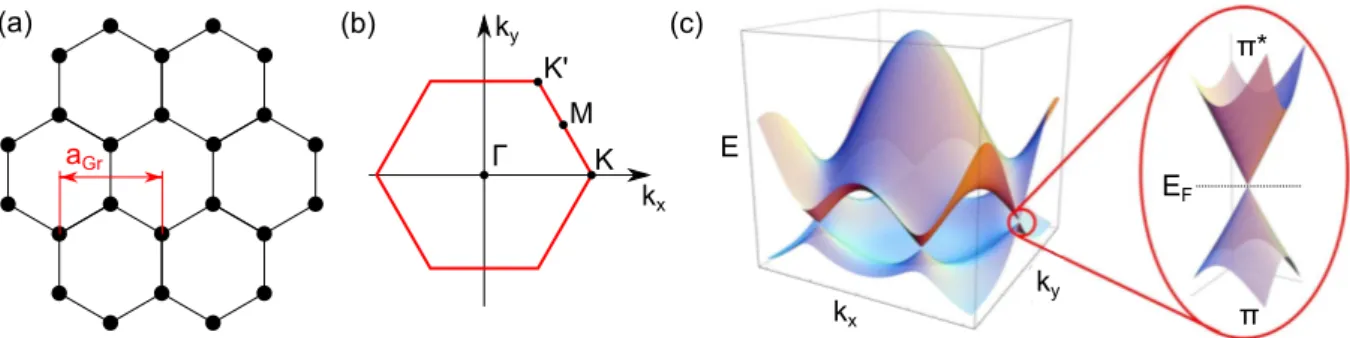
As shown in Fig. 2.1(a), Gr is a two-dimensional layer of C atoms arranged in a hexagonal lattice with a two-atom basis (honeycomb lattice). The lattice constant is a
Gr2.46 Å.
Gr naturally occurs in graphite, where Gr layers are stacked on top of each other. By mechanical exfoliation using a scotch tape single Gr layers can be isolated [65]. However, this method yields only sparsely distributed and micrometer-sized Gr akes. A more controlled and large-scale fabrication of Gr can be achieved by thermal decomposition of SiC [66, 67], or epitaxial growth on a variety of metal surfaces [6874].
The C atoms in Gr are sp
2hybridized. Whereas neighboring sp
2orbitals overlap in-plane to form σ bonds, the remaining p
zorbitals form a delocalized π system; its dispersion within the rst Brillouin zone (see Fig. 2.1(b)) is shown in Fig. 2.1(c). Most prominent is the linear dependence of the energy E on the modulus of the wave vector ~k
E ~ v
Fb
k
2xk
y2(2.1)
in the vicinity of the K and K' points with a Fermi velocity v
Fof about 10
6m { s . The
peculiar band structure arises from its monoatomic thickness and the lattice symmetry of
a
Grk
xk
yK K'
M Γ
(a) (b) (c)
k
yk
xE
π π*
E
FFigure 2.1: (a) Hexagonal crystal structure of Gr. The lattice constant a
Gris indicated. (b) First Brillouin zone of Gr with the high symmetry points Γ , M, K, and K'. (c) Electron dispersion of the π and π
bands within the rst Brillouin zone. The zoom shows one of the Dirac points.
Panel (c) is adapted from Ref. [15].
Gr [75]. As it resembles the dispersion of massless fermions described by the relativistic Dirac equation, the regions around the K points are denoted as Dirac cones [15]. For pristine Gr the occupied π and unoccupied π
bands touch each other at the Fermi energy (Dirac point). Since there are no other bands around E
F, the density of states (DOS) vanishes here, making Gr a zero-gap semiconductor.
Transport measurements [76] and theoretical considerations [77] show that Gr has a re- markably high electron mobility at room temperature. Furthermore, the Dirac fermions show in comparison to ordinary electrons new physical phenomena such as the anomalous integer quantum Hall eect [78] or Klein tunneling [79]. These extraordinary properties caused a rapid increase in Gr research. In 2010, A. Geim and K. Novoselov were awarded by the Nobel Prize in Physics for their groundbreaking experiments [80].
Gr has been proposed for use in versatile applications; some of them have already been demonstrated on a laboratory scale. For example, since Gr is optically almost transparent [81] and has a high conductivity, it is a promising candidate for transparent electrodes needed in touchscreens and solar cells [82, 83]. In comparison to the standard material indium tin oxide, Gr would be cheaper and more exible.
Gr can furthermore be integrated in a eld-eect transistor geometry [84]. However, such
transistors cannot be eectively turned o due to the absence of a band gap. To overcome
this problem for logic devices several ways of inducing a band gap have been proposed,
such as constraining Gr in one dimension by forming nanoribbons [85], biasing bilayer Gr
[86], or applying strain [87]. On the other hand, for radiofrequency applications like small
signal ampliers a complete switch-o is not required. Hence, high-frequency transistors
making use of the high charge carrier mobility have been successfully fabricated [88].
2.1 Graphene The high sensitivity of the charge carrier density of Gr to chemical doping by adsor- bates can be exploited to build gas sensors that are able to detect single molecules [89].
Moreover, the high heat conductivity of Gr might solve heat dissipation problems in na- noelectronics [90]. Another potential application are ultracapacitors that combine the advantages of conventional capacitors (high speed charging) with the ones of batteries (high energy density). Therefore, electrodes made of a material with large surface to volume ratio and high conductivity are needed, both provided by Gr. Finally, Gr is a promising material for spintronics which will be discussed in more detail in Sec. 2.1.4. For a comprehensive overview of the properties and potential applications of Gr the reader is referred to Refs. [76], [15] or [91].
2.1.1 Graphene on Ir(111)
Epitaxial Gr on Ir(111) can be grown by thermal decomposition of hydrocarbons in excep- tionally high quality, and self-limited to a single monolayer [39, 71, 92, 93]. Two growth methods will be presented in Sec. 4.5. In the following, I briey summarize the most important structural and electronic properties of Gr on Ir(111).
The Moiré Unit Cell and Binding to the Substrate
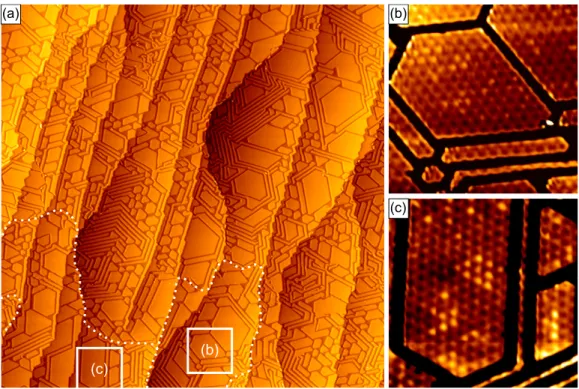
Fig. 2.2(a) shows an atomically resolved STM topograph of Gr on Ir(111). The small black dots correspond to the centers of the C rings. Additionally, due to the lattice mismatch between Gr and Ir a superstructure arises which is called moiré and visible as bright spots in Fig. 2.2(a). The moiré mesh consists of p 10.32 10.32 q Gr unit cells resting on p 9.32 9.32 q Ir atoms [93], resulting in a periodicity of 2.53 nm.
Due to the varying lateral position of the C atoms with respect to the Ir lattice, one can identify three high symmetry congurations: in an atop (fcc, hcp) area, the centers of the C rings are located above atop (regular hollow or fcc, faulted hollow or hcp) Ir sites. In Fig. 2.2(a) the moiré unit cell is schematically tiled by white, green, and red hexagons, representing atop, fcc, and hcp areas. This model will be frequently used later.
The binding of Gr to Ir(111) was investigated by Busse et al. using nonlocal van der
Waals (vdW) DFT [95]. The unit cell was commensurably approximated by p 10 10 q
Gr honeycombs resting on p 9 9 q Ir atoms as shown in Fig. 2.2(b). The authors nd a
small average binding energy of -50 meV per C atom indicating that the binding of Gr
to Ir is largely vdW mediated physisorption. The weak binding causes a large average
height of Gr above Ir, which was calculated to be 3.41 Å, in excellent agreement with the
experimental value of p 3.38 0.04 q Å determined by X-ray standing waves, and similar
fcc hcp atop
(a) (b)
3.65Å
3.20Å fcc
hcp
atop
Figure 2.2: (a) STM topograph of Gr on Ir(111) p 6 nm 6 nm q. The moiré cell is schematically tiled by white, green, and red hexagons, representing atop, fcc, and hcp areas. Partially adapted from Ref. [94]. (b) Top view of the relaxed moiré unit cell obtained by vdW-DFT. The brightness of the C atoms represents their height above the Ir substrate according to the adjacent color scale.
Adapted from Ref. [95].
to the interlayer distance in graphite of 3.36 Å [96]. The weak average bonding of Gr to Ir(111) was also conrmed by X-ray photoemission spectroscopy [97].
The nonlocal vdW binding is modulated by weak chemical bonds resulting in a height corrugation of Gr. As visible in Fig. 2.2(b), the largest distance of 3.62 Å between Gr and Ir is found in the atop regions, indicating a chemical repulsion in these areas. The hcp and fcc regions have a lower height of 3.27 Å and 3.29 Å, respectively, resulting from weak attractive chemical bonds. They arise from a slight hybridization between C 2p
zorbitals and Ir 5d
3z2r2orbitals for C atoms that sit exactly atop of Ir atoms [95]. The weak hybridization is also visible in angle-resolved photoemission spectra [98].
Orientation of the Moiré Unit Cell
As shown in Ref. [93], the atop areas of the moiré lattice always appear as dark depressions in a bright surrounding, or as bright protrusions in a dark surrounding depending on the contrast. Hence, it is easy to identify them in STM. However, to distinguish between fcc and hcp areas additional information about the sample orientation is needed.
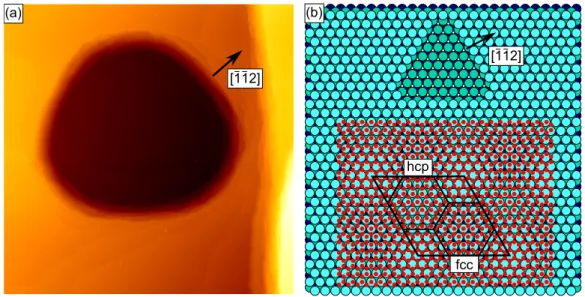
This information can be gained by looking at equilibrated vacancy islands or stacks of
them, which occasionally remain on the Ir surface if the annealing temperature after
sputtering was not suciently high. The sputtering crater with a at bottom shown
in Fig. 2.3(a) is a stack of equilibrated vacancy islands. From Ref. [99] it is known
that the longer edges of the threefold symmetric equilibrium shape correspond to t 111 u-
microfacetted steps, while the shorter ones correspond to t 100 u-microfacetted steps. This
2.1 Graphene
fcc [112]
hcp (a) (b)
[112]
Figure 2.3: (a) STM topograph displaying a stack of vacancy islands resulting from sputtering and annealing to 1200 K ( 630 nm 630 nm ). The arrow is pointing in r ¯ 1¯ 12 s direction perpendicular to t 111 u-microfacetted ascending steps. (b) Ball model for the orientation of the Ir single crystal (surface layer: light blue; second layer: green; third layer: dark blue). In the upper part a vacancy island is drawn to illustrate the long t 111 u- and short t 100 u-microfacetted steps. In the lower part, the Gr lattice (red) is put on top and the moiré unit cell is indicated.
implies a sample orientation as shown in Fig. 2.3(b) and indicated by the arrow in Fig. 2.3(a).
Putting the Gr lattice on top reveals that the moiré unit cell is oriented with the hcp area in the upper left and the fcc area in the lower right part. As the rotational alignment of our sample with respect to the STM is xed, this orientation will be used for the analysis of all experiments presented in this thesis.
Pre-existing Strain
The growth of Gr on Ir(111) is conducted at high temperatures. Because of a mismatch between the thermal expansion coecients of Gr and Ir, the Gr layer becomes compres- sively strained during cool down to room temperature. A signicant part of this strain relaxes by formation of one-dimensional wrinkles. However, even at room temperature a small residual compressive strain is left [100].
A detailed picture of the strain release process is shown in Fig. 2.4 which is adapted
from Ref. [101]: During cool down from the growth temperature (A) the Gr layer builds
up compressive strain until the strain energy is large enough to overcome the activation
energy for wrinkle formation at point B. This happens approximately 400 K below the
growth temperature. The wrinkles nucleate between B and C, and grow from C to D,
Figure 2.4: Interplay of compression/expansion of the Gr lattice and wrinkle formation during a cycle of cooling (A to D) and heating (D to F). The gray arrows indicate the thermal com- pression/expansion of the Ir substrate. The remaining strain in the Gr layer is indicated by the colors shown on the left side. Taken from Ref. [101].
while the Gr lattice remains slightly compressed compared to the graphite lattice constant at the same temperature. Heating the sample again leads rst to an expansion of the Gr lattice (D to E), while the wrinkles are stretched out only between E and F. After complete disappearance of the wrinkles at point F the Gr layer is again stretched by the expanding Ir lattice, resulting in tensile strain when going above the original growth temperature.
2.1.2 Graphene as Cluster Template
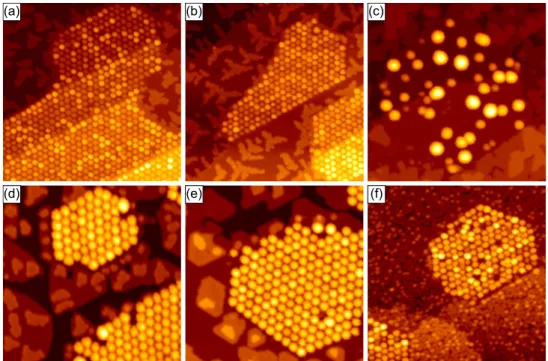
The moiré pattern of Gr on Ir(111) can be used as a template for the growth of cluster lattices [39, 40]. Fig. 2.5 shows STM topographs after deposition of the indicated metals onto Gr akes on Ir(111). As visible in Figs. 2.5(a) and (b), Ir and Pt clusters grow close to perfection. The clusters are oriented with their (111) planes parallel to the substrate surface, and their x 1¯ 10 y parallel to the x 1¯ 120 y directions of Gr [40]. The atomic structure has been studied in detail in Ref. [102] by surface X-ray diraction.
The mechanism of cluster formation is provided by rehybridization of Gr from its sp
2conguration to diamond-like sp
3beneath and in the vicinity of the clusters [103, 104].
The rehybridized C atoms bind with their fourth bond alternately to Ir atoms below and
cluster atoms above, thereby locally reducing the average Gr height above Ir from 3.4 Å to
2.1 Å. As this is only possible where Ir atoms are directly located below C atoms, the en-
2.1 Graphene
(a) (b) (c)
(d) (e) (f)
Figure 2.5: STM topographs of Gr akes covered with dierent metal clusters grown at room temperature except for (f). The deposited amounts are given in monolayers with respect to Ir(111). (a) 0.20 ML Ir. (b) 0.25 ML Pt. (c) 0.77 ML Fe. (d) 0.10 ML Ir plus 0.70 ML Fe. (e) 0.10 ML Ir plus 0.45 ML Co. (f) 0.45 ML Re deposited at 200 K. Image sizes are p 800 nm 800 nm q for (a) - (c) and (f), and p 500 nm 500 nm q for (d) - (e). Panels adapted from Ref. [40].
ergetically preferred adsorption sites are the hcp regions. The rehybridization mechanism is experimentally supported by X-ray photoemission spectroscopy [94].
The ability to form clusters strongly depends on the deposited material. For example Fe does not form a well-ordered cluster lattice as shown in Fig. 2.5(c). Zhou et al. suggested that a high metal-C bond strength, which can be estimated from the metal-C bond dissociation energy, is an indicator for cluster formation [105].
Nevertheless, well-ordered clusters can also be grown for materials with weak metal-C bonds, either by seeding with small Ir or Pt clusters (see Figs. 2.5(d) and (e) for Fe and Co), or deposition at low temperatures as shown for Re in Fig. 2.5(f) [40].
2.1.3 Intercalation Underneath Graphene
In chemistry, intercalation describes the incorporation of atoms or molecules into a chem-
ical compound without essentially changing its structure. The most common examples
are graphite intercalation compounds (GIC) [106]. In these compounds the intercalants
(often alkali metals) are located between the Gr layers. GIC are classied by a stage
n denoting the number of Gr layers between adjacent intercalation layers. Staging is a general phenomenon in GIC, even for very dilute concentrations of the intercalants.
Intercalation into graphite can eectively change the physical properties of the host ma- terial: As the free charge carrier concentration in graphite is very low, doping by the intercalants permits a wide variation of the charge carrier concentration, and thus of the electrical, thermal, and magnetic properties [106]. For example, AsF
5C
xhas a room temperature conductivity exceeding that of Cu [107]. Furthermore, several GIC are su- perconducting as for example CaC
6with a critical temperature of 11.5 K [108].
Intercalation is not restricted to graphite, but also intercalation of gases, semiconductors, or metals underneath epitaxial Gr on a substrate has become an intensively studied topic [19]. This strong interest is driven by several eects, some of which I want to illustrate:
Decoupling from the Substrate
The interaction between Gr and its supporting substrate can be modied by in- tercalation [20, 21, 109112]. For example, electronic decoupling has achieved by intercalation of H under Gr on SiC(0001) [21]. The decoupling can be utilized for an enhanced device performance in Gr transistors [112]. Chemical decoupling and thereby exfoliation of epitaxial Gr was realized by Br
2intercalation [113, 114].
Container for Chemical Reactions
Reactions occurring in a nano-sized space are often inuenced by connement eects [115]. To investigate such reactions the conned space underneath Gr on Ru(0001) or Pt(111) has been considered as a suitable container [22, 116, 117].
Protection against Oxidation
To be able to use thin epitaxial layers under ambient conditions it is important to protect them against contamination from the environment. In this context, it has been shown that an intercalated Fe layer can be eciently protected against oxidation by the covering Gr sheet [24].
Doping of Graphene
Intercalation provides a exible means to drastically modify the chemical potential
of the Dirac electrons. For the shift of the Dirac point energy E
Dwith respect to
the Fermi level E
Fa range from E
D0.8 eV by p-doping through F intercalation
[23] to E
D1.5 eV by n-doping through Eu intercalation [63] is obtained. The
span of 2.3 eV is about an order of magnitude larger than the span of 0.2 eV typically
achieved by gating of Gr [36].
2.1 Graphene
2.1.4 Magnetism and Graphene
Since C atoms do not carry magnetic moments, pristine Gr is intrinsically diamagnetic just like graphite [118]. However, motivated by the observation of room temperature ferromagnetism in proton irradiated graphite [119], it has been calculated that single-atom defects in Gr give rise to localized states at the Fermi level [120] which carry a magnetic moment on the order of 1 µ
B[121]. The moments are even larger in the presence of H or N close to the vacancies [122, 123]. The coupling between the defects depends on their distribution on the two Gr sublattices [121].
In addition to vacancies also doping of Gr with B or N can induce magnetic moments which favor ferromagnetic coupling. This makes such a material an interesting candidate for metal-free ferromagnets [124]. Furthermore, the adsorption of H [125], C [126], or N [127] is expected to lead to the occurrence of magnetic moments in Gr.
Beside such static eects Gr is also a promising material concerning spin transport due to its long spin relaxation length arising from two reasons: First, the spin-orbit coupling - originating from the interaction of the electron spin with the magnetic eld generated by the nucleus moving in the electron's rest frame - scales with the fourth power of the proton number. Therefore, it is expected to be small in the light element C [128, 129]. In addition to this relativistic eect, the electron spin interacts with the magnetic moment of the nucleus, which is known as hyperne interaction. As the dominating isotope
12C has spin zero, the hyperne interaction plays only a marginal role in Gr [130, 131]. Together with the high charge carrier mobility, the low spin-orbit and hyperne interactions cause that a spin-polarized current can travel a long distance in Gr without loosing its polarization. Experimentally, ballistic spin transport over several micrometers at room temperature [16, 132, 133] and more than 100 µ m at 2 K [134] has been reported.
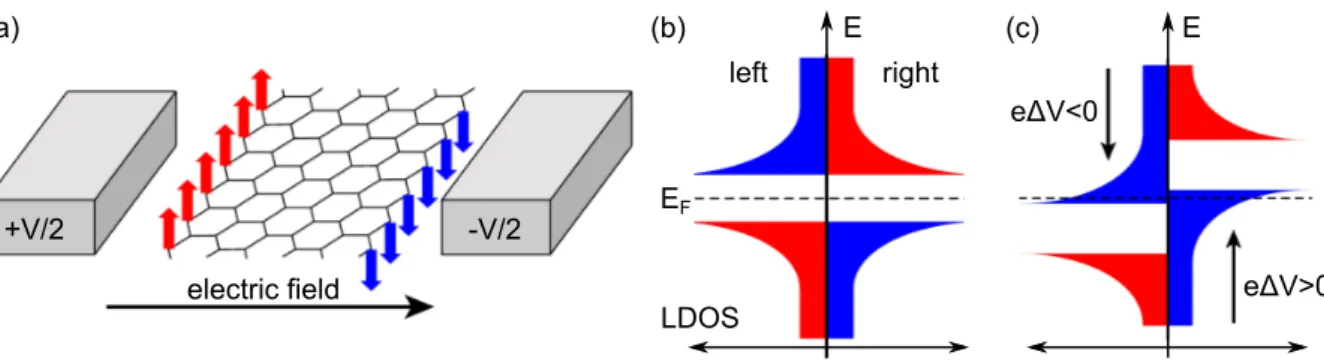
In the context of Gr based spintronic devices often nanoribbons are discussed: While armchair nanoribbons are non-magnetic, the edge states in zigzag ribbons show a magnetic order, which is ferromagnetic along the edges, and antiferromagnetic between opposite edges as shown in Fig. 2.6(a) [136]. Concerning the LDOS, this means that on both sides of the ribbon the majority and minority spins are separated by a band gap as shown in Fig. 2.6(b). As sketched in Fig. 2.6(c), when applying a transversal electrical eld the LDOS shifts on both sides of the ribbon in opposite directions [137]. In this half-metallic state, the system is metallic for one spin direction and insulating for the other one. If realized in practice, this device would oer an easy way to control spin transport.
Alternatively, Gr nanoribbons have been proposed as magnetoresistive junctions, which
are of importance as magnetic eld sensors, needed for example in read heads of hard
(a) (b)
electric field
E (c) E
E
FeΔV<0
eΔV>0
left right
+V/2 -V/2
LDOS
Figure 2.6: (a) Model for inducing half-metallicity in a zigzag nanoribbon by an electric eld.
(b) Schematic spin-resolved LDOS for the opposite edges without applied eld. (c) A eld across the ribbon selectively closes the band gap for spin down electrons. Adapted from Ref. [135].
disk drives. Such devices - conventionally built of two ferromagnets separated by a non-magnetic spacer - show a large change in electric resistance depending on the rel- ative orientation of the magnetization of the two ferromagnetic layers [138]. For a zigzag nanoribbon between two ferromagnetic contacts a high magnetoresistance ratio has been predicted [139]. Here, the low resistance state corresponds to the parallel conguration where the moments at the edges are coupled ferromagnetically (Fig. 2.7(a)), while in the antiparallel conguration a domain wall with high resistance develops (Fig. 2.7(b)).
(a) (b)
low resistance high resistance
Figure 2.7: Model for a magnetoresistive device: A zigzag nanoribbon connects two ferromag- netic contacts. The low and high resistance congurations are shown. Adapted from Ref. [135].
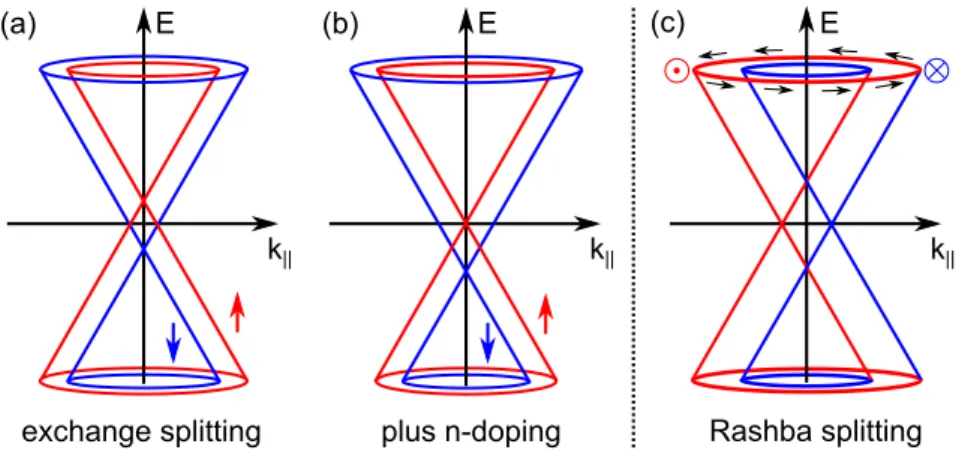
A way to achieve spin dependent transport in an extended Gr sheet is to put it in close proximity to a ferromagnetic insulator. Via the magnetic proximity eect, an exchange splitting will be induced in Gr (see Fig. 2.8(a)). In this context, EuO has been predicted as a suitable material inducing an exchange splitting of about 5 meV [140]. By appropriate doping or gating (see Fig. 2.8(b)) the Fermi level can be adjusted such that only one spin orientation contributes to the conduction.
Another way for ecient spin ltering has been proposed for multilayer Gr embedded
between two Ni(111) or Co(0001) layers. As the electronic structures of Gr and metal
2.1 Graphene
E E
k
||k
||plus n-doping Rashba splitting
(b) (c)
E
k
||exchange splitting (a)
Figure 2.8: Band structure of Gr around the K point. (a) Exchange splitting induced by the magnetic proximity eect. (b) After appropriate n-doping only the spin down channel contributes to the transport. (c) Rashba splitting induced by an electric eld.
overlap in reciprocal space only for one spin direction, perfect spin ltering can be achieved [141]. The formation of chemical bonds between Gr and metal could be prevented by intercalation of a separating Au or Cu layer.
injector spin spin
detector
ferro- magnet
off on E
v B
two-dimensional
electron gas ferro-
magnet gate
Figure 2.9: Scheme of a spin eld eect transistor. Source and drain (spin injector/detector) are ferromagnets with parallel magnetization. The injected spin-polarized electrons travel through the two-dimensional electron gas while their spins precess around the eective magnetic eld B ~ , which is tunable by the gate voltage. The current is large if the spins point at the drain in the initial direction (on), and small if the direction is reversed (o). Adapted from Ref. [14].
A splitting of the Dirac cone may not only be achieved by a magnetic, but also by an electric eld (Rashba eect [142]). As the inversion symmetry is broken perpendicular to the surface, a term in the form of an electric eld E ~ has to be added to the Hamiltonian.
As relativistic consequence, an electron moving with velocity ~ v experiences an eective
magnetic eld B ~ perpendicular to ~ v and E ~ . By spin-orbit coupling B ~ causes a momentum-
dependent splitting of the Dirac cone (see Fig. 2.8(c)). Experimentally, a large Rashba splitting has been observed for Au intercalated Gr on Ni(111) [20, 143].
The Rashba splitting can be controlled by an external electric eld [144] which opens the way to a spin eld eect transistor [14, 145]. As shown in Fig. 2.9, spins injected from a ferromagnetic layer precess around the eective magnetic eld and are detected by a second ferromagnetic layer. The spin rotation angle during the time of ight is controlled by a gate voltage. For parallel spin alignment at the detector a low resistance is achieved (on), while the resistance is high for antiparallel alignment (o). Semenov et al. proposed a similar mechanism with a ferromagnetic dielectric between Gr and gate. Here, not the Rashba interaction, but the exchange interaction with the dielectric is tuned by the gate voltage [146]. To conclude, I refer the reader to Ref. [135] for a comprehensive overview of the magnetic properties of Gr and their potential applications.
2.2 Europium
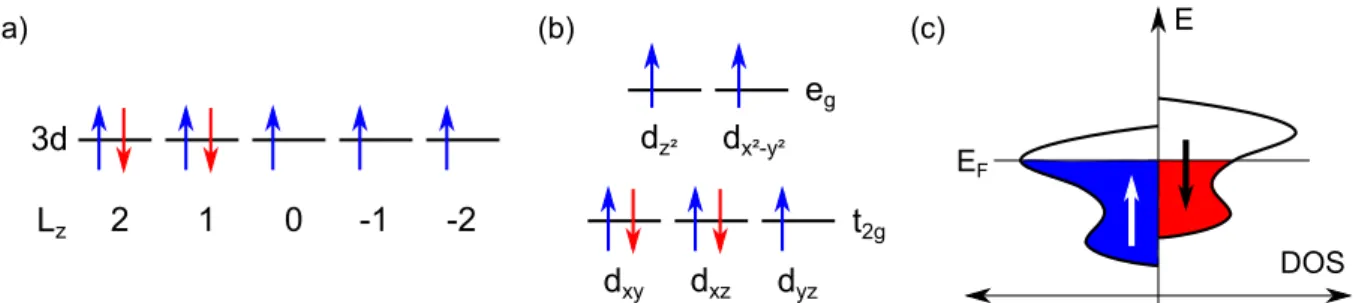
Eu is the chemical element with the atomic number 63. It is a member of the lanthanide series and therefore belongs to the rare earths. Pure Eu is a silverly, white metal and crystallizes in the bcc crystal structure with a lattice constant of 4.582 Å [147]. Eu has the ground state electron conguration [Xe]4f
76s
2. According to the Hund's rules all spins in the half-lled 4f shell are parallelly aligned resulting in a high magnetic moment of 7 µ
B. As shown by Mössbauer spectroscopy, metallic Eu is divalent such that the magnetic moment of the atom is preserved in the bulk [148].
2.2.1 Magnetism of Bulk Europium
First evidence for magnetic ordering in metallic Eu below around 90 K was found in 1960 by anomalies in the magnetic susceptibility [149], electrical resistivity [150], and later also in the heat capacity [151]. Using neutron diraction, Olsen, Nereson, and Arnold determined the order to be an antiferromagnetic helical structure [2527] as depicted in Fig. 2.10. The spins order ferromagnetically within the t 100 u planes of the bcc crystal structure, but form spirals along the x 100 y directions. Such a structure has a vanishing net magnetic moment and is therefore antiferromagnetic. There are six dierent domains (three spatial directions each with two helicities), which occur in equal proportions.
At the Néel temperature T
Nthe spiral is commensurate with a pitch of 3.5 Eu lattice con-
stants a
Eucorresponding to a turning angle of 51.4
between neighboring p 100 q planes. At
lower temperatures the periodicity of the spiral slightly increases to 3.6a
Eu(corresponding
2.2 Europium
[100]
3.5a
EuFigure 2.10: Helical spin structure of bulk Eu (commensurate phase at T
N). The upper part shows the spin arrangement on the bcc lattice. Two unit cells along the r 100 s direction are shown. For better visibility, in the lower part only one atom per p 100 q plane is depicted.
to a smaller turning angle of 50
), thus making the spin structure incommensurate with respect to the crystallographic lattice.
As for most rare earth materials, the magnetic behavior of Eu is governed by the localized 4f magnetic moments interacting indirectly with each other through the sea of delocal- ized 5d and 6s valence electrons. This type of magnetic coupling is known under the name Ruderman-Kittel-Kasuya-Yosida (RKKY) interaction [152154]. As proposed by Andersen et al., the wave vector of the spin spiral is given by a nesting vector ~k
n, i.e., a vector connecting approximately parallel sheets of the Fermi surface [155]. It can be shown that a helical array with a wave vector equal to ~k
nis the minimum energy state [156]. Using DFT calculations of the Fermi surface, the nesting vector corresponding to the experimentally observed helix pitch has been identied [157].
2.2.2 Europium Graphite Intercalation Compounds
The rst stage Eu GIC EuC
6was rst investigated in 1980 by El Makrini et al. [158]. The
samples were prepared by heating an HOPG single crystal and Eu metal under vacuum
at 723 K for 20 days. Despite the long reaction time the intercalation stayed supercial
so that only 25% of the sample were intercalated. Later experiments have shown that
the intercalation yield can be enhanced by using very small samples [159] or intercalation from a molten Li-Eu alloy [160, 161].
The crystal structure of EuC
6is depicted in Fig. 2.11(a). Using X-ray diraction, the in-plane arrangement of the Eu atoms was found to be a p ?
3 ?
3 qR 30
structure with respect to the honeycomb lattice of graphite, whereby the Eu atoms are located above the centers of the C rings. The interlayer stacking of the Eu atoms follows the hcp crystal structure. Upon intercalation the distance between two adjacent graphite layers is increased from 3.36 Å for pristine graphite to 4.87 Å [158].
a) b)
4.87Å
(i)
out-of-plane
0 10 20 30
0 1 2 3 4 5 6 7
magnetic field (T) m ag ne tizatio n pe r at om ( µ
B)
(ii)
(iii) in-plane (iv)
Figure 2.11: (a) Crystal structure of the rst stage Eu GIC EuC
6(adapted from Ref. [159]). (b) Magnetization loops at 4.2 K for a magnetic eld applied within (red) and perpendicular (blue) to the basal planes of graphite (adapted from Ref. [31]). For the in-plane eld four dierent regions of the magnetization loop are labeled with (i) - (iv).
Suematsu et al. investigated the magnetic properties of EuC
6using pulsed elds up to 40 T [162]. Two characteristic magnetization curves taken at 4.2 K are shown in Fig. 2.11(b) for an external eld applied in-plane (red) and out-of-plane (blue) with respect to the graphite layers. For an out-of-plane eld, the magnetization increases rather linear and saturates at around 30 T. In contrast, for a magnetic eld applied in-plane, the magnetization loop consists of four dierent regions which are denoted as (i) -(iv) in Fig. 2.11(b):
(i) In the initial magnetization region up to 2.2 T the magnetization steeply increases with the applied magnetic eld. A substructure of this region was reported in Ref. [159], but has not been analyzed in the subsequent literature.
(ii) The magnetization only slightly increases between 2.2 T and 8.2 T thereby forming
a broad plateau at about 2.5 µ
B.
2.2 Europium (iii) Between 8.2 T and 20.5 T the magnetization increases linearly following a line that
crosses the origin.
(iv) Above 20.5 T the magnetization saturates at a value of about 6.5 µ
B.
Such a complex magnetization behavior is indicative for the phenomenon of metamag- netism which denotes that the magnetic ordering of a material changes with the magnitude of the applied eld. From temperature dependent magnetization loops as in Fig. 2.11(b), the magnetic phase diagram shown in Fig. 2.12 has been derived [30, 31].
0 10 20 30 40 50
temperature (K) 0
5 10 15 20 25
m ag ne tic fie ld ( T )
para- magnetic
120° order ferrimagnetic canted ferromagnetic
Figure 2.12: Magnetic phase diagram of EuC
6for elds applied within the basal planes of graphite. The dierent spin arrangements are schematically depicted. Adapted from Ref. [31].
In the low eld range neighboring spins always enclose angles of 120
. This is a typical
ground state for a frustrated antiferromagnet on a triangular lattice [163]. When applying
higher elds the 120
order changes to ferrimagnetic order, i.e., two of three spins align
parallel and one antiparallel to the magnetic eld. This yields a magnetization of one third
of the value for fully aligned moments, and thus explains the plateau in the magnetization
curves. A further increase of the eld changes the spin structure to a canted spin state,
which shows a linear magnetization behavior. It was shown by magnetoresistive measure-
ments that this canted state actually consists of two slightly dierent ordering types as
shown by the dashed line in Fig. 2.12 [31]. Finally, for very high magnetic elds the order
turns to be ferromagnetic. Above a temperature of 40 K the system stays paramagnetic for all applied magnetic elds.
The magnetic interaction between the localized Eu 4f moments is dominated by RKKY interactions within the highly conductive graphite planes [30, 164]. Sakakibara et al.
showed that antiferromagnetic nearest neighbor (NN) coupling ( J
0) and ferromagnetic next nearest neighbor (NNN) coupling ( J
1) within the Eu planes, as well as a small ferromagnetic interlayer (IL) coupling ( J
1), and four-spin interactions are necessary to explain the metamagnetic behavior [165167]. Based on the resulting Hamiltonian
H J
0¸
NN
S ~
iS ~
jJ
1¸
NNN
S ~
iS ~
jJ
1¸
IL NN
S ~
iS ~
jgµ
B¸
i
S ~
iH ~ B ¸
NN
p S ~
iS ~
jq
2K ¸
4 spins
pp S ~
iS ~
jqp S ~
kS ~
lq p S ~
iS ~
lqp S ~
jS ~
kq p S ~
iS ~
kqp S ~
jS ~
lqq (2.2) Chen et al. established the dierent spin congurations of the magnetic phase diagram by Monte Carlo simulations [31]. Furthermore, the zero-eld 120
spin order was experi- mentally conrmed by muon spectroscopy [161].
2.2.3 Europium Oxide
Eu is the most reactive element of the rare earths and has several oxides [168]. Preferen- tially, the sesquioxide Eu
2O
3is formed, which is non-magnetic as it contains only Eu
3ions with J 0 . However, under limited O feed also the monoxide EuO with 2+ valency can be prepared. EuO crystallizes in the rocksalt structure with a lattice constant of 5.144 Å [47] and has an ionic character with Eu
2and O
2ions. EuO belongs to the rare class of ferromagnetic semiconductors and has a Curie temperature of T
C69 K . While the band gap is 1.1 eV above T
C[169], EuO shows upon appropriate doping a semicon- ductor to metal transition when cooling below T
C[170]. Due to its high spin polarization in the ferromagnetic state [47], EuO is an attractive material for semiconductor-based spintronic devices [171, 172]. Beside this, EuO shows further interesting eects such as a colossal magnetoresistance (CMR) eect [173], photoconductivity [174], and large magneto-optical eects [175, 176].
As the 4f
7ground state - corresponding to a pure spin moment of 7 µ
B- is spherically symmetric, the magnetic exchange interactions are isotropic. Therefore, EuO is a typical material for which the Heisenberg model with the eective Hamiltonian
H ¸
i,j