I n a u g u r a l - D i s s e r t a t i o n zur
Erlangung des Doktorgrades
der Mathematisch-Naturwissenschaftlichen Fakultät der Universität zu Köln
vorgelegt von
Roderick van der Linden aus Emmerich
Köln
2017
Berichterstatter: Prof. Dr. Joaquim G. Pinto
Prof. Dr. Yaping Shao
Prof. Dr. Andreas H. Fink
multitude of landscapes, that considerably influence the weather and climate of the country, and also affect the regional impacts of extreme events. Climatologically, more than 80% of total annual rainfall is observed in most regions of Vietnam during the rainy season, which lasts from May to October and is dominated by the southwest monsoon. On the contrary, the dry season from November to April is characterized by mainly northeasterly winds of the East Asian winter monsoon. During this season, substantial rainfall is predominantly limited to the narrow coastal plains on the eastern side of the Annamese Cordillera in central Vietnam. In these regions, rainfall is mainly related to orographic lifting and enhanced convection that is associated with periodical amplifications of the northeasterly flow.
The aim of this thesis is to investigate the role of tropical and extratropical waves in rainfall variability and extreme precipitation events in Vietnam in both seasons. In the first part, regional phases of enhanced or suppressed moist convection of large- scale tropical wave modes are determined for the rainy season in southern Vietnam.
Based on these phases, the influence of the Madden–Julian oscillation (MJO) and convectively coupled equatorial waves (CCEWs) on the modulation of daily rainfall is evaluated and quantified for the period 1979–2007. In the second part, synoptic and dynamic causes of early dry-season rainfall events in the Central Highlands region, which is Vietnam’s main coffee-growing region, are analyzed. From a station rainfall time series spanning the period 1981–2007, four dynamically different rainfall cases were selected for an in-depth investigation. The third part of this thesis consists of an analysis of the causes and predictability of a recent extreme rainfall event in northeastern Vietnam. The causes of the extreme event in July/August 2015 and its predictability are investigated using ground- and space-based observations, European Centre for Medium-Range Weather Forecasts (ECMWF) (re)analyses, and forecasts from the ECMWF ensemble prediction system.
Rainfall in Vietnam south of 16°N is significantly modulated by the MJO, and by
Abstract
ER signals occur in central Vietnam, and a pronounced influence of Kelvin waves is only discernible in the southernmost parts. The analysis also reveals that all three waves enhance the frequency of intense rainfall during wet phases, and that anomalies are significantly enhanced when wet or dry phases of the MJO occur concurrently with the respective phases of Kelvin or ER waves. In terms of thermodynamic causes of the observed rainfall modulation, at least for the MJO the depth of the moist monsoon layer and vertical wind shear are enhanced during convectively active phases. The latter provides favorable conditions for organized convection.
Although the influence of tropical waves in Vietnam is most pronounced during the rainy season, tropical waves can also cause rainfall during the early dry season in the Vietnamese Central Highlands. In two of the investigated cases, tropical waves and their interaction were the causes of substantial rainfall. Nonetheless, extratropically forced events, as in the other two cases, are more common during the northeast monsoon. Overall, the synoptic-dynamic analysis of the selected cases reveals that the spatiotemporal development of the events highly depends on interactions between large-scale tropical and extratropical wave forcing, synoptic forcing, and orographic effects.
The 2015 extreme precipitation event in northeastern Vietnam was caused by a tropical–
extratropical interaction that was not documented for this region and season before. A
surface low over the Gulf of Tonkin and northern Vietnam was related to a subtropical
upper-level trough, and caused persistent moisture flux convergence and convection
over the coast of the Quang Ninh province. Strong moisture flux into the region was
caused by an exceptionally strong and persistent monsoon depression over the Bay of
Bengal. In terms of ECMWF ensemble forecasts, predictability of the event emerged
in 72-hour lead-time forecasts, and was strongly related to the correct forecasts of
the intensity and location of the upper-level trough. To conclude, this link between
predictability and large-scale synoptic forcing, along with improved seasonal and
subseasonal forecasts of the MJO and CCEWs suggests opportunities for submonthly
forecasts of dry and wet spells in Vietnam for both seasons.
gefährden und zu wirtschaftlichen Schäden zu führen. Vietnam liegt vollständig in den Tropen und zeichnet sich durch eine Vielzahl verschiedener Landschaftsbilder aus, die das Wetter und Klima von Vietnam wesentlich beeinflussen und Einfluss auf regionale Auswirkungen von Extremereignissen nehmen. In den meisten Regionen von Vietnam fallen mehr als 80% des klimatologischen Jahresniederschlags in der durch den Südwestmonsun geprägten Regenzeit von Mai bis Oktober. Die Trockenzeit von November bis April ist im Gegensatz dazu durch vorwiegend nordöstliche Winde des ostasiatischen Wintermonsuns geprägt. Wesentliche Niederschläge sind in der Trockenzeit vorwiegend auf einen schmalen und flachen Küstenstreifen im Osten der Annamitischen Kordillere beschränkt. Die Niederschläge entstehen hauptsächlich orografisch durch Hebung an dem Gebirgszug sowie durch verstärkte Konvektion, die im Zusammenhang mit einer wiederkehrenden Verstärkung der nordöstlichen Strömung auftritt.
Das Ziel dieser Arbeit besteht darin, den Einfluss von tropischen und extratropischen
Wellen auf Niederschlagsvariabilität und Extremniederschlagsereignisse in Vietnam
während der Regen- und der Trockenzeit zu untersuchen. Im ersten Teil werden
die Phasen erhöhter oder verringerter Feuchtkonvektion von großskaligen tropis-
chen Wellenphänomen für die Regenzeit in Südvietnam bestimmt. Der Einfluss der
Madden–Julian oscillation (MJO) und der sogenannten "convectively coupled equato-
rial waves" (CCEWs) auf die Modulation von täglichen Niederschlägen wird anhand
dieser Phasen für den Zeitraum 1979–2007 bewertet und quantifiziert. Im zweiten
Teil werden synoptische und dynamische Ursachen von Niederschlagsereignissen in
Vietnams Hauptanbaugebiet von Kaffee, dem zentralen Hochland, in frühen Stadien
der Trockenzeit analysiert. Aus einer stationsbasierten Niederschlagszeitreihe für den
Zeitraum 1981–2007 wurden vier dynamisch verschiedene Niederschlagsereignisse
für eine eingehende Untersuchung ausgewählt. Den dritten Teil dieser Arbeit bildet die
Analyse der Ursachen und der Vorhersagbarkeit eines kürzlich aufgetretenen Extrem-
niederschlagsereignisses in Nordostvietnam. Die Ursachen des Extremereignisses im
Kurzzusammenfassung
for Medium-Range Weather Forecasts (ECMWF) und Vorhersagen des ECMWF Ensemblevorhersage-Systems untersucht.
Südlich von 16°N wird der Niederschlag in Vietnam signifikant durch die MJO und durch Kelvin und äquatoriale Rossby (ER)-Wellen moduliert. Der Einfluss der MJO und von ER Wellen ist am kohärentesten. Allerdings haben die ER Wellen den größten Einfluss in Zentralvietnam, während Kelvin Wellen lediglich einen Einfluss im südlich- sten Teil von Vietnam aufweisen. Die Untersuchung hat außerdem gezeigt, dass alle drei Wellen die Häufigkeit von intensiven Niederschlägen in feuchten Phasen erhöhen.
Außerdem werden die Niederschlagsanomalien durch das gemeinsame Auftreten der MJO mit Kelvin oder ER Wellen in gleichen Phasen verstärkt. Thermodynamische Ursachen für die beobachteten Niederschlagsmodulation liegen zumindest für die MJO in einer vergrößerten vertikalen Mächtigkeit der Monsunschicht und in einer ver- stärkten vertikalen Windscherung in konvektiv aktiven Phasen. Letzteres ist förderlich für das Auftreten von organisierter Konvektion.
Wenngleich der Einfluss von tropischen Wellen in Vietnam am stärksten während der Regenzeit ausgeprägt ist, können tropische Wellen auch während der Trockenzeit zu Niederschlag im zentralvietnamesischen Hochland führen. In zwei der untersuchten Ereignisse waren tropische Wellen und ihre Interaktion der Grund für Niederschlag.
Allerdings sind extratropisch gesteuerte Ereignisse wie in den anderen beiden Fällen wesentlich geläufiger während der Nordostmonsuns. Insgesamt hat die synoptisch- dynamische Untersuchung der Ereignisse gezeigt, dass der raum-zeitliche Verlauf wesentlich von der Wechselwirkung zwischen dem Einfluss von großskaligen tropis- chen und extratropischen Wellen, synoptischen Einflüssen und orografischen Effekten abhängt.
Das Extremniederschlagsereignis in Nordostvietnam im Jahr 2015 wurde durch
eine tropisch–extratropische Wechselwirkung verursacht, die für diese Region und
Jahreszeit noch nicht beschrieben wurde. Ein Tiefdruckgebiet über dem Golf von
Tonkin und Nordvietnam stand in Bezug zu einem subtropischen Höhentrog und hat
eine langanhaltende Periode von Feuchteflusskonvergenz und Konvektion über der
Küste der Quang Ninh Provinz bewirkt. Ein starker Feuchtefluss in die Region wurde
durch ein starkes und relativ stationäres tropisches Tiefdruckgebiet über dem Golf
von Bengalen hervorgerufen. Drei Tage vor Eintreten des Ereignisses zeigte sich eine
Vorhersagbarkeit in ECMWF Ensemble-Vorhersagen, die stark mit der adäquaten
Vorhersage der Intensität und Lage des Höhentroges zusammenhing. Zusammen-
3 Synoptic-Dynamic Analysis of Early Dry-Season Rainfall Events in the
Vietnamese Central Highlands 57
4 The Dynamics of an Extreme Precipitation Event in Northeastern Vietnam in 2015 and Its Predictability in the ECMWF Ensemble
Prediction System 79
5 Summary and Discussion 105
5.1 Publication 1 . . . 105
5.2 Publication 2 . . . 106
5.3 Publication 3 . . . 107
5.4 Discussion and Outlook . . . 108
References 112
Acknowledgements 123
Eigene Beteiligung an den Veröffentlichungen 125
Erklärung 127
the central part of the country. Vietnam borders China in the north, the South China Sea (SCS) in the east and south, and Cambodia and Laos in the west (Fig. 1). The topography of Vietnam is characterized by the large flood plains of the Red River and Mekong River deltas in the north and in the south, respectively, by the northern highlands that peak at more than 3100 m elevation, and by the Annamese Cordillera in northern and central Vietnam. The Annamese Cordillera, which is also known as the Truong Son Mountains in Vietnam, extends rather meridionally over about 1100 km from Laos to approximately 11°N in Vietnam and forms parts of the border between the two countries. The highest elevations of this mountain range in Vietnam peak at about 2700 m at the Lao–Vietnamese border and at about 2600 m in the Vietnamese Central Highlands. Only a narrow coastal strip is left between the mountain range and the SCS in central Vietnam.
For several social and economical reasons, the understanding of causes of weather and
climate variability in Vietnam is crucial. Rainfall is very important for the national
electricity production, because hydropower accounts for about 45% of total electricity
production (International Energy Agency 2015). Moreover, water supply by rainfall
is essential for the extensive, rainfed rice production in the Mekong River and Red
River deltas, which is mostly used for domestic consumption (U.S. Department of
Agriculture Foreign Agricultural Service 2016c). For example, a recent drought
in the southern half of Vietnam that was related to the strong 2015/2016 El Niño
event resulted in a lack of drinking water supply (about 1 million people affected)
and caused damage to large areas of paddy rice due to salt water intrusion in the
Mekong River delta (United Nations 2016). Vietnam is also the most important
producer and the leading exporter of Robusta coffee (U.S. Department of Agriculture
Foreign Agricultural Service 2016a,b), whose cultivation and yields also depend on
the availability and temporal occurrence of rainfall during the growing cycle. However,
export revenues and the economy of Vietnam nowadays rely heavily on the exports of
industrial goods (e.g., consumer electronics and textile goods; General Department
1 Introduction
Figure 1: Topography of Vietnam and adjacent countries. The dashed lines separate the eight political regions of Vietnam, namely the regions
"Northwest", "Northeast", "Red River Delta", "North Central Coast",
"South Central Coast", "Central Highlands", "Southeast", and
"Mekong River Delta" (numbers 1–8).
supply chain network (Haraguchi and Lall 2014). Therefore, extreme precipitation events in Vietnam do not only endanger the lives of people, but also bear the risk of high economic losses related to flooded and damaged infrastructures, and obstructed access to seaports. This implies that particularly the understanding of causes and predictability of rainfall variability and extreme precipitation events is essential for the population and economy of Vietnam. The present thesis will contribute to this general aim.
1.1 State of research
Mainland Vietnam is commonly divided into seven different climate regions (cf.
Nguyen et al. 2014). Except for the region that is denominated S3 by Nguyen et al.
(2014), the areas of the climate sub-regions correspond approximately to Vietnam’s
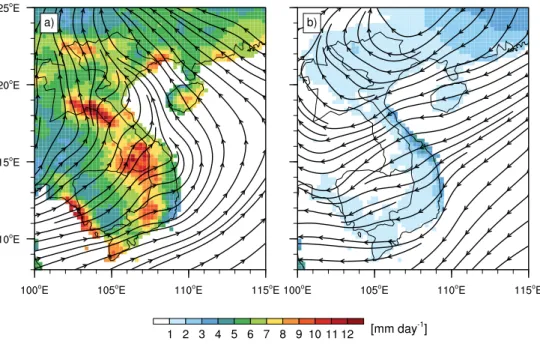
anticyclone during the rainy season. Taking the whole rainy season into consideration, the highest rainfall amounts occur at the southern tip of Vietnam and on the windward sides of the Annamese Cordillera and northern highlands (Fig. 2a). On average, the rainy season peaks in August (e.g., Yen et al. 2011; Nguyen et al. 2014) and provides at least 80% of total annual rainfall (Nguyen et al. 2014). The latter authors note that the peak of the rainy season occurs in relation to the locations of the sub-tropical ridge and the intertropical convergence zone (ITCZ). In contrast to the other regions, rather dry conditions prevail in the coastal plains on the eastward side of the Annamese Cordillera during this season (Fig. 2a; Nguyen-Le et al. 2014). This can be related to the Central Highlands acting as a weather divide and to Foehn effects on the leeward, i.e., eastward, side of the mountains.
On the contrary, when compared with the other parts of Vietnam, rainfall amounts are higher in these coastal regions during the dry season (Fig. 2b; Yen et al. 2011).
The dry season is characterized by northeasterly winds of the East Asian winter
monsoon. The northeasterly winds are associated with the semi-permanent Siberian
High that is typically centered over northern Mongolia and climatologically starts
to develop in October due to strong radiative cooling over the Eurasian continent
(e.g., Panagiotopoulos et al. 2005; Jeong et al. 2011; Nguyen et al. 2014). Previous
studies have shown that besides the Siberian High, which is located to the west of
the northeasterly flow, the Aleutian Low on the eastern side also plays an important
role (e.g., Zhang et al. 1997; Ha et al. 2012). During the winter monsoon, rainfall
at the central Vietnamese coast is related to orographic lifting at the mountains of
the Annamese Cordillera (e.g., Xie et al. 2006), and to cold surges and associated
vortices that regularly form over the SCS in October and November and affect Vietnam
while moving westward (e.g., Chen et al. 2012). Mainly in October and November,
rainfall in the Vietnamese central coast regions occasionally might also be affected by
westward-moving tropical cyclones (TCs) that originate from the northwest Pacific
1 Introduction
Figure 2: Mean daily rainfall (contours) and mean daily 10-meter wind (streamlines) for (a) the rainy seasons (i.e., May to October) and (b) the dry seasons (i.e., November to April) in the period 1979–2007.
Sources: Daily rainfall from the station-based,
0.25° × 0.25° latitude-longitude Asian Precipitation–Highly Resolved Observational Data Integration Toward Evaluation of Water
Resources (APHRODITE) Monsoon Asia V1101 product (Yatagai et al. 2012) and 10-meter wind from the 6-hourly,
0.75° × 0.75° latitude-longitude ERA-Interim reanalysis (Dee et al.
2011).
Variability of tropical convection in the intraseasonal 30–60-day period band is dom- inated by the eastward-propagating Madden–Julian oscillation (MJO; Zhang 2005).
From their analysis of station pressure and upper-air data from Canton Island in the central Pacific and station pressure data from additional stations in the tropical belt, Madden and Julian (1971, 1972) concluded that this oscillation results from large-scale zonal circulation cells that move eastward along the equator. Since the discovery of this phenomenon, research projects and field campaigns were launched (e.g., the Dynamics of the MJO (DYNAMO) campaign (Yoneyama et al. 2013) and the U.S.
Climate Variability and Predictability (CLIVAR) MJO working group (Gottschalck et al. 2010)) to investigate initiation and propagation processes (e.g., Matthews 2000;
Zhao et al. 2013; Li et al. 2015), the structure of the MJO (e.g., Sperber 2003; Kiladis
et al. 2005; Johnson and Ciesielski 2013), and the influence on tropical weather and
Regions of suppressed convection that encompass a center of enhanced large-scale convection on the eastern and western sides, are connected by the zonal circulation cells of the MJO (e.g., Zhang 2005). As the MJO approaches a certain region, it is also reflected in easterly and westerly anomalies of winds in the lower and upper troposphere, respectively (Kiladis et al. 2005). Vice versa, the latter authors showed that after the passage of the convective core of the MJO with most intense rainfall, lower-tropospheric (upper-tropospheric) wind anomalies are westerly (easterly), and rainfall is rather stratiform. The MJO is most frequently initiated over the Indian Ocean (e.g., Seo and Kim 2003), where it also exhibits the highest variance of outgoing longwave radiation (OLR
1), which was filtered in the wavenumber–frequency domain of the MJO, during boreal spring, summer, and fall (e.g., Roundy and Frank 2004). In general, the MJO influences tropical convection all year round; however, the strongest influence moves from 5–10°S in the Indian Ocean and western Pacific during boreal winter to 5–10°N in the SCS during boreal summer (Zhang and Dong 2004). For Vietnam, previous studies have shown that the MJO does not only modulate convective activity in the south during the rainy season (e.g., Yokoi et al. 2007), but can also contribute to extreme events at the central coast of Vietnam in the late rainy season (Wu et al. 2012). Moreover, Straub et al. (2006) and Tong et al. (2009) have shown that the MJO can also affect the onset of the SCS summer monsoon.
In the case described by Straub et al. (2006), a convectively coupled Kelvin wave also played a role in the SCS summer monsoon onset. Kelvin waves are a special solution of the shallow water equations on an equatorial beta plane; namely, in the derivation of this solution it is assumed that the meridional wind is zero (e.g., Kiladis
1
OLR is frequently used as a proxy for deep convection in the tropics (e.g., Arkin and Ardanuy
1989, and references therein). Longwave radiation that is emitted from the surface or cloud tops is
1 Introduction
et al. 2009). Generally, the solutions of the shallow water equations, which were first derived by Matsuno (1966), provide a relation between frequency and planetary zonal wavenumber for each meridional mode number n and describe the horizontal dispersion characteristics (Kiladis et al. 2009). Besides eastward-propagating Kelvin waves, additional solutions of the shallow water equations correspond to the eastward- propagating eastward inertio-gravity (EIG) waves, and the westward-propagating equatorial Rossby (ER), mixed Rossby-gravity (MRG) and westward inertio-gravity (WIG) waves. Concerning the horizontal structures in relation to the equator, a differentiation is also made between symmetric (Kelvin, n = 1 ER, n = 1 EIG, and n = 1 WIG) and antisymmetric (n = 0 EIG, MRG, n = 2 EIG, and n = 2 WIG) waves.
In the derivation, all waves are considered to be "dry" waves, which means that it is assumed that the waves do not release latent heat by the formation of clouds and by precipitation (Wheeler and Kiladis 1999).
Using space-time spectral analyses of brightness temperature, which is another proxy for deep convection, and OLR in the global tropics between 15°S and 15°N, Takayabu (1994) and Wheeler and Kiladis (1999) found that spectral peaks in the wavenumber- frequency domain occur along the dispersion curves of the equatorially-trapped dry waves from Matsuno’s (1966) theory. Therefore, these waves that account for a large fraction of tropical rainfall variability (e.g., Kiladis et al. 2009) are frequently referred to as convectively coupled equatorial waves (CCEWs). Yasunaga and Mapes (2012) have demonstrated that CCEWs modulate satellite-derived precipitation estimates in the tropics over a wide range of temporal and spatial scales. They have shown that ER and MRG waves rather influence scattered convection and small-scale precipi- tation systems, while Kelvin and inertio-gravity (i.e., EIG and WIG) waves exhibit a stronger influence on mesoscale convective systems and stratiform rain. Like the MJO, Kelvin and ER waves also influence tropical cyclogenesis, e.g, in the Atlantic and western Pacific ocean basins (e.g., Kiladis et al. 2009; Schreck and Molinari 2011;
Ventrice et al. 2012; Schreck 2015). Previous studies have also shown that multiple
tropical waves can occur concurrently and interact (e.g., Straub and Kiladis 2003; Ma-
sunaga 2007; Roundy 2008; Masunaga 2009; Yasunaga and Mapes 2012). Although
they are no solution of the shallow water equations, easterly waves exhibit spectral
peaks in the wavenumber-frequency analysis (e.g., Roundy and Frank 2004) and are
therefore also referred to as a CCEW. Easterly waves are frequently also denoted as
tropical depression–type disturbance. Kiladis et al. (2009) noted that easterly waves
predominantly occur over the Pacific, the Atlantic, and sub-Saharan Africa and during
seasonal analyses of the variances of space-time filtered OLR and precipitation by, e.g., Wheeler and Kiladis (1999), Roundy and Frank (2004), and Lubis and Jacobi (2015). However, these studies suggest that Kelvin wave activity is rather limited to the equator and therefore mainly affects the southernmost parts of Vietnam, and that ER waves exhibit the strongest influence at the central Vietnamese coast. The latter is corroborated by the findings of Yokoi et al. (2007), who analyzed intraseasonal variations of rainfall over the Indochina Peninsula in the temporal domains of the MJO and ER waves.
Besides tropical waves, extratropical planetary-scale Rossby waves can also influence rainfall in the tropics (e.g., Kiladis and Weickmann 1992). Due to barotropic and baro- clinic instabilities, the west to east oriented polar jet stream meanders in north–south direction, which is reflected in sequences of troughs and ridges that propagate eastward (Stull 2015). These sequences are referred to as Rossby waves (after Rossby and Col- laborators 1939) and typically exhibit four to six meanders of the jet stream. Rossby waves exhibit an influence on the genesis of extratropical cyclones (Stull 2015), whose cold fronts occasionally can reach the tropics but then frequently are better described as shear lines, because the temperature gradient along the frontal zone disappears (Schultz et al. 1997). Besides the influence on extratropical cyclones, Takaya and Nakamura (2005) demonstrated that the extratropical Rossby wave train can also cause an amplification of the Siberian High. Closely related with this semi-permanent high, amplifications of northeasterly winds, which are referred to as cold surges, regularly occur over the SCS during the winter monsoon and enhance convection over the SCS and the Maritime Continent (e.g., Zhang et al. 1997; Chang et al. 2005; Takaya and Nakamura 2005; Park et al. 2011). Previous studies have also shown that the formation of Borneo Vortices that further enhance convection in the Maritime Continent can be associated with cold surges (e.g., Chang et al. 2005; Ooi et al. 2011; Koseki et al.
2014). Generally, mid-latitude influences over the SCS and adjacent countries have
1 Introduction
1.2 Objectives
The general aim of this thesis is to investigate the influence of tropical and extratropical waves on rainfall variability and extreme events in Vietnam. More specifically, ground- based measurements, measurements from remote sensing instruments aboard satellites, (re)analyses, and/or probabilistic forecasts are employed to focus on three different aspects:
1. Since large-scale tropical waves potentially influence rainfall variability in southern Vietnam, tropical waves that significantly modulate daily rainfall in southern Vietnam were identified, and the rainfall-modulating influence of the most relevant waves was quantified. Additionally, the effect of concurrence of the combination of two waves was examined.
2. Substantial rainfall in November–December negatively impacts yields and qual- ity of the coffee harvest in the Vietnamese Central Highlands, which is the main coffee-growing region in Vietnam. Therefore, different cases that led to rainfall during the early dry season in the Central Highlands region were identified, and the synoptic-dynamic causes of the events were investigated.
3. In July–August 2015, an extreme precipitation event hit northeastern Vietnam and led to flooding. For this extreme event, the temporal development, the dynamical causes, and the predictability of extreme rainfall in ensemble forecasts were analyzed.
These three aspects are discussed in the publications that are presented in the following
sections 2, 3, and 4. In section 5, a summary of the findings is provided and the results
are discussed.
van der Linden, R., A. H. Fink, J. G. Pinto, T. Phan-Van, and G. N. Kiladis, 2016:
Modulation of Daily Rainfall in Southern Vietnam by the Madden–Julian Oscil- lation and Convectively Coupled Equatorial Waves. J. Climate, 29, 5801–5820, doi:10.1175/JCLI-D-15-0911.1.
c American Meteorological Society. Used with permission.
Institute of Meteorology and Climate Research, Karlsruhe Institute of Technology, Karlsruhe, Germany
J
OAQUIMG. P
INTODepartment of Meteorology, University of Reading, Reading, United Kingdom, and Institute for Geophysics and Meteorology, University of Cologne, Cologne, Germany
T
ANP
HAN-V
ANDepartment of Meteorology, Hanoi University of Science, Vietnam National University, Hanoi, Vietnam
G
EORGEN. K
ILADISPhysical Sciences Division, NOAA/Earth System Research Laboratory, Boulder, Colorado
(Manuscript received 21 December 2015, in final form 6 May 2016) ABSTRACT
Rainfall extremes have a large socioeconomic relevance for southern Vietnam. More than 30 million people live in this low-lying, flood-prone region in Southeast Asia. In this study the influence of the Madden–Julian oscillation (MJO) and convectively coupled equatorial waves on the modulation of daily rainfall during the rainy season (May–October) is evaluated and quantified using an extensive station database and the gridded Asian Precipitation–Highly Resolved Observational Data Integration Toward Evaluation of Water Re- sources (APHRODITE) product for different phases of the equatorial waves.
The MJO, Kelvin, and equatorial Rossby (ER) waves significantly modulate daily rainfall in Vietnam south of 168N. The MJO shows the most coherent signals across the region, followed by ER waves, whose influence is strongest in central Vietnam; Kelvin waves only affect the southern parts of Vietnam. For all waves, the frequency of occurrence of intense daily rainfall larger than 25 mm is significantly enhanced during wet phases, whereas the magnitude of rainfall anomalies is related to the wave’s amplitude only in the MJO and ER cases. A novel wave interference diagram reveals strong positive interferences of dry and wet anomalies when the MJO occurs concurrently with Kelvin and ER waves. In terms of causes of rainfall anomalies, the waves modulate tropospheric moisture convergence over the region, but a strong influence on the depth of the monsoon flow and the vertical wind shear is discernible from radiosonde data only for the MJO. The results suggest new opportunities for submonthly prediction of dry and wet spells in Indochina.
1. Introduction
Vietnam is located at the eastern side of the Indo- china Peninsula bordering the South China Sea (SCS) and is characterized by a 1650-km north–south exten- sion from the Tropic of Cancer (about 23.258N) to the deep tropics at around 8.58N. While mountain land- scapes are found at the northern border with China and in central Vietnam, parts of northern and southern
Supplemental information related to this paper is avail- able at the Journals Online website: http://dx.doi.org/10.1175/
JCLI-D-15-0911.s1.
Corresponding author address: Roderick van der Linden, In- stitute for Geophysics and Meteorology, University of Cologne, Pohligstr. 3, 50969 Cologne, Germany.
E-mail: rvdlinde@uni-koeln.de
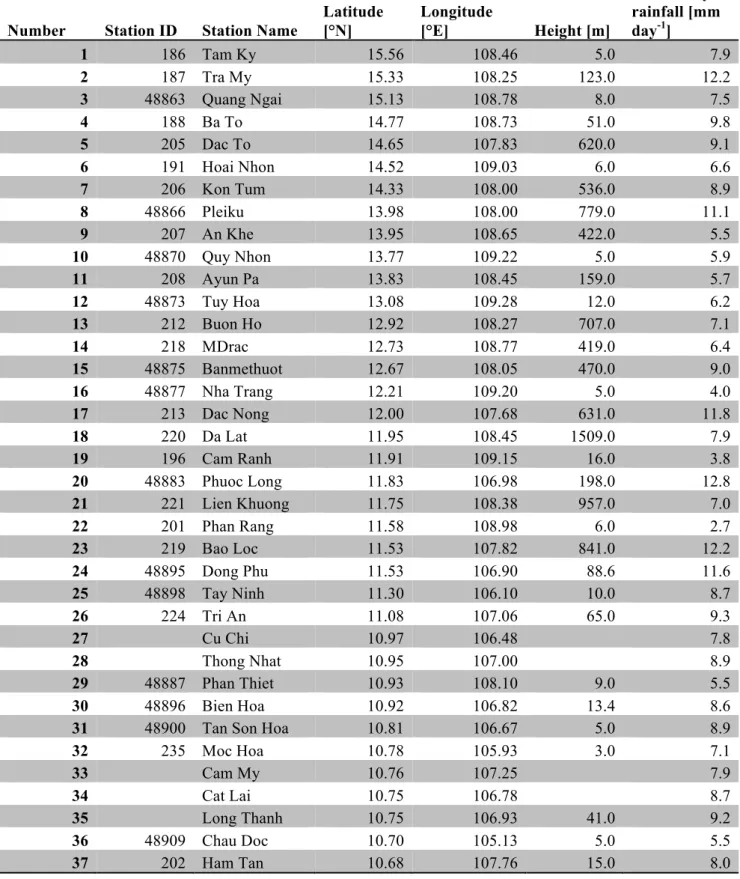
Vietnam are characterized by the extensive and heavily populated floodplains and deltas of the Red and Me- kong Rivers. The present study focuses on the southern part of Vietnam (south of 16 8 N), comprising the Viet- namese Central Highlands and the Mekong River delta region (Fig. 1). Because of its geographic location, the seasonal climate of Vietnam is dominated by the Indo- Asian monsoon system (Wang 2006). Except in the South Central Coast region (Fig. 1), where a boreal fall rainfall maximum is observed, the remaining part of the study region has a rainy season between May and Oc- tober, peaking in August (Yen et al. 2011; Nguyen et al.
2014). The rainy season provides more than 80% of annual rainfall in the study region (Nguyen et al. 2014).
While the Mekong delta is one of the two major rice- growing regions of Vietnam and a hot spot of aqua- culture production, the central highland is the main coffee growing region in Vietnam (General Statistics Office of Vietnam 2016). Given the agricultural prac- tices, forecasting of the rainy season onset and of dry and wet spells within the monsoon season has a clear socioeconomic value. This potential value increased in recent years, since rainfall extremes during the mon- soon increasingly endanger existing and planned in- dustrial zones in the low-lying, flood-prone areas of southern Vietnam (Asian Development Bank 2010), which has a population of more than 32 million. Finally, Vietnam’s power supply relies heavily on hydroelec- tricity (U.S. Energy Information Administration 2015).
Predictability of monsoonal dry and wet spells on weekly time scales in Vietnam is potentially related to the Madden–Julian oscillation (MJO; Madden and Julian 1971, 1972) and convectively coupled equatorial waves (CCEWs; Kiladis et al. 2009). The MJO and CCEWs are well-known phenomena that account for large fractions of intraseasonal and synoptic-scale tropical convective and rainfall variability (Zhang 2005; Kiladis et al. 2009, and references therein). For the region under study, Straub et al. (2006) and Tong et al.
(2009) showed that Kelvin waves, which are one im- portant type of CCEW, along with the MJO, also impact the onset of the SCS summer monsoon. The practical forecast limits of the MJO have recently been pushed to about two weeks (Zhang and van den Dool 2012; Saha et al. 2014). To exploit this predictability, the impact of convectively active and wet phases of the MJO and CCEWs on daily rainfall variability at regional scales needs to be quantified and understood. To describe the wave-related in situ rainfall variability and impact on surface hydrology, multidecadal time series from dense rain gauge network data or gridded products derived from these datasets are the preferred source, though such datasets are rare in the tropics. Nonetheless, some
studies identified an influence of the MJO on regional rainfall based on rain gauge measurements: Wheeler and Hendon (2004) found an increase in the probability of extreme rainfall in Australia during convectively ac- tive phases of the MJO, Matthews and Li (2005) de- tected spatially coherent rainfall anomalies in the western Pacific during dry and wet phases of the MJO, and Pohl and Camberlin (2006) provided evidence of the influence of the MJO on rainfall in Kenya and northern Tanzania. As another example, Pohl et al. (2009) in- vestigated the influence of the MJO on rainfall in West Africa and found an asymmetric response in the western Sahel, with the convectively suppressed phase showing a stronger signal in the rain gauge data.
In addition to these statistical relationships, it is necessary to understand how the phases of the MJO and CCEWs change the (thermo-)dynamic environ- ment that favors certain types of convective systems.
Yasunaga and Mapes (2012) have shown that the in- fluences of the MJO and CCEWs occur on different spatial and temporal scales, from scattered convection
FIG. 1. Topographic map of the study area. Names denote dif- ferent regions of Vietnam, which are separated with dashed lines.
Rainfall stations used in the analysis are indicated with red dots.
The green squares show the locations of the rainfall and radiosonde station in Ho Chi Minh City (Southeast) and of the radiosonde station in Da Nang (South Central Coast).
5802
J O U R N A L O F C L I M A T E VOLUME29and rotational waves. The region under study is strongly influenced by propagating organized mesoscale con- vective systems (MCSs) during boreal summer (Roca et al. 2014; Houze et al. 2015). The former study found, for example, that the fraction of rainfall from MCSs propagating more than 250 km exceeds 50% over the Indochina Peninsula. Thus, it seems obvious to study the MJO- and CCEW-related changes to the synoptic-scale environment in which the MCSs form.
While Wheeler and Kiladis (1999) focused on South- ern and Northern Hemisphere summer seasons, Roundy and Frank (2004a) showed the importance of different waves relative to the overall regional variability of convection for all four seasons. To demonstrate their importance, the latter authors created climatologies of wave-filtered variances for a 10-yr period by application of wavenumber–frequency filters to outgoing longwave radiation (OLR) and precipitable water data in the space–time domains of several CCEWs. They found that the relative contributions of eastward-propagating parts of the intraseasonal oscillation, which includes the MJO, and westward-propagating ER waves are more pro- nounced over the global tropics than other modes. They also stress that waves interact with and suppress or en- hance regional convection, instead of exclusively forcing convective signals to follow their large-scale divergence patterns. Several studies have demonstrated that dif- ferent wave modes do not necessarily occur in isolation but can occur concurrently and also interact (e.g., Straub and Kiladis 2003; Masunaga 2007; Roundy 2008;
Masunaga 2009). Yasunaga and Mapes (2012) found that the activity of the (in their notation) divergent waves is enhanced in the developing phase of the MJO, whereas an enhancement of the activity of rotational waves preferentially occurs in the decaying phase of the MJO.
In addition to studies with a global perspective on tropical wave activity (e.g., Wheeler et al. 2000; Lubis and Jacobi 2015), several studies focused on the Mari- time Continent and western Pacific regions. However,
over southern Vietnam during the rainy seasons from May to October 1979–2012 is investigated and quanti- fied for the first time using an extensive database of rain gauge measurements and gridded datasets. This includes the effects of wave interference and phase-dependent changes of the waves to the synoptic-scale (thermo-) dynamic environment. Data and methods are described in section 2. The modulating influence of the MJO and CCEWs on rainfall and dynamical fields in southern Vietnam is discussed in section 3. The results are sum- marized and discussed in section 4.
2. Data and methods
Satellite-observed OLR is frequently used as a proxy for deep convection in the tropics (e.g., Arkin and Ardanuy 1989, and references therein) and, more spe- cifically, for the detection of tropical intraseasonal var- iability of convection (e.g., Wheeler and Kiladis 1999).
Therefore, tropical wave activity was analyzed in this study for the period 1979–2012 using 2.58 3 2.58 daily NOAA Interpolated OLR data (Liebmann and Smith 1996). To quantify the rainfall-modulating effects of the MJO and CCEWs, daily rainfall data from the gridded Asian Precipitation–Highly Resolved Observational Data Integration Toward Evaluation of Water Re- sources (APHRODITE) Monsoon Asia V1101 dataset (Yatagai et al. 2012) were used for the period 1979–2007.
APHRODITE data are available in 0.258 3 0.258 hori-
zontal resolution and are based on rain gauge mea-
surements. In addition, daily rainfall measurements from
stations operated by the Vietnamese National Hydro-
Meteorological Service (NHMS; NHMS 2014, un-
published data) for the period 1979–2012 were analyzed
(Fig. 1, Table S1). Only stations south of 168N and with at
least 90% data availability were considered. The accu-
mulation period of daily APHRODITE and station data is
1200–1200 UTC [i.e., 1900–1900 local time (LT)]. Even
though APHRODITE used station data, gridding in-
evitably causes smoothing of extremes; thus, the analysis
of the dense station network has two advantages: (i) in situ observations preserve topographic rainfall gra- dients (cf. supplemental material); and (ii) absolute threshold-based extreme value statistics can be applied.
Moreover, it is very likely that some stations have not entered the APHRODITE analysis. The waves’ effects on the dynamical fields were quantified using horizontal wind components on the 850-hPa pressure level from the 6-hourly ERA-Interim at 0.758 3 0.758 latitude–longitude resolution (Dee et al. 2011). Daily values were calcu- lated by averaging over 0000, 0600, 1200, and 1800 UTC analysis times. Additionally, vertical profiles of the atmosphere from the Integrated Global Radiosonde Archive (IGRA; Durre et al. 2006) for the stations Ho Chi Minh City (WMO station ID 48900; 10849
0N, 106840
0E) and Da Nang (WMO station ID 48855;
1682
0N, 108811
0E) were analyzed for the period 1979–
2012. For the analysis, zonal and meridional wind com- ponents from IGRA were linearly interpolated to every 50 hPa between the 1000- and 100-hPa pressure levels, and specific humidity was calculated from vertically in- terpolated temperatures and dewpoint temperatures.
Only 0000 UTC (0700 LT) profiles were used to avoid impacts on low-level wind profiles by turbulence in the daytime boundary layer. Radiosonde data were avail- able for about 45%–57% of all wave cases, depending on the radiosonde station and the wave phase. The ECMWF four-dimensional variational data assimilation (4D-Var) system assimilates radiosonde wind and hu- midity data when available. However, when compared to ERA-Interim-derived profiles, the radiosonde pro- files are in situ measurements, and effects of data as- similation or dates with missing radiosonde data are excluded.
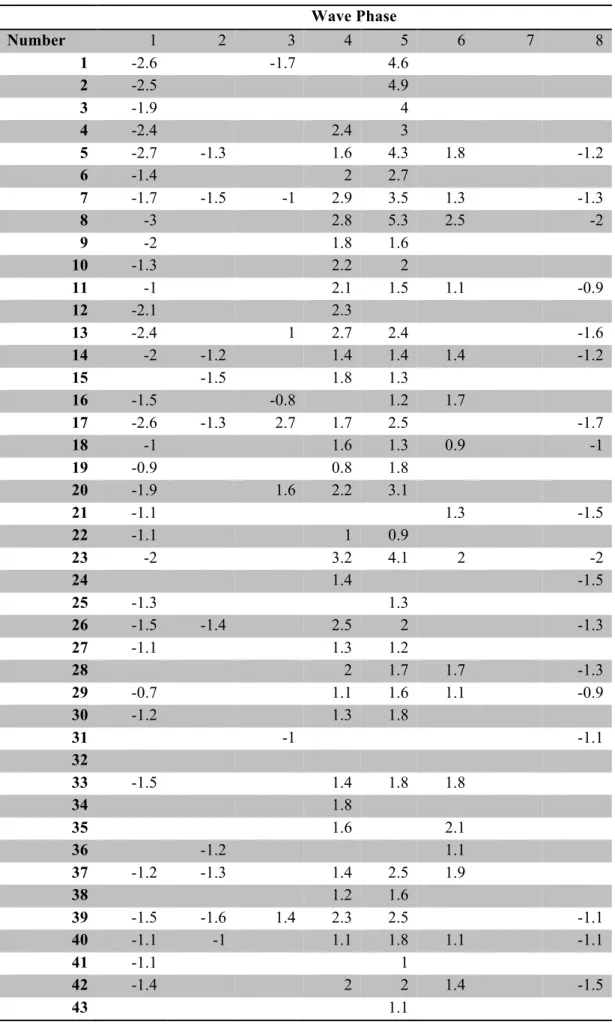
There are various approaches for the global de- termination of MJO phases based on circulation-only indices [velocity potential MJO (VPM) index (Ventrice et al. 2013)], circulation and convection indices [real- time multivariate MJO (RMM) index (Wheeler and Hendon 2004)], or convection-only indices [OLR-based MJO index (OMI) (Kiladis et al. 2014)]. However, for consistency reasons and to investigate the effects of concurrent occurrences of convectively active phases of multiple waves, different phases of tropical wave activity were determined regionally following the method orig- inally proposed by Riley et al. (2011) to determine the MJO phases. Yasunaga and Mapes (2012) applied this method to TRMM data to determine the phases and amplitudes of the MJO and CCEWs. Here, the method was applied to OLR data averaged between 7.58 and 12.58N; the longitude for which the phases were de- termined was 107.58E. The method is exemplified for the MJO in Fig. 2. The time series of standardized
wave-filtered OLR and its standardized temporal change (tendency) centered at 107.58E are calculated for May–
October 1984 to construct the phase diagram in Fig. 2c.
The time series for both quantities can be inferred from the rectangles at 107.58E in the Hovmöller diagrams of Figs. 2a and 2b. The color filling of the circles in Fig. 2c corresponds to the color coding of the standardized wave-filtered OLR in Fig. 2a; positive values (red markers) indicate that regional convection is suppressed by the equatorial wave, whereas negative values (blue markers) indicate regionally enhanced convection. In Fig. 2c, one complete cycle of the MJO is highlighted; it starts with phase 7 and passes first through phases of suppressed convection and then through phases of en- hanced convection in clockwise direction. Note that the starting and end points of this complete MJO cycle are marked with green markers and that values outside the highlighted period and region are shown in grayscale.
In terms of the interpretation of the phase diagram, phase 1 is the driest phase, since standardized wave- filtered OLR is at maximum, and its tendency is small or changing from positive to negative. Vice versa, phase 5 is the wettest phase, since standardized wave-filtered OLR is at minimum, and its tendency is small or changing from negative to positive. In phases 3 and 7, the sign of standardized wave-filtered OLR changes from positive to negative and back from negative to positive, re- spectively. Hence, these phases are in the following re- ferred to as transition phases. The amplitude of waves is the distance from the origin of the phase diagram. Only waves with amplitudes greater than one (i.e., only circles outside the gray-shaded unity circle in Fig. 2c) are con- sidered. OLR data were filtered in the wavenumber–
frequency domains of the MJO and two types of CCEWs—namely, Kelvin waves and n 5 1 ER waves—
by using the canonical wavenumber–frequency filter after Wheeler and Kiladis (1999). Potential effects of Doppler shifting by the basic-state zonal flow are deemed to be relatively small over the region (Dias and Kiladis 2014) and are already taken into account by fil- tering for the observed spectral peaks of the selected wavenumber–frequency domains. In the following, n 5 1 ER waves are referred to as ER waves.
Note that MJO phases obtained from the VPM, RMM, and OMI indices assign convectively active re- gions on the globe, whereas the method of Riley et al.
(2011) defines phases locally (i.e., phases from global and regional methods are not equivalent). However, during May–October, during 84%–99% of days when amplitudes of global and regional indices are concur- rently greater than one, the regional index is in phases 3–7 (i.e., wet phases 4–6 and transition phases 3 and 7) when the global indices are in phases 4–6 (i.e., the
5804
J O U R N A L O F C L I M A T E VOLUME29convective envelope of the MJO is located in the Maritime Continent and western Pacific regions). Even though the commonly used latitude sector for wavenumber–frequency filtering is 158S–158N (e.g., Wheeler and Kiladis 1999), 7.58–12.58N was chosen here to enhance the focus on southern Vietnam. A comparison of phases with amplitudes greater than one determined for both sectors showed an agreement of more than 80% of phases with a maximum of one phase difference for the period May to October (not shown), thus justifying the use of the 7.5 8 –12.5 8 N sector.
Daily time series of wave phases and amplitudes were then used to calculate composite anomalies of rainfall and horizontal wind components for each wave phase.
In these composites, any influence of other wave types that occur on the same days with an amplitude greater than one has not been filtered out. Daily anomalies of wind components were calculated from a daily
climatology, whereas daily rainfall anomalies were cal- culated relative to the average daily rainfall in the pen- tad centered about the date of a certain phase. The statistical significance of anomalies was tested with the distribution-independent bootstrap method with 10 000 samples. Note that the statistical significance of wind vectors was only tested for the zonal wind component, because the zonal wind exhibits stronger anomalies when compared with the meridional wind component.
Anomalies significant at the 5% level are highlighted.
Hereafter, the notations ‘‘statistically significant’’ and
‘‘significant’’ are used interchangeably.
3. Modulation of rainfall by large-scale equatorial waves
Visual inspection of regional power spectra after Dias and Kiladis (2014) centered about 908E suggests that the
FIG. 2. Illustration of the method to determine the local phase of the MJO or any CCEW proposed byYasunaga and Mapes (2012). (a) Standardized wave-filtered OLR, (b) tendency of standardized wave-filtered OLR, and (c) phase diagram constructed from (a) and (b). The example is based on MJO-filtered OLR that was averaged between 7.58and 12.58N for May–
October 1984. The local phase is determined for the longitude 107.58E centered on Vietnam, as indicated by the rectangle. The color bar shows standardized values (no units). Color filling of the circles in (c) corresponds to the color coding of the standardized wave-filtered OLR in the rectangle of (a). For more details, seesection 2.
most relevant CCEWs in southern Vietnam are Kelvin and ER waves. This assumption is corroborated by wavenumber–frequency-filtered OLR variances by Wheeler and Kiladis (1999) and Roundy and Frank (2004a). These studies, together with Zhang and Dong (2004) and Fig. 3 also stress the relevance of the MJO for intraseasonal rainfall variability in southern Vietnam.
Filtering for higher-frequency waves—namely, n 5 1 and n 5 2 westward inertio-gravity (WIG) waves—was not feasible because of the use of daily OLR values.
However, Wheeler and Kiladis (1999) have shown that WIG waves are mostly constrained to regions closer to the equator, and regional power spectra of Dias and Kiladis (2014) indicate that WIG waves do not play a dominant role in the longitude sector centered about 90 8 E. In addition, influence of MRG and eastward inertio-gravity (EIG) waves was tested but found to be weak in southern Vietnam (not shown). This is consis- tent with recent findings of Kiladis et al. (2016) and Dias and Kiladis (2016), who showed that convectively cou- pled MRG and EIG waves occur predominantly in the
western/central Pacific Ocean. In the following sub- sections, the impact of each type of the relevant waves on rainfall in southern Vietnam is discussed. Wave phases 4–6 (1–2 and 8) are termed wet (dry) phases throughout all types of waves discussed, because in, for example, wave-filtered OLR maps, large-scale regions of enhanced (suppressed) deep convection are discern- ible in the equatorial belt during these phases. Phases 3 and 7 are termed transitional phases, the former from dry to wet, the latter from wet to dry.
a. Madden–Julian oscillation
The highest MJO-filtered OLR daily variance (here- after simply referred to as variance) in the Indian Ocean and western Pacific regions during May to October oc- curs over the Indian Ocean (Fig. 3a), where the MJO is most frequently initiated (e.g., Seo and Kim 2003; Zhang 2005). The extension of high-variance values south and southwestward of India can be attributed to the seasonal transition: namely, a northward movement of the MJO between boreal spring and boreal summer [cf. seasonal
FIG. 3. Wave-filtered daily OLR variance for (a) the Madden–Julian oscillation, (b) Kelvin waves, and (c) equatorial Rossby waves during May–October.
5806
J O U R N A L O F C L I M A T E VOLUME29OLR variances in Roundy and Frank (2004a)]. In Vietnam, the highest variance occurs at the southern tip of the country and exhibits a strong northward decrease.
However, it is only about half of the MJO variance ob- served in the peak region in the southern Bay of Bengal.
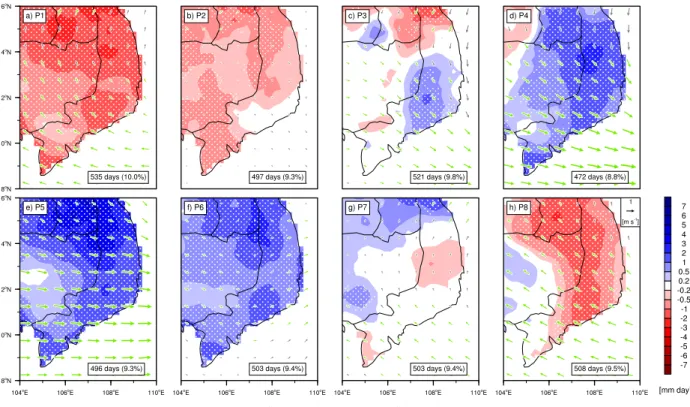
The MJO exhibits the strongest signals in rainfall and low-level wind anomalies (Figs. 4, 5, 6a) when compared with the other waves considered here. Figures 4 and 5 show for each of the eight MJO phases the variation of APHRODITE and station rainfall anomalies, re- spectively, which are overlaid with 850-hPa vector wind anomalies. Figure 6 shows phase-dependent rainfall anomalies along a south–north station transect. Gener- ally, there is a good agreement between APHRODITE and station data when comparing rainfall anomalies from both datasets for the MJO (cf. Figs. 4, 5), which points to a regional-scale and coherent influence of the MJO. Considering all dry phases, statistically significant APHRODITE anomalies are most widespread in phase 2 over southern Vietnam and adjacent regions (cf.
Figs. 4a, 4b, and 4h). This distinction of phase 2 relative to the other dry phases can also be observed for station anomalies (cf. Figs. 5a, 5b, and 5h). There are only four stations in that phase (located at the coast and mostly north of approximately 12 8 N), which show non- significant rainfall anomalies (Figs. 5b, 6a, Table S2).
During dry phases, station rainfall is suppressed by about 20%–27% in relation to the long-term mean daily rainfall (cf. Figs. 5 and S1, Tables S1 and S2). In phase 3, rainfall anomalies are still predominantly negative (Figs. 5c, 6a). However, especially for station measure- ments, anomalies are no longer significant at some lo- cations in this phase. Phases 1–4 show 850-hPa easterly wind anomalies (Figs. 5a–d). In these phases, wind anomalies on the western side of the Annamese Cor- dillera (Fig. 1), also denominated the Truong Son Mountains in Vietnam, are generally weaker yet sig- nificant. The strongest easterly wind anomalies occur in phase 3 and are most pronounced toward the south (Fig. 5c).
In phase 4, rainfall anomalies have turned from neg- ative to positive south of about 13.5 8 N (Figs. 4d, 5d), and in phase 5 the whole region shows significant positive rainfall anomalies of up to 6 mm day
21(Figs. 4e, 5e, 6a).
On average, anomalies during wet MJO phases corre- spond to an increase of approximately 22%–34% in relation to the long-term mean daily station rainfall (cf.
Figs. 5 and S1, Tables S1 and S2). The northward ex- tension of rainfall anomalies is in agreement with the northward propagation of the MJO by interaction with the Maritime Continent, as demonstrated, for example, by Zhu et al. (2010). Additionally, the moist monsoon
FIG. 4. Anomalies of APHRODITE rainfall (colors) and ERA-Interim 850-hPa wind (vectors) per phase of the Madden–Julian os- cillation (P1–P8) during May–October. Stippled areas and green vectors indicate statistically significant anomalies. The numbers in the bottom-right corners indicate the frequency of days with amplitude greater than one in a certain phase. (h) The reference vector for ERA- Interim wind.
layer has already started to deepen in phase 4, as can be seen from deepening low-level westerlies in the com- posite vertical profile from Ho Chi Minh City (Fig. 7a).
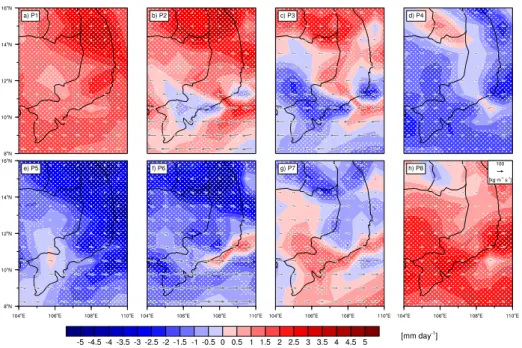
From phase 4 to 5, 850-hPa anomalous winds in southern Vietnam turn from significantly easterly to westerly and stay westerly in phases 6–8 (Figs. 5e–h). As expected, vectors of moisture flux between the surface and 500 hPa show a similar turn (Fig. S2). However, significant con- vergence of moisture fluxes in this layer, which contains nearly 90% of the columnar moisture, already starts in phase 3 during weakening easterly anomalies. The highest positive rainfall anomalies occur in phase 6 es- pecially on the windward side of the Annamese Cor- dillera from about 13 8 N northward and also reach up to about 6 mm day
21(Figs. 4f, 5f). A similar but slightly weaker effect is also discernible in phases 5, 7, and 8.
Thus, low-level westerly wind anomalies associated with the MJO seem to enhance orographic rainfall on the windward side of the Annamese Cordillera, whereas easterly anomalies do not show orographically en- hanced rainfall on its eastern side. This finding is related to the fact that the total flow across the mountains re- mains westerly in all phases. While rainfall anomalies are predominantly negative in phase 3, anomalies are
mostly positive in transition phase 7, although anomalies are not all statistically significant (Figs. 4g, 5g, 6a). As a consequence, moisture flux convergence anomalies seem to lead rainfall anomalies by about one phase be- cause southern Vietnam is already dominated by sig- nificant moisture flux divergence anomalies in phase 7 (Fig. S2). Overall, the frequency of occurrence of dif- ferent phases, as indicated in the inset boxes in the bottom-right corners of the panels in Fig. 4, does not strongly vary. This invariance is also observed for Kelvin and ER waves (Figs. 9, 11).
The mean vertical profiles of horizontal winds in Ho Chi Minh City per MJO phase reveal that not only low- level winds are modulated by different phases, but also their vertical profiles (Fig. 7a). After phase 3, when the minimum vertical extent of westerly winds is reached with predominantly westerly winds between the surface and approximately 850 hPa, the depth of the monsoonal westerlies strongly increases. In phase 6, the maximum depth is reached when westerly winds prevail between the surface and about 500 hPa and have also strength- ened throughout this layer with peak velocities of 10 m s
21in the 900–800-hPa layer. This deep moist monsoon flow favors outbreaks of convection but also
FIG. 5. Anomalies of station rainfall (numbers; mm day21) and ERA-Interim 850-hPa wind (vectors) per phase of the Madden–Julian oscillation (P1–P8) during May–October. Font sizes of numbers increase with the magnitude of rainfall anomalies. Colored numbers and green vectors indicate statistically significant anomalies. Light blue (light orange) shaded areas indicate regions of statistically significant wet (dry) APHRODITE rainfall anomalies (seeFig. 4). (h) The reference vector for ERA-Interim wind.
5808
J O U R N A L O F C L I M A T E VOLUME29provides strong lower-tropospheric wind shear, pro- viding favorable conditions for the organization of convection on different horizontal scales (e.g., Anber et al. 2014 and references therein). In phases 5–8, zonal winds are anomalously westerly between the surface and
about 400 hPa and anomalously easterly in upper levels, whereas these patterns of wind anomalies are reversed in phases 1–4. In other words, the wettest MJO phases are preceded by easterly wind anomalies between the surface and about 400 hPa, while the driest phases are
FIG. 6. Station rainfall anomalies per wave phase during May–October for the (a) Madden–Julian oscillation, (b) Kelvin waves, and (c) equatorial Rossby waves. Asterisks indicate statistically significant anomalies. Note that the vertical axis showing latitude is not linear but depends on the number of stations between latitude bands.
preceded by westerly wind anomalies. Note that the atmosphere is exceptionally dry in the 900–100-hPa layer in phase 7. The pattern of low-level easterly (westerly) and upper-level westerly (easterly) wind anomalies before the wet (dry) phases is similar to the profiles of zonal wind anomalies at Diego Garcia in the central equatorial Indian Ocean, as shown by Kiladis et al. (2005). These results are also consistent with the classical scheme of the MJO circulation, as depicted in Fig. 16 of Madden and Julian (1972).
Dry and wet phases of the MJO also exhibit a dis- cernible influence on the occurrence of intensity in- tervals of daily station rainfall (Fig. 8). During wet phases of the MJO, the frequency of days with less than 1 mm rainfall is reduced by about 28%. On the contrary, the number of days with at least 1-mm rainfall is in- creased during wet phases by about 25%, peaking at an increase of more than 50% in the number of days with at
least 25-mm rainfall. Rainfall anomalies per wave phase averaged over all stations corroborate that phases 8 and 1–3 are dry phases, whereas phases 4–7 are wet phases (Table 1). Moreover, rainfall anomalies in dry and wet phases are significantly enhanced for higher amplitudes of the MJO, except in phases 7 and 8 (Table 1).
b. Kelvin waves
In the Maritime Continent region, the highest OLR variance in the Kelvin wave band is observed close to the equator (Fig. 3b) and gradually decreases north- ward toward Vietnam. In the whole latitude belt de- picted in Fig. 3b, the highest values occur in the central Pacific and farther northward off the equator. This northward displacement of Kelvin waves follows the location of the ITCZ and is consistent with the findings in previous studies (e.g., Roundy and Frank 2004a;
Kiladis et al. 2009).
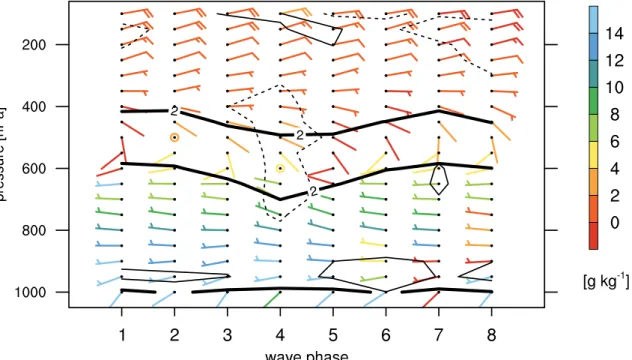
FIG. 7. Vertical profile of vector winds (wind barbs; m s21), specific humidity (wind barb colors), zonal wind anomalies (dashed and solid; thin contour lines for easterly and westerly wind anomalies equal to 1 m s21, respectively), and 2 m s21isotach (thick contour lines) per phase of (a) the Madden–Julian oscillation and (b) equatorial Rossby waves during May–
October. Source: IGRA data for Ho Chi Minh City in (a), and for Da Nang in (b).
5810
J O U R N A L O F C L I M A T E VOLUME29As for the MJO, there is generally a good agreement between APHRODITE and station rainfall anoma- lies, except for phase 6 of the Kelvin wave, when sta- tion anomalies are mostly positive but frequently not significant (Figs. 9f, 10f, 6b, Table S3). In phase 6, significant station anomalies occur south or east of the Annamese Cordillera. However, in general there seems to be no clear influence of the orography on rainfall anomalies for Kelvin waves. In phases 4 and 5, statistically significant positive rainfall anomalies oc- cur mainly southward of 128N, peaking at 4 mm day
21in phase 5 (Figs. 9e, 10e). Over large parts of southern Vietnam, phase 1 is the driest phase, with deviations of up to 2 3 mm day
21relative to the long-term mean.
Station rainfall is enhanced by about 21%–26% dur- ing wet phases and suppressed by about 19%–23%
during dry phases in relation to the long-term mean daily rainfall at stations south of 12 8 N (cf. Figs. 10, S1,
Tables S1 and S3). The influence of Kelvin wave ac- tivity on 850-hPa winds is not as pronounced as for the MJO, most likely because its influence on the hori- zontal wind field is more concentrated closer to the equator. This is evident from significant positive (negative) tropospheric moisture flux convergence anomalies in phases 3 and 4 (phases 1, 7, and 8) that again seem to lead rainfall anomalies by about one phase in southern Vietnam and the adjacent SCS (Fig. S3). Nonetheless, statistically significant easterly wind anomalies occur in phases 1 and 4 (Figs. 9a,d). In contrast to the MJO, Kelvin waves do not exhibit such a pronounced modification of the composite vertical profiles of wind and specific humidity in Ho Chi Minh City, except in phases 7 and 8, when a con- siderable drying of the lower troposphere is observed (Fig. S5). The transitional phases 3 and 7 cannot be considered as entirely dry or wet phases, because
FIG. 8. Influence of wave phases on the frequency of rainfall (RR) intensities (mm day21). Differ- ences in the number of values in the wet phases 4, 5, and 6 are relative to the number of values in the dry phases 8, 1, and 2 for the Madden–Julian oscillation, Kelvin waves, and equatorial Rossby waves during May–October.
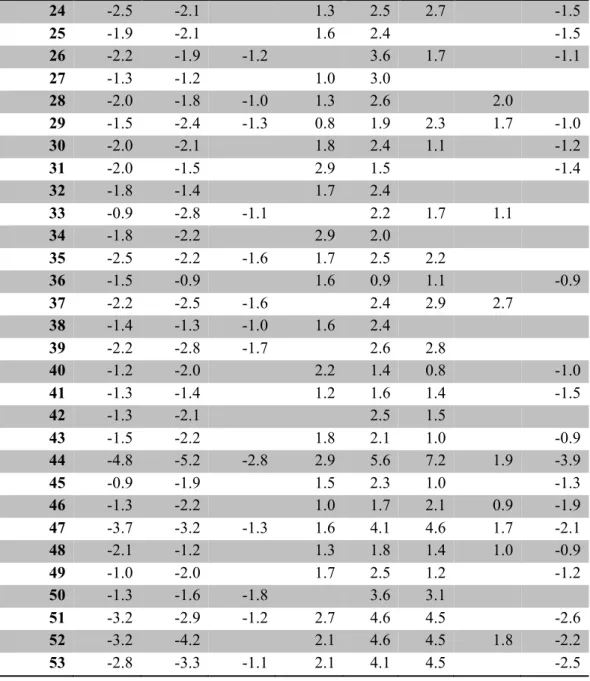
TABLE1. Influence of wave amplitudes (AMP) on rainfall anomalies during May–October. Anomalies (mm day21) are shown, and numbers in brackets indicate the number of days in the wave phase and amplitude interval. Bold numbers indicate statistically significant values. Rainfall anomalies for amplitudes greater than 2 are marked with an asterisk, if the anomalies are significantly different from anomalies for 1,AMP#2. Results are shown for the Madden–Julian oscillation, Kelvin waves, and equatorial Rossby waves.
Wave phase
1 2 3 4 5 6 7 8
MJO AMP.1 21.8(700) 22.2(664) 21.0(660) 1.1(649) 2.8(643) 2.4(624) 0.6(650) 21.0 (656) 1,AMP#2 20.8(371) 21.4(317) 20.7(286) 0.6 (252) 1.9(282) 1.2(263) 0.7(260) 21.3(287) AMP.2 22.8*(329) 22.8*(347) 21.2*(374) 1.4*(397) 3.4*(361) 3.2*(361) 0.5 (390) 20.8(369) Kelvin AMP.1 21.0(451) 20.7(411) 20.1 (334) 0.7(423) 1.2(463) 1.0(395) 20.1 (383) 20.6(377) 1,AMP#2 21.2(388) 20.8(349) 20.1 (286) 0.8(363) 1.1(380) 1.0(333) 0.1 (324) 20.4 (318) AMP.2 20.1 (63) 20.4 (62) 0.2 (48) 0.2 (60) 1.5(83) 1.1 (62) 20.8*(59) 21.5*(59) ER AMP.1 21.4(612) 20.7(571) 0.2 (588) 1.5(548) 1.9(573) 0.9(582) 20.0 (566) 20.7(584) 1,AMP#2 21.5(362) 20.8(313) 20.7(327) 0.9(303) 0.5 (319) 0.3 (327) 20.4 (313) 20.8(340) AMP.2 21.2(250) 20.4 (258) 1.3*(261) 2.2*(245) 3.7*(254) 1.7*(255) 0.4*(253) 20.5 (244)
anomalies are incoherently positive or negative, and only few anomalies are significant (Figs. 9c,g, 10c,g, 6b). The dependency between wave phase and daily rainfall intensity is also less pronounced for Kelvin waves than for the MJO (Fig. 8). However, the fre- quency of days with less than 1-mm rainfall is reduced by 10% and for days with at least 1 mm during wet phases frequency increased by about 20% when compared with the number of days in the respective intervals during dry phases. Area-averaged station rainfall anomalies do not show a pronounced re- lationship between amplitude and anomaly (Table 1).
c. Equatorial Rossby waves
In accordance with the theoretical horizontal structures of ER waves (e.g., Kiladis et al. 2009), local variance maxima of ER wave-filtered OLR occur northward and southward of the equator (Fig. 3c).
During the rainy season, the OLR variance in the southern half of Vietnam is about 50%–75% of the maximum variance that peaks north of the Philippine Luzon Island. The variance maximum in the Southern Hemisphere is weaker than that in the Northern Hemisphere.
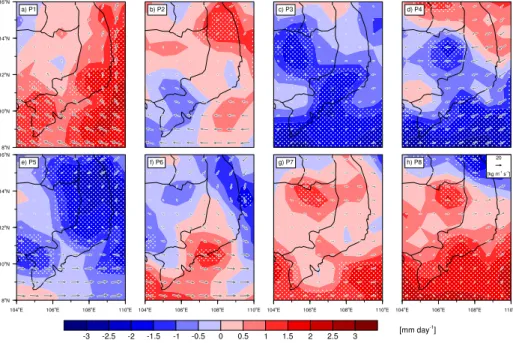
During phases 5 and 6, positive rainfall anomalies are higher on the western side of the Annamese Cordillera (Figs. 11e,f, 12e,f) because of an en- hancement of convection in this region. Overall,
phases 4 and 5 are the wettest phases, with significant rainfall anomalies of up to about 5 mm day
21(Figs. 6c, 11d,e, 12d,e). In agreement with the highest OLR variance in the north of the region, rainfall anomalies are highest in the north and decrease southward. This behavior is most pronounced during phase 5. Compared with Kelvin wave anomalies, ER waves show a larger-scale and more coherent influ- ence (cf. Figs. 9, 10 with Figs. 11, 12). In the north of the region (north of 12 8 N), where rainfall anomalies are highest, station rainfall is enhanced by about 24%–36% during wet phases and suppressed by about 17%–27% during dry phases in relation to the long- term mean (cf. Figs. 12, S1, Tables S1 and S4). On the contrary, when averaged over stations south of 128N, rainfall is enhanced only by about 21%–24% during wet phases and reduced by about 17%–19% during dry phases. The transitional phases 3 and 7 do not show a predominant or significant deviation from the long-term mean (Fig. 6c, Table S4). Westerly winds are significantly enhanced during phases 4 and 5, and anomalies are easterly during phases 8 and 1; during the other phases, the wind is not influenced sub- stantially (Figs. 11, 12). Again, moisture flux conver- gence seems to precede rainfall anomalies by one phase (Fig. S4). As for the MJO, westerly wind anomalies seem to enhance orographic rainfall on the westward side of the Annamese Cordillera. Because of
FIG. 9. As inFig. 4, but for Kelvin waves.
5812
J O U R N A L O F C L I M A T E VOLUME29the strongest influence of ER waves in the north of the area, ER wave influence is more easily discernible in radiosonde data from Da Nang than from Ho Chi Minh City (cf. Figs. 7b, S6). In contrast to the MJO, which modulates the vertical wind and humidity profiles, the influence of ER waves is more pronounced for com- posite humidity profiles: the depth of high, lower-level humidity is clearly increased during wet phases of ER waves (Fig. 7b). The relation between wave phase and rainfall intensity is even weaker than for Kelvin waves, but the influence of wave amplitudes on area-averaged station rainfall anomalies is more pronounced when compared with Kelvin wave composites (Fig. 8 and Table 1), possibly because of the more coherent rainfall anomalies for ER wave phases (cf. Figs. 10, 12). Pri- marily for the wet phases, rainfall anomalies are higher for higher-amplitude ER waves (Table 1).
d. Combined effects of multiple large-scale equatorial waves
In this section, the modulating influence of the con- current occurrence of different waves is determined.
Previously, Roundy (2008) and Roundy and Frank (2004b,c) found interactions between the MJO and Kelvin waves and between the MJO and ER waves, respectively. Here, we test the idea that the concurrence of the MJO and CCEWs can be represented by linear
superposition of the signals of each, although we do not necessarily expect that to be the case, as for the example of Kelvin waves within the MJO (e.g., Roundy 2008).
The influence of the concurrent occurrence of differ- ent MJO phases during certain Kelvin and ER wave phases on daily station rainfall is evaluated here, introducing a new type of wave interference diagram that is schematically illustrated in Fig. 13. The diagram consists of two levels of phase diagrams: one outer phase diagram for wave 1 (W1; Fig. 13a; P1
W1–P8
W1) that re- fers to the phases of Kelvin or ER waves in this study and, for each phase of W1, one inset phase diagram for wave 2 (W2). The inset phase diagram exhibits rainfall modulation during the simultaneous occurrence of all eight MJO phases (P1
W2–P8
W2) during the fixed given phase of W1. Note that any other combination of MJO and CCEWs can be used for W1 and W2. Figure 13b is an example for such an inset phase diagram for phase 1 of W1. The coloring of the phase segments of the outer and inset phase diagrams in Figs. 13a and 13b suggests the expected dry (reddish colors, right segments) and wet (bluish colors, left segments) anomalies during these phases. Yellow-colored segments indicate the transi- tional phases. The outer and inset phase diagrams start with phase 1 in the middle-right position and proceed clockwise from phase 2 to 8, as indicated by the circle in Figs. 13a and 13b. The three major components of this
FIG. 10. As inFig. 5, but for Kelvin waves.
new diagram, denoted as A, B, and C in Fig. 13b, provide more detailed information. Component A includes in- formation about the name of wave 1, about the wave’s current phase (P
W1), and about the area-averaged rainfall anomaly for phase P
W1. The color of the seg- ment in component B indicates the rainfall anomaly of concurrent phases P
W1and P
W2. The first number in the inset white box indicates how the anomaly of P
W1is modulated, if P
W1and P
W2occur concurrently, and the percentage indicates the frequency of this concurrent occurrence. Since only waves with amplitudes greater than one are considered (cf. section 2), component C indicates the percentage of days during phase P
W1when the amplitude of W2 is lower than or equals one. In this example, component B depicts the segment for P1
W2during P1
W1.
Figure 14 shows the phase interference diagram for Kelvin waves and the MJO. Overall, MJO phases 5 and 6 that are in the top-left corner of the inset W2 phase di- agram show the largest influence in all Kelvin wave phases (Fig. 14). Even in the dry Kelvin wave phases 8, 1, and 2 (right panels of the outer W1 phase diagram), the concurrent occurrence of the wet MJO phases 5 and 6 results in significant wet rainfall anomalies (i.e., the MJO overrides the dry signal of the Kelvin waves when it is in its wet phases). The aforementioned anomalies are also significantly different from rainfall anomalies in these Kelvin wave phases when no specific MJO phase is
required. The strongest influence of the MJO is ob- served during the transitional Kelvin wave phase 3 when the MJO is concurrently in phase 5: the area-averaged rainfall anomaly is increased by 5.6 mm day
21in this combination of wave phases. Rainfall anomalies during dry Kelvin waves are also amplified by concurrent dry MJO phases. Dry MJO phases also show an influence during the wet Kelvin wave phases 4, 5, and 6. However, rainfall anomalies are mostly not modified significantly on these days. The strongest drying influence of the MJO with about 2 2.6 mm day
21occurs for the combi- nation of Kelvin wave phases 1 and 2 with MJO phases 2 and 1, respectively.
Results for the combination of ER wave phases and MJO phases (Fig. 15) show similar results as for the combination of Kelvin waves and the MJO (Fig. 14).
Wet MJO phases also have a significant influence on all ER wave phases, as can be seen by the blue, stippled segment on the left side of all outer W1 phase diagram positions. However, the amplification of positive rainfall anomalies is more pronounced, and the percentage of wet MJO phases during wet ER wave phases is generally higher: namely, 9.9%–13.6% for ER waves versus 10.2%–10.8% for Kelvin waves in phase 5. Additionally, the frequency of occurrence of ER waves is for all phases higher than for Kelvin waves (8.8%–10% vs 5.2%–7.2%; cf. Figs. 9 and 11). The strongest modula- tion of rainfall anomalies occurs for the concurrent
FIG. 11. As inFig. 4, but for equatorial Rossby waves.