Antibiotics 2020, 9, 309; doi:10.3390/antibiotics9060309 www.mdpi.com/journal/antibiotics
Article
Paclitaxel, Imatinib and 5‐Fluorouracil Increase the Unbound Fraction of Flucloxacillin In Vitro
Maximilian Stolte 1, Weaam Ali 1, Janne Jänis 2, Andre´ Gessner 1 and Nahed El‐Najjar 1,*
1 Institute of Clinical Microbiology and Hygiene, University Hospital Regensburg, 93053 Regensburg, Germany; maximilianstolte@gmx.de (M.S.); weaam.abdulrahman@azhar.edu.eg (W.A.);
Andre.Gessner@klinik.uni‐regensburg.de (A.G.)
2 Department of Chemistry, University of Eastern Finland, FI‐80100 Joensuu, Finland; janne.janis@uef.fi
* Correspondence: nahed.el‐najjar@klinik.uni‐regensburg.de; Tel.: +49‐941‐944‐14634 Received: 8 May 2020; Accepted: 4 June 2020; Published: 8 June 2020
Abstract: Flucloxacillin (FLU), an isoxazolyl penicillin, is widely used for the treatment of different
bacterial infections in intensive care units (ICU). Being highly bound to plasma proteins, FLU is prone to drug‐drug interactions (DDI) when administered concurrently with other drugs. As FLU is binding to both Sudlow’s site I and site II of human serum albumin (HSA), competitive and allosteric interactions with other drugs, highly bound to the same sites, seem conceivable.
Knowledge about interaction(s) of FLU with the widely used anticancer agents paclitaxel (PAC), imatinib (IMA), and 5‐fluorouracil (5‐FU is scarce. The effects of the selected anticancer agents on the unbound fraction of FLU were evaluated in pooled plasma as well as in HSA and α‐1‐acid glycoprotein (AGP) samples, the second major drug carrier in plasma. FLU levels in spiked samples were analyzed by LC‐MS/MS after ultrafiltration. Significant increase in FLU unbound fraction was observed when in combination with PAC and IMA and to a lesser extent with 5‐FU. Furthermore, significant binding of FLU to AGP was observed. Collectively, this is the first study showing the binding of FLU to AGP as well as demonstrating a significant DDI between PAC/IMA/5‐FU and FLU.
Keywords:
albumin; α‐1‐acid glycoprotein; drug‐drug interactions; anti‐infective agents;
ultrafiltration; cancer
1. Introduction
Most drugs travel the circulation system bound to plasma proteins and only free drugs are able
to reach the sites of action to induce the desired pharmacological effects [1]. The drugs are, therefore,
in an equilibrium state between bound and unbound fractions and the carrier proteins act as a
reservoir slowly releasing the drugs to maintain the established equilibrium. Binding of drugs to
plasma proteins prevents their fast metabolism as well as the attainment of toxic levels in the body
[1]. Cancer patients in ICU often suffer from kidney and/or liver impairments as well as from
hypoalbuminemia, all of which affect the pharmacokinetic/pharmacodynamics (PK/PD) target
attainment of the antimicrobial therapy. DDI can affect the unbound fraction of the antimicrobial
therapy by affecting the metabolism and excretion of the antimicrobial agent used. Consequently,
DDI caused by altered protein binding that affect the unbound fraction of a drug can have a
significant impact on the drug’s effect as even small changes in the percentage of binding can already
increase the unbound fraction by several fold [1]. This is critical in the case of antimicrobial agents as
any change affecting their PK/PD target attainment [2] can alter the clinical outcome of the prescribed
therapy. For instance, an increase in the concentration of the antimicrobial agents can be associated
with toxicity while a decrease in the concentration can result in resistance [3]. Unfortunately, DDI can
play a significant role in the increase in mortality and morbidity of cancer patients [4]. This is not surprising as the complicated health situation of cancer patients necessitates in many instances the concomitant administration of a wide range of medications such as immunosuppressant and anti‐
infective agents along with antineoplastic agents [5]. A study by Poulikakos et al., showed a mortality rate of 100% of cancer patients after an influenza infection even though a proper treatment was received [6]. The reasons for this outcome are not known, but may have been caused by toxicity or under‐dosing of the anticancer/anti‐infective agents. The likelihood of DDI between antibiotics and antineoplastic agents is not unexpected as both agents are characterized by their narrow therapeutic index and high level of inter‐ and intra‐individual variability [7,8]. Possible DDI between antibiotics and anticancer agents are already known, and can be manifested at the PK level where the absorption, distribution, metabolism, elimination of the drug itself or a combination of drugs is affected, or at the PD level resulting in synergistic, additive, or antagonistic effects [7]. While Methotrexate, an anti‐
folate agent effective against different types of tumors, is extensively studied when it comes to antibiotic‐antineoplastic interaction [9–11], data on drug displacement of broad‐spectrum antibiotics by anticancer agents are scarce. Direct changes in protein binding caused by competition at the binding site can easily alter the PK/PD profile of the administered drugs, especially the plasma clearance. Although DDI caused by changes in protein binding is not clinically important for most drugs, it might have severe clinical consequences for highly bound ones (≥90%) [12]. FLU, used for the treatment of many infections that are caused by gram‐positive species i.e
Streptococciand penicillinase‐producing Staphylococci i.e., methicillin‐susceptible Staphylococcus aureus, is known for its high binding to plasma proteins (95–97%) in healthy patients [13]. HSA, known as a high capacity low affinity carrier and which represents nearly 52–60% of the proteins in human blood serum, is the most important protein for the transport of drugs in the body [14]. It is synthesized in the liver, has a serum concentration that ranges from 35 to 50 g/L, a molecular mass of 66 kDa, and a serum half‐life time of roughly 19–20 days [14]. AGP, one of the most important glycoproteins in human plasma, is known as a high affinity low capacity protein that binds both endogenous and exogenous ligands and transport them to their target sites [15]. It is mainly produced in the liver and has an average plasma level of 0.5–1 g/L in healthy adults [16]. As it has only one drug‐binding site, drugs binding primarily to AGP are susceptible to displacement by other AGP ligands [16]. Hypoalbuminemia encountered in 40–50% of ICU patients, the systemic inflammatory response syndrome, the use of inotropes and fluid resuscitation can be the cause for variations in the PK/PD [17] of FLU [13].
Nevertheless, further alterations in the protein binding, due to DDI, could also have serious implications for the clinical outcome. The fact that renal clearance and multiple half‐lives within a dosing interval of highly bound drugs are most likely affected by changes in the protein binding [18], makes FLU highly prone to DDI. Consequently, this study aimed to evaluate in vitro DDI between FLU and three anticancer agents (PAC, IMA, and 5‐FU) widely used against different types of cancer and which bind to the same binding sites as FLU. The unbound fraction of FLU was determined, in the presence and absence of the anticancer agents, by ultrafiltration followed by LC‐MS/MS analysis.
This study shows for the first time the significant binding of FLU to AGP as well as a significant increase in FLU’s free levels in the presence of IMA, PAC, or 5‐FU, which can be clinically relevant following their co‐administration.
2. Results
2.1. Determination of Protein Binding of FLU
Prior to the evaluation of interaction between FLU and the selected anticancer drugs (5‐FU, PAC and IMA), we aimed to simulate using our experimental procedure the physiological conditions and determine the protein binding of FLU alone when tested at concentrations expected in patients [19].
To achieve this aim, spiked plasma samples were incubated at 37 °C for 30 min, processed, and analyzed as previously described. The obtained data shows that FLU has a protein binding of 99.02%
to 99.41%.
2.2. Interaction between 5‐FU, PAC, IMA and FLU in Pooled Plasma
The interactions between FLU and the anticancer drugs: IMA, PAC, and 5‐FU were tested at two different levels of FLU [low (0.2 μg/mL), which fits within its range of minimum inhibitory concentration (MIC) against different bacterial strains [20] and high (20 μg/mL), the 100‐fold MIC still expected within the dosing interval reported in patients]. The anticancer agents, which were supplemented to pooled plasma spiked with FLU, were tested at concentrations that fit with their therapeutic concentrations in patients [21–27]. In comparison to plasma samples spiked with FLU alone, all samples containing either of the anticancer agents and FLU showed increased free levels of FLU (Tables 1–3).
Table 1. Interactions between FLU and PAC in pooled plasma. Data obtained from independent experiments each done with at least four replicates of each concentration. Abbreviations: AB conc = antibiotic concentration; AC conc = anticancer agent concentration; %CV = coefficient of variation. ***
p < 0.001 with respect to FLU alone.
Sample
AB Conc (μg/mL)
AC Conc (μg/mL)
Measured Total Conc in Plasma
(μg/mL)
%CV
Measured Unbound Conc in
Plasma (μg/mL)
%CV %Unbound
FLU alone
FLU alone
0.2 20
‐
‐
0.24 21.76
2.03 4.50
0.0016 0.1275
4.83 10.15
0.66 0.59
FLU + PAC FLU +
PAC
0.2 0.2
0.2
2.0 0.0023
0.0030
3.64 2.87
0.96***
1.21***
FLU + PAC FLU +
PAC FLU +
PAC FLU +
PAC
20 20 20 20
0.2 0.6 1.0 2.0
0.2211 0.2598 0.2609 0.2641
7.17 4.00 3.35 4.56
1.02***
1.19***
1.20***
1.21***
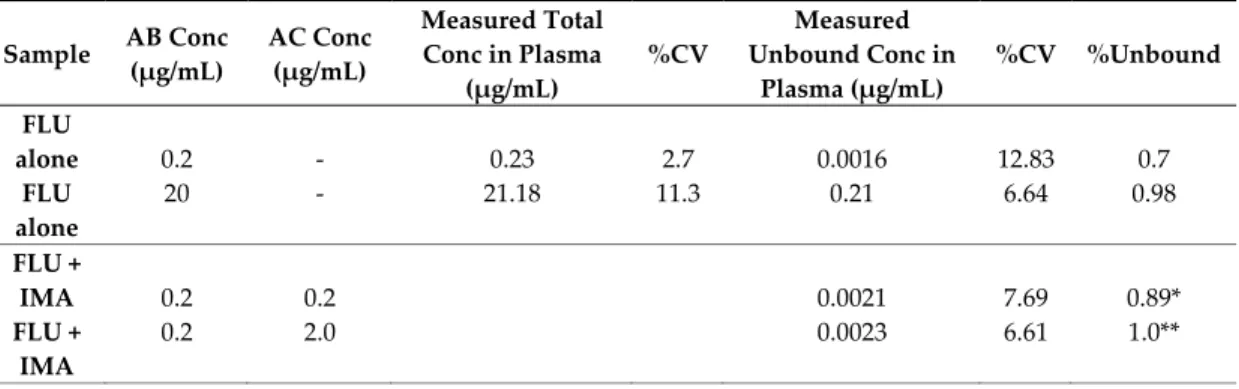
Table 2. Interactions between FLU and IMA in pooled plasma. Data obtained from independent experiments each done with at least four replicates of each concentration. AB conc = antibiotic concentration. AC conc = anticancer agent concentration. %CV = coefficient of variation. * p < 0.05, **
p < 0.01, *** p < 0.001 with respect to FLU alone at 20 μg/mL and 0.2 μg/mL.
Sample AB Conc (μg/mL)
AC Conc (μg/mL)
Measured Total Conc in Plasma
(μg/mL)
%CV
Measured Unbound Conc in
Plasma (μg/mL)
%CV %Unbound
FLU alone
FLU alone
0.2 20
‐
‐
0.23 21.18
2.7 11.3
0.0016 0.21
12.83 6.64
0.7 0.98
FLU + IMA FLU +
IMA
0.2 0.2
0.2
2.0 0.0021
0.0023
7.69 6.61
0.89*
1.0**
FLU + IMA FLU +
IMA FLU +
IMA FLU +
IMA
20 20 20 20
0.2 0.6 1.0 2.0
0.26 0.27 0.30 0.31
4.89 6.45 11.57
4.55
1.22***
1.27***
1.41**
1.47***
Table 3. Interactions between FLU and 5‐FU in pooled plasma. Data obtained from independent experiments each done with at least four replicates of each concentration. AB conc. = antibiotic concentration. AC conc. = anticancer agent concentration. %CV = coefficient of variation. * p < 0.05, **
p < 0.01 with respect to FLU alone at 20 μg/mL and 0.2 μg/mL.
Sample AB Conc.
(μg/mL)
AC Conc.
(μg/mL)
Measured Total Conc. in Plasma
(μg/mL)
%CV
Measured Unbound Conc. in
Plasma (μg/mL)
%CV %Unbound
FLU alone FLU alone
0.2 20
‐
‐
0.28 23.09
7.48 2.84
0.0023 0.1766
5.23 9.57
0.78 0.76 FLU + 5‐
FU FLU + 5‐
FU
0.2 0.2
0.2
2.0 0.0025
0.0026
4.54 1.68
0.88**
0.91**
FLU + 5‐
FU FLU + 5‐
FU FLU + 5‐
FU FLU + 5‐
FU
20 20 20 20
0.2 0.6 1.0 2.0
0.1777 0.1832 0.1871 0.2026
11.6 10.1 3.00 1.60
0.77 0.79 0.81 0.88*
2.2.1. Interactions between FLU and PAC
PAC increases the unbound fraction of FLU (Table 1). Samples containing FLU and PAC at 1:1
ratio already showed increased levels of free FLU while a higher increase was seen in samples
containing FLU (0.2 μg/mL) and PAC (2.0 μg/mL) (1:10 ratio of FLU:PAC, Figure 1A), probably due
to higher levels of the anticancer agent.
Figure 1. Comparison of the percent increase of FLU unbound fraction in mixture with IMA, PAC and 5‐FU at 0.2 μg/mL (A) and 20 μg/mL (B). Percent difference calculated with respective to the percent‐unbound values of FLU alone at 20 μg/mL and 0.2 μg/mL. AC = anticancer agent. * p < 0.05,
** p < 0.01, *** p < 0.001 with respect to FLU alone.
PAC (0.2–2 μg/mL) also resulted in a significant increase in the free fraction of FLU (20 μg/mL).
While a PAC concentration of 0.2 μg/mL already increased the unbound concentration of FLU significantly, the increase was around 2‐fold at concentrations of 0.6 μg/mL and higher (Figure 1B).
Increasing the concentration of PAC (up to 2.0 μg/mL) did not result in a significantly higher increase in unbound FLU (Figure 1B).
2.2.2. Interaction between FLU and IMA
IMA increases the unbound fraction of FLU (Table 2). When tested at 1:1 and 1:10 ratio (FLU:IMA), FLU unbound fraction were increased, respectively, by around 1.3‐fold (Figure 1A). At higher levels of FLU (20 μg/mL), a significant increase of FLU unbound fraction was seen at all IMA concentrations. The highest increase was seen at 2.0 μg/mL, where free levels of FLU were increased by around 1.5‐fold (Figure 1B).
2.2.3. Interaction between FLU and 5‐FU
Only minor increase in FLU was seen in presence of 5‐FU. At low FLU concentrations (0.2 μg/mL), the unbound concentration was only increased by 1.15‐fold (Figure 1A). As expected the effect of 5‐FU was even less at higher levels of FLU (20 μg/mL) (Figure 1B).
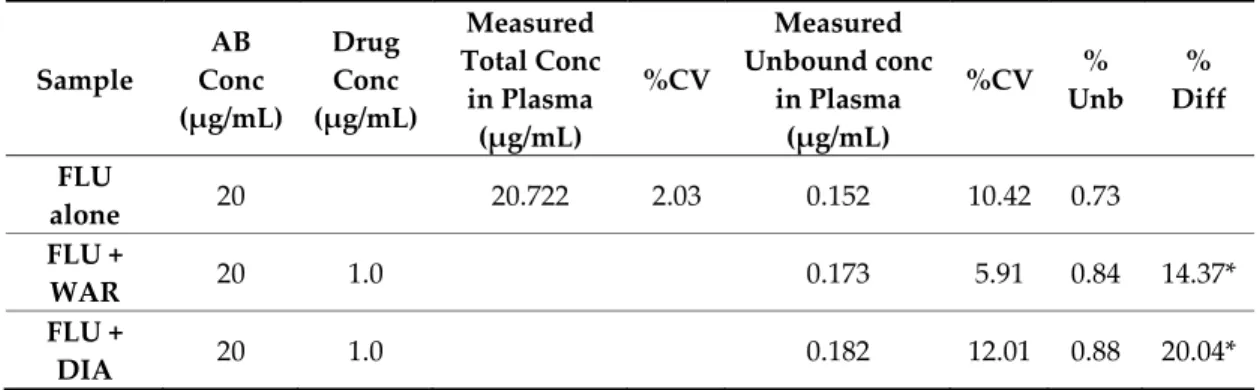
2.2.4. Interactions of FLU with Warfarin and Diazepam in Pooled Plasma
Warfarin, a vitamin k antagonist and widely used anticoagulant, is a commonly used
displacement marker for Sudlow’s site I on HSA [28], while diazepam, a benzodiazepine, is
commonly used as a Sudlow’s site II displacement marker [29]. Therefore, the displacement of FLU
was also tested in the presence of warfarin and diazepam at concentrations encountered in patients
[30–32]. Pooled plasma spiked with FLU/warfarin or FLU/diazepam were analyzed as previously
prescribed. Warfarin and diazepam tested at a concentration of 1.0 μg/mL significantly increased the unbound FLU (20 μg/mL) (Table 4).
Table 4. Interaction between FLU and warfarin (WAR)/or diazepam (DIA) in pooled plasma. Data obtained from independent experiments each done with at least four replicates of each concentration.
% difference (% Diff) calculated with respective to the % unbound (% Unb) values of FLU alone at 20 μg/mL and 0.2 μg/mL. AB conc = antibiotic concentration. %CV = coefficient of variation. * p < 0.05, with respect to FLU alone.
Sample
AB Conc (μg/mL)
Drug Conc (μg/mL)
Measured Total Conc
in Plasma (μg/mL)
%CV
Measured Unbound conc
in Plasma (μg/mL)
%CV % Unb
% Diff
FLU
alone
20 20.722 2.03 0.152 10.42 0.73
FLU +
WAR
20 1.0 0.173 5.91 0.84 14.37*
FLU +
DIA
20 1.0 0.182 12.01 0.88 20.04*
2.3. Binding of FLU to HSA and AGP
2.3.1. Binding of FLU to HSA at Physiological Levels
To evaluate the percentage of binding of FLU to HSA as well as to further confirm the interactions observed between FLU and the tested anticancer agents, FLU was spiked into samples containing physiological concentrations of HSA, which were set to 40 g/L. The percentage of binding of FLU to HSA (40 g/L) [33] ranged from 93.98% to 94.39%, indicating an unbound fraction of 5.61%
to 6.02%, respectively (Table 5).
Table 5. Interactions between FLU and PAC, IMA and 5‐FU at physiological (40 g/L) and pathophysiological (25 g/L) levels of albumin. Data obtained from independent experiments each done with at least 4 replicates of each concentration. % difference (%Diff) calculated with respective to the % unbound (% Unb) values of FLU alone at 20 μg/mL and 0.2 μg/mL. ALB = albumin. AB conc
= antibiotic concentration. AC conc = anticancer agent concentration. %CV = coefficient of variation. * p < 0.05, ** p < 0.01, *** p < 0.001 with respect to FLU alone.
Sample
AB Conc (μg/m L)
AC Conc (μg/mL)
Total Conc (μg/mL)
%CV
Unb Conc (μg/mL)
%CV % Unb % Diff
FLU alone FLU alone
0.2
20 0.25
19.03
10.44 3.54
0.002 0.173
3.37 7.68
0.84
0.91
FLU in HSA (40 g/L) FLU in HSA (40 g/L)
0.2
20 0.197
16.04
4.78 5.96
0.011 0.966
8.97 5.50
5.61
6.02
FLU in HSA (25 g/L) FLU in HSA (25 g/L)
0.2
20 0.232
18.214 6.37 3.15
0.012 1.182
14.75 3.53
5.09
6.51
FLU in HSA (40 g/L) +PAC FLU in HSA (40 g/L)
+PAC
0.2 20
1.0 1.0
0.20 16.04
3.78 6.73
0.013 1.102
11.45 3.93
6.59 6.87
16.84*
14.04***
FLU in HSA (40 g/L) +IMA FLU in HSA (40 g/L)
+IMA
0.2 20
1.0 1.0
0.20 16.04
3.78 6.73
0.0132 1.1426
2.96 4.30
6.81 7.12
20.91**
18.21***
FLU in HSA (40 g/L) +5‐
FU
FLU in HSA (40 g/L) +5‐
FU
0.2 20
1.0 1.0
0.20 16.04
3.78 6.73
0.011 1.057
3.41 5.20
5.46 6.59
3.19 9.32*
FLU in HSA (25 g/L) +PAC FLU in HSA (25 g/L)
+PAC
0.2 20
1.0 1.0
0.22 18.47
4.17 1.07
0.016 1.341
4.94 1.02
7.18 7.26
41.62***
11.59***
FLU in HSA (25 g/L) +IMA FLU in HSA (25 g/L)
+IMA
0.2 20
1.0 1.0
0.244 17.880
2.42 4.47
0.0153 1.3930
2.56 4.28
6.27 7.79
23.64***
19.71***
FLU in HSA (25 g/L) +5‐
FU
FLU in HSA (25 g/L) +5‐
FU
0.2 20
1.0 1.0
0.22 18.47
4.17 1.07
0.012 1.229
4.23 2.89
5.64 6.66
11.18*
2.26
2.3.2. Interactions between FLU and PAC, IMA and 5‐FU at Physiological Levels of HSA
The displacement of FLU by the anticancer drugs, tested at 1.0 μg/mL, was evaluated in the presence of HSA (40 g/L). PAC increased by about 1.15‐fold the unbound fraction of FLU tested at 0.2 μg/mL and 20 μg/mL (Table 5). Likewise, at physiological concentration of HSA, IMA also increased the unbound fraction of FLU (0.2 and 20 μg/mL) by around 1.2‐fold (Table 5). The minimally higher effect observed with FLU (0.2 μg/mL) is probably due to the higher ratio of PAC and IMA to FLU compared to the samples containing FLU (20 μg/mL). Lower effect was seen when 5‐FU is present. At 5‐FU (1 μg/mL) and FLU (0.2 μg/mL) there was no significant difference in the unbound fraction of FLU in HSA solution and only a minimal increase was seen at 20 μg/mL of FLU (Table 5).
2.3.3. Binding of FLU to AGP at Physiological Levels
While FLU is known to bind to HSA, nothing is reported about its binding to AGP. In this part the binding of FLU to AGP was evaluated at physiological concentration (0.9 g/L). Interestingly, FLU alone showed a significant percentage of binding to AGP (Figure 2).
Figure 2. Comparison of the % binding of FLU to pooled plasma, albumin, and α‐1‐acid glycoprotein at physiological and pathophysiological concentrations. *** p < 0.001.
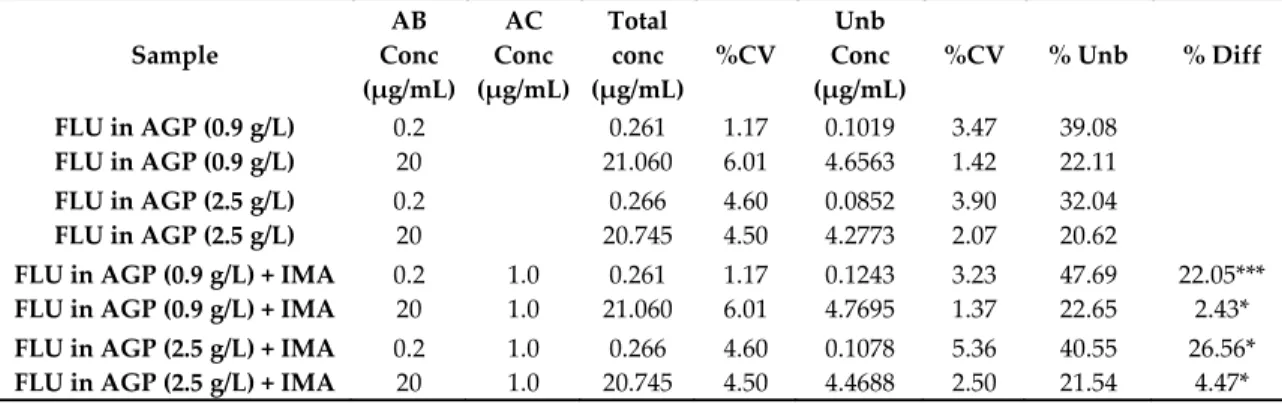
2.4. Interactions between FLU and IMA
As IMA is mainly binding to AGP, we also tested its interactions with FLU at physiological AGP concentrations (0.9 g/L). Interestingly, the increase in the unbound fraction of FLU at 20 μg/mL was not significant (Table 6), while it increased by 1.2‐fold at a concentration of 0.2 μg/mL (Table 6). The increased effect is probably due to the much higher ratio of IMA (1 μg/mL) to FLU (0.2 μg/mL) (5:1) compared to FLU (20 μg/mL).
Table 6. Interactions between FLU and IMA at physiological (0.9 g/L) and pathophysiological (2.5 g/L) levels of α‐1‐acid glycoprotein. Data obtained from independent experiments each done with at least 4 replicates of each concentration. % difference (%Diff) calculated with respective to the % unbound (% Unb) values of FLU alone at 20 μg/mL and 0.2 μg/mL. AGP = α‐1‐acid glycoprotein. AB conc = antibiotic concentration. AC conc = anticancer agent concentration. %CV = coefficient of variation. * p < 0.05, *** p < 0.001 with respect to FLU alone.
Sample
AB Conc (μg/mL)
AC Conc (μg/mL)
Total conc (μg/mL)
%CV
Unb Conc (μg/mL)
%CV % Unb % Diff
FLU in AGP (0.9 g/L) FLU in AGP (0.9 g/L)
0.2 20
0.261 21.060
1.17 6.01
0.1019 4.6563
3.47 1.42
39.08 22.11
FLU in AGP (2.5 g/L) FLU in AGP (2.5 g/L)
0.2
20 0.266
20.745 4.60 4.50
0.0852 4.2773
3.90 2.07
32.04
20.62
FLU in AGP (0.9 g/L) + IMA FLU in AGP (0.9 g/L) + IMA
0.2 20
1.0 1.0
0.261 21.060
1.17 6.01
0.1243 4.7695
3.23 1.37
47.69 22.65
22.05***
2.43*
FLU in AGP (2.5 g/L) + IMA FLU in AGP (2.5 g/L) + IMA
0.2 20
1.0 1.0
0.266 20.745
4.60 4.50
0.1078 4.4688
5.36 2.50
40.55 21.54
26.56*
4.47*
2.5. Binding of FLU to HSA at Pathophysiological Levels
Hypoalbuminemia, caused by several factors like renal and liver diseases, inflammatory diseases, surgery, burn and malnutrition [1], is common in 40–50% of ICU patients [13]. The effects of hypoalbuminemia on the PK of highly bound drugs have already been reported [13]. Therefore, to examine the differences in the protein binding of FLU and the DDI with IMA, PAC and 5‐FU, the same displacement experiments were repeated at pathophysiological solution of HSA (25 g/L) [13].
The percent of binding of FLU in the presence of 25 g/L HSA ranged from 94.91% bound (0.2 μg/mL) to 93.49% (20 μg/mL) (Figure 2).
2.5.1. Interactions between FLU and PAC, IMA, and 5‐FU at Pathophysiological Levels of HSA The displacement of FLU by the anticancer drugs at 1.0 μg/mL was tested in the presence of pathophysiological concentrations of HSA. An increase in FLU (20 μg/mL) unbound fraction was seen in samples containing pathophysiological HSA levels after addition of PAC (Table 5). The more pronounced effect in PAC‐FLU (0.2 μg/mL) samples whereas the unbound fraction increased by 1.4‐
fold (Table 5), is probably caused by the higher ratio of PAC compared to FLU. IMA showed similar effect as with the physiological conditions as the increase of free FLU at 0.2 μg/mL and 20 μg/mL accounted for 1.2‐fold (Table 5). 5‐FU also only showed minor effect to the free fraction of FLU at HSA (25 g/L) at both concentrations (0.2 and 20 μg/mL) (Table 5).
2.5.2. Binding of FLU to Pathophysiological Levels of AGP
The plasma levels of AGP, a positive acute phase protein, can increase 3‐ to 5‐fold during
different conditions such as in cancer, infections, trauma, and inflammation [16]. AGP was prepared
at a concentration of 2.5 g/L to simulate the pathophysiological state of increased AGP levels in
human plasma. AGP solution was spiked with FLU alone and the unbound FLU fraction was
determined. The binding of FLU to AGP samples was 67.96% and 79.38% when FLU’ concentrations
were 0.2 μg/mL and 20 μg/mL, respectively (Figure 2). The unbound fraction of FLU (20 μg/mL)
slightly increased from 77.89% bound at physiological levels AGP (0.9 g/L) to 79.38% bound at
pathophysiological AGP levels (2.5 g/L). Likewise, but a more distinct effect was seen with FLU (0.2
μg/mL) whereas the bound fraction increased from 60.92% at AGP (0.9 g/L) to 67.96% AGP (2.5 g/L) (Figure 2).
2.5.3. Interactions between FLU and IMA at Pathophysiological Levels of AGP
The displacement of FLU by IMA (1.0 μg/mL) was further tested in the presence of AGP (2.5 g/L). In the presence of FLU (20 μg/mL), the increase in the unbound fraction of FLU seen after addition of IMA was minor (Table 6). Similar to the physiological conditions of AGP, the percent increase in unbound fraction of FLU (0.2 μg/mL) was much higher as it accounted for more than 1.2‐
fold (Table 6).
3. Discussion
Drugs bind usually, with different affinity and selectivity, to two major plasma proteins, namely HSA and AGP [27,33–35]. While the bound fraction serves as a reservoir, the unbound fraction distributes into the human body tissues and the extravascular space to induce the pharmacological effect [17,36]. Changes in the free fraction of highly bound drugs, due to DDI have significant impact on the drug’s effect and toxicity, as even small changes in the percentage of binding can already increase the unbound fraction by several folds. This in turn influences the drug’s renal clearance and the multiple half‐lives within a dosing interval [18]. FLU, a broad‐spectrum time dependent β‐lactam antibiotic, is one of the most widely used antibiotics for the treatment of
Staphylococcus aureusacquired in the ICU [37]. FLU is more than 95% bound to plasma proteins [13,17,38], with typical unbound fraction of 3–5% in patients with normal HSA (> 42 g/L). Therefore, FLU is highly prone to DDI. As FLU is associated with liver damage and the development of jaundice [39], altered PK/PD could be dangerous for patients treated with FLU. An altered drug distribution, caused by the competition for plasma protein binding is one of the main reasons for DDI [12]. Only drugs with similar physicochemical properties and which are concurrently administered can compete with each other’s and with other endogenous substances for common or functionally linked binding sites [34].
Displacement interactions through direct competition or allosteric modification can lead to faster elimination or an increase in the pharmacological activity/toxicity of the displaced drug [1], which could be problematic for time‐dependent antibiotics per se. For instance, it has been reported that the binding of a drug can induce three‐dimensional structural changes in HSA, which have been shown to have unpredictable effects on the drug binding even if the changes are minor [1]. Allosteric activation, caused by the binding of molecules, serving as allosteric effectors, has already been described for HSA [40]. Particularly, interactions of FLU with HSA [41] and other drugs are previously reported. For instance, a decrease in the international normalized ratio was shown in several reports after FLU was added to warfarin therapy, probably caused by an induction of the hepatic CYP3A4 isoenzyme [42]. Further interactions with piperacillin [42,43], voriconazole [44,45], rifampicin [46], quinolones [47] and paracetamol [48] have been shown in different studies.
Although displacement interactions have been shown to be of little clinical value for healthy individuals, the situation is different for critically ill patients, especially those with liver or kidney impairment commonly encountered in the ICU [1]. The simultaneous administration, to ICU cancer patients, of antitumor agents and antibiotics [49], characterized by their narrow therapeutic index and inter‐ and intra‐ individual variability, makes them prone to DDI [50,51]. Data on drug displacement effects of anticancer agents on FLU is lacking. This study evaluated the displacement interaction of three anticancer agents (PAC, IMA, and 5‐FU) on the unbound fraction of FLU in pooled plasma, as well as in HSA and AGP solutions. FLU binds to Sudlow’s site I and site II of HSA [16] and modifies residues in both hydrophobic pockets. PAC, a taxane anticancer agent, has a wide range of antitumor activities against ovarian, breast, gastric, prostrate, head and neck, and non‐small‐
cell lung cancers [21]. PAC, a highly bound drug (90% bound [52]), binds primarily to the subdomains
IIA and IIIA of Sudlow’s site I and site II of HSA [53]. When bound to Trp214 in subdomain IIA PAC
causes changes in the protein conformation of the secondary structure and the local conformation of
HSA [53]. IMA, a protein tyrosine kinase Bcr‐Abl and c‐KIT selective inhibitor, is used for the
treatment of gastrointestinal stromal tumors and chronic myeloid leukemia [54,55]. IMA, which is
highly bound to human plasma proteins (95%) [54], primarily to AGP, also shows binding affinity to subdomain IIA of Sudlow’s site I (FA1 and FA7) and subdomain IB of HSA [56,57]. 5‐FU, uracil analogue, is widely used for the treatment of cancers such as colon, breast, and skin among others [58]. 5‐FU binds to the subdomain IIA on Sudlow’s site I on HSA [59].
In this in vitro study, we evaluated first the binding of FLU to plasma proteins in pooled plasma and in solutions containing physiological levels of the two major drugs’ carriers in plasma (HSA and AGP) prior the evaluation of the displacing effect of PAC, IMA and 5‐FU. The data shows that FLU has a protein binding ranging from 99.02 to 99.41%. The higher binding of FLU observed in this study, compared to other studies (93% [38], 95% [36], 95–97% [13]), can be attributed to the fact that most studies investigating the protein binding of FLU were in blood samples directly taken from patients after oral administration of FLU [13,38], while in this study FLU is spiked into pooled plasma samples obtained from healthy volunteers. In patients treated with FLU, other drugs can be concomitantly administered and can still be bound to the proteins affecting thus the percentage of binding of FLU.
In addition, different information can be obtained if different settings for samples’ processing and analysis are used. For instance, the unbound concentration is often estimated rather than directly measured [60–62]. The percentage of binding of FLU to physiological levels of HSA (40 g/L) ranged from 93.98% to 94.39%. Considering that pooled plasma and HSA solution contains protein levels that exceeds those of FLU, the reason for the five times higher unbound fraction of FLU observed when in the presence of physiological HSA compared to the one in pooled plasma can be attributed to a potential increase in the affinity of the proteins in plasma to FLU. It has been shown that unbound fraction of a drug can be significantly altered in the absence of endogenous fatty acids per se.
Furthermore, it is possible that plasma contains other carriers/binding partners that also binds FLU.
It is known that FLU binds to HSA while nothing is known about its binding to AGP. Interestingly, this study shows for the first time that FLU binds significantly to physiological concentrations of AGP (0.9 g/L) [60.92% (0.2 μg/mL) and 77.89% (20 μg/mL) of FLU] (Figure 2). In opposition to the stable binding of FLU to HSA 94.39% (0.2 μg/mL FLU) and 93.98% (20 μg/mL FLU) the large variation observed in the binding of different concentration of FLU to AGP solutions merits further investigation. Nevertheless, the binding of FLU to AGP has clinical implications as suggests that HSA and AGP can compensate for each other for the binding of FLU in cases where significant changes affect their levels.
The displacement of FLU was assessed and significant increase in the unbound fraction of FLU has been shown in the presence of PAC, IMA, and to a lesser extent with 5‐FU in pooled plasma and HSA samples (40 g/L), as well as in the presence of IMA in AGP samples (0.9 g/L).
The effect of PAC (1 μg/mL) on the unbound fraction of FLU (20 μg/mL) was significant (14.04%
increase) in HSA samples (40 g/L, Table 5); yet, it was still much lower than in samples containing pooled plasma (104.59%, Figure 1). A similar effect was seen with IMA (1 μg/mL) whereas the percent increase in unbound fraction of FLU (20 μg/mL) in pooled plasma, in HSA samples and in AGP samples were, respectively, 44.11% (Figure 1), 18.21% (Table 5), and 2.43% (Table 6). For 5‐FU (1 μg/mL) the observed interactions in the presence of FLU, both in pooled plasma and HSA solutions, were less pronounced than with PAC and IMA whereas the increase in the unbound fraction of FLU (20 μg/mL) was by 5.97% (pooled plasma, Figure 1) and 9.32% (HSA samples, Table 5). This minor effect, compared to PAC and IMA goes along with its low protein binding (8–12%) [63].
Even though the observed increase in FLU unbound fraction in the presence of IMA was
significant, higher increases could have been expected with IMA, which like PAC is highly bound to
plasma proteins (95%) [54]. The lower displacing effect of PAC and IMA on unbound FLU seen in
pooled plasma, could be explained as follows: 1) IMA is mainly bound to AGP [57], while PAC is
mainly bound to HSA, 2) pooled plasma contains other endogenous/exogenous compounds that
could also affect the binding of FLU or influence the effects exerted by PAC and IMA on FLU, this is
supported by the similar effects obtained with HSA samples containing pure HSA, FLU and
IMA/PAC, and 3) a difference in the affinity of IMA to plasma proteins. This latter one can be
supported by the observed increase in unbound FLU in the presence of warfarin and diazepam
frequently used as site I and site II displacing markers. As both drugs are around 99% bound [64,65],
displacing effects similar or higher to those seen with PAC and IMA were expected. Interestingly, when tested at the same concentrations as IMA and PAC, the increase in the unbound fraction of FLU (20 μg/mL) were less than expected [14.37% (warfarin) and 20.04% (diazepam)] (Table 4).
Consequently, it seems that both agents, show different affinity to HSA and weren’t able to displace FLU similar to PAC and IMA. The Sudlow’s Site I of HSA is able to simultaneously bind a wide variety of structurally different ligands, yet, with poor stereo‐selectivity; even the binding of fatty acids influences the tertiary structure and the binding of site I ligands [1]. Site II, on the other hand, is smaller and stereo‐selective. It has been shown that displacement interactions with fatty acids due to the high affinity of FA3‐FA4 binding sites are more likely to occur on this site [1]. The effects of PAC’ binding to HSA, associated with major conformational changes, unfolding of the structure and significant increases of the hydrodynamic volume of the PAC‐HSA complex [66], support the assumption of possible allosteric interactions when co‐administered with other drugs. Moreover, indications for 5‐FU to cause conformational changes in HSA have already been documented [67].
Therefore, allosteric changes induced by PAC and 5‐FU on HSA could be one cause for the detected DDI.
Interestingly, while previous data reported on the effect of various drugs on the metabolism of PAC [68,69] and IMA [43], unbound fraction of IMA [70], as well as the potency, toxicity, and deadly effects of 5‐FU [55,66,71,72], this is the first report showing a significant effect of IMA, PAC, and 5‐
FU on the displacement of drugs such as FLU from plasma proteins under physiological conditions.
The interactions were also evaluated in conditions encountered in critically ill cancer patients.
As these patients, suffer in many instances from additional pathological conditions affecting their kidney and liver, major routes for drugs’ metabolism and elimination. Reduced renal and hepatic functions leads to lower HSA levels (hypoalbuminemia) in elderly patients, which associates with decreased drug binding to HSA and eventually results in the accumulation of the administered drugs [1]. Inflammatory diseases and conditions such as surgery, burn and malnutrition can temporarily exacerbate this already present hypoalbuminemia [1]. The effect of hypalbuminemia on protein binding characteristics of some antibiotics, including FLU in critically ill patients has already been demonstrated, whereas increased unbound drug fraction was measured while the total drug concentration was within the reference range [73]. Moreover, the peak concentration of ceftriaxone, another antibiotic, has been shown to fall under the minimum effective concentration solely due to lower HSA concentration in patients with normal renal function [1].
Interestingly, there was no significant difference in the percentage of binding of FLU when spiked at two different concentrations into physiological (40 g/L)/pathophysiological (25 g/L) solutions of HSA (Figure 2). Even though our data are in contrast to those reported in real patients [13], the plausible explanation is that the samples in this study contained only FLU and HSA whereas in real patients other endogenous and exogenous molecules are present and also compete for the same binding sites of FLU.
Intriguingly, when FLU was combined with either of PAC, IMA, or 5‐FU at pathophysiological levels of HSA, differential effects were observed. For instance, while hypoalbuminemia did not have a significant effect on the displacing effect of IMA, only at a ratio of 1:5 (FLU/5‐FU) a significant increase in unbound FLU (11.18% (25 g/L HSA) vs. −3.19% (40 g/L HSA)) was observed. Similarly, in comparison to physiological levels of HSA, a 2.5‐fold increase in the displacing effect of PAC was observed (Table 5).
In addition to hypoalbuminemia, pathological conditions such as arthritis, myocardial infarction, and cancer raise AGP levels thus enhancing the binding of drugs [27]. As expected, at both tested concentrations and in comparision to the binding of FLU to physiological AGP levels (0.9 g/L), more FLU was bound to increased levels of AGP (2.5 g/L) (Figure 2).
4. Materials and Methods
4.1. Standards and Reagents
IMA, PAC, 5‐FU, and methanol, were obtained from Sigma‐Aldrich (Munich, Germany). HSA and AGP were obtained from Sigma‐Aldrich (Steinheim, Germany). FLU sodium salt was purchased from Toronto Research Chemicals (Toronto, ON, Canada). Flucloxacillin‐13C4‐14N sodium salt (FLU‐13C4‐14N) was from Alsachim (Illkirch, France). Sterile water was purchased from B. Braun Melsungen AG (Melsungen, Germany). All reagents used were of the highest available analytical grades. Drug free human plasma was obtained from the Blood Donors’ Center in Regensburg (Haema, Regensburg, Germany).
4.2. Preparations of Stock Solutions, Standards, and Quality Control Samples
An individual first set of stock was prepared for FLU in water. The stock was used to prepare the standards (SD) and quality controls (QC) on each run day. The SD and QC were diluted in water to generate the appropriate concentrations. The SD and QC were diluted in pooled plasma on each lab day to generate the required concentrations. The percentage of water in the working solutions did not exceed 10% to maintain the integrity of the plasma. The concentration of FLU in the plasma standards covered the expected range in human plasma (0.1 to 40 μg/mL) [19,74]. The QC with the highest concentration (QCH) was prepared at a concentration of 20 μg/mL and further diluted to obtain the low QC (QCL) at a concentration of 0.2 μg/mL. All samples were stored at ‐80°C. Pooled plasma was used to determine, in vitro, the protein binding of FLU to human plasma proteins. HSA stocks, prepared by dissolving fraction V albumin powder in water, were further diluted to yield stocks of 25 g/L and 40 g/L. AGP stocks were prepared in water and used to generate 0.9 g/L and 2.5 g/L stocks. FLU was spiked, at two different concentrations (0.2 and 20 μg/mL), to plasma and the different stocks of HSA and AGP.
4.3. FLU Determination by LC‐MS/MS
The analysis was conducted using an already established liquid chromatography tandem mass spectrometry (LC‐MS/MS) method [74] after slight modifications. A 1200 series liquid chromatography system (Agilent, Waldbronn, Germany) consisting of G1312B binary pump, CTC‐
PAL Autosampler (CTC Analytics AG, Zwingen, Switzerland) and G1316B column oven module, connected to an API 4000 triple‐quadrupole mass spectrometer equipped with electrospray (ESI) source (Applied Biosystems/Sciex, Darmstadt, Germany), was used for the analysis of the prepared samples. For the chromatographic separation, a reversed phase Kinetex F5 column with TMS endcapping (50 mm × 2.1 mm, 2.6 μm) (Phenomenex, Aschaffenburg, Germany) and an UltraLine UHPLC In‐Line Filter (In‐Line Assembly with Filter) (Restek, Bellefonte, PA, USA) was used. The temperature of the column was set at 50 °C, while the auto sampler tray temperate was set at 8 °C.
The mobile phases, water (MPA) and methanol (MPB) charged with 2 mmol/L ammonium acetate and 0.1% formic acid, were delivered using a binary pump. After injecting fifteen μl into the column, a gradient elution at a flow rate of 0.5 mL/min was used to elute the components. From start to 0.15 min the mobile phase consisted of 96% MPA. MPB was linearly increased to 55% (from 0.15 to 1.7 min) and further increased to 100% MPB (from 1.7 to 2.3 min). MPB was retained at 100% from 2.3 to 3.3 min. The analytical column was re‐equilibrated to initial conditions at 3.3 min. The total run time was 4 min. Isotopically labelled internal standard was used for FLU. Multiple reactions monitoring (MRM) in positive mode was used for the detection of the eluting compounds. The MS/MS instrument was operated with the following parameters: capillary voltage (5.5 kV), desolvation gas (nitrogen) heated at 400 °C
.The dwell time for all the transitions was 10 ms. Details of the MRM‐
transitions, collision energy, de‐clustering potential, and exit potential of FLU and its internal
standard are detailed previously [74]. Data acquisition and peak integration were performed using
Analyst software (1.6.2) (Applied Biosystems/Sciex, Darmstadt, Germany). Total FLU was analyzed
using isotopically labeled internal standard (IS), while analysis of unbound FLU was performed
without IS. When used, IS was prepared fresh on each day using ice‐cold methanol. Protein binding values were determined by subtracting the unbound values from the total FLU values in total plasma/HSA/AGP.
4.4. Sample Preparation for Total and Unbound FLU
Spiked samples were kept at 37 °C for 30 min and mixed with agitation (350 rpm) to allow the equilibrium between unbound and bound drug. For the analysis of unbound FLU, Amicon Ultra‐0.5 centrifugal filter devices with a molecular weight cutoff of 30 kDa were used for the ultrafiltration of the samples. Briefly, 250 μL of spiked samples was inserted into the Amicon filter and centrifuged at 14000 g for 30 min at 20 °C. To fit with the concentration ranges of the established method, the collected filtrates were further diluted in the auto‐sampler vials before injection into the LC‐MS/MS system. Extraction and analysis of total FLU from spiked samples were processed as follows: 40 μL were extracted (1:5 v/v) with internal standard working solution (ISWS), vortexed for 3 min and centrifuged for 5 min at 13,000 g at 4 °C. Samples were further diluted in water (1:5 v/v) in auto‐
sampler vials. Fifteen μL from all samples (total and unbound) was injected into the chromatographic system.
4.5. Statistics
All data were obtained from independent days from at least four replicates per each sample condition. Statistical significance for the difference in FLU unbound values was evaluated using student t‐test. p < 0.05 was considered significant.
5. Conclusions
Highly bound drugs with narrow therapeutic index are prone to clinically important displacement interactions especially in presence of liver and/or kidney impairments, often encountered in ICU, and which result in an increase or a decrease in the drugs’ pharmacological effects. For instance, as a time‐dependent β‐lactam antibiotic a faster elimination due to an increase in the unbound fraction of FLU can be detrimental for the patients. Consequently, preservation of the unbound drug levels above the bacterial minimum inhibitory concentration during the dosing period is fundamental to achieve a positive clinical outcome. This study highlights two important findings.
To the best of our knowledge this is the first report showing the significant binding of FLU to AGP and the interaction of FLU with IMA, PAC, or 5‐FU, which can be clinically relevant following their co‐administration. Furthermore, the fact that the selected anticancer drugs are used against different cancer types allows the generalization/application of the observed effects for a wide range of cancer patients. Further investigations and in vivo studies are needed to decipher the clinical relevance of the observed interactions. Meanwhile, with the ultimate aim of improving the clinical outcome of FLU therapy, therapeutic drug monitoring of the unbound fraction of FLU could be the key to assure its success when co‐administered with the tested and other similar drugs. An exact observation of the free fraction is important, as changes in the percentage of plasma binding can influence the active concentration without influencing the total concentration; in this case dose adjustment can be made if any changes in its free fraction are asserted.
Author Contributions: Conceptualization, A.G. and N.E.‐N.; Data curation, M.S., W.A. and N.E.‐N.; Formal analysis, M.S., W.A. and N.E.‐N; Funding acquisition, A.G. and N.E.‐N.; Investigation, M.S., W.A. and N.E.‐N.;
Methodology, M.S., J.J. and N.E.‐N.; Project administration, N.E.‐N.; Resources, A.G. and N.E.‐N.; Supervision, N.E.‐N.; Validation, M.S., W.A., J.J. and N.E.‐N.; Visualization, J.J., A.G. and N.E.‐N.; Writing – original draft, M.S.; Writing–review & editing, J.J., A.G. and N.E.‐N. All authors have read and agreed to the published version of the manuscript.
Funding: This research received no external funding.
Acknowledgments: We thank Mrs. Andrea Schwarz for the technical assistance. We thank Miss Maryam Saffiedine for editing the English of the manuscript.
Conflicts of Interest: The authors declare no conflict of interest.
References
1. Rimac, H.; Debeljak, Ž.; Bojić, M.; Miller, L. Displacement of Drugs from Human Serum Albumin: From Molecular Interactions to Clinical Significance. Curr. Med. Chem. 2017, 24, 1930–1947.
2. Udy, A.A.; Roberts, J.A.; Lipman, J. Clinical implications of antibiotic pharmacokinetic principles in the
critically ill. Intensive Care Med. 2013, 39, 2070–2082.
3. Roberts, J.A.; Lipman, J. Pharmacokinetic issues for antibiotics in the critically ill patient. Crit. Care Med.
2009, 37, 840–51.
4. Buajordet, I.; Ebbesen, J.; Erikssen, J.; Brørs, O.; Hilberg, T. Fatal adverse drug events: the paradox of drug treatment. J. Intern. Med. 2001, 250, 327–341
5. El‐Najjar, N.; Jantsch, J.; Gessner, A. The use of liquid chromatography‐tandem mass spectrometry for therapeutic drug monitoring of antibiotics in cancer patients. Clin. Chem. Lab. Med. 2017, 55, 1246–1261.
6. Poulikakos, P.; Tsispara, A.; Vartzeli, P.; Zakka, M. Critically ill cancer patients with influenza (H1N1) infection in the intensive care unit in Greece. Acta Oncol. 2015, 54, 1081–1082.
7. van Leeuwen, R W F; Brundel, D.H.S.; Neef, C.; van Gelder, T.; Mathijssen, R.H.J.; Burger, D.M.; Jansman, F.G.A. Prevalence of potential drug–drug interactions in cancer patients treated with oral anticancer drugs.
Br. J. Cancer 2013, 108, 1071.
8. Felici, A.; Verweij, J.; Sparreboom, A. Dosing strategies for anticancer drugs: the good, the bad and body‐
surface area. Eur. J. Cancer 2002, 38, 1677–1684.
9. Jarfaut, A.; Santucci, R.; Levêque, D.; Herbrecht, R. Severe methotrexate toxicity due to a concomitant administration of ciprofloxacin. Médecine Et Mal. Infect. 2013, 43, 39–41.
10. Dalle, J.‐H.; Auvrignon, A.; Vassal, G.; Leverger, G. Interaction Between Methotrexate and Ciprofloxacin. J.
Pediatric Hematol. /Oncol. 2002, 24.
11. Nierenberg, D.W.; Mamelok, R.D. Toxic Reaction to Methotrexate in a Patient Receiving Penicillin and Furosemide: A Possible Interaction. DERM 1983, 119, 449–450, doi:10.1001/archderm.1983.01650300003001.
12. Singh, S. Preclinical Pharmacokinetics: An Approach Towards Safer and Efficacious Drugs. CDM 2006, 7, 165–182.
13. Ulldemolins, M.; Roberts, J.A.; Wallis, S.C.; Rello, J.; Lipman, J. Flucloxacillin dosing in critically ill patients with hypoalbuminaemia: special emphasis on unbound pharmacokinetics. jac 2010, 65, 1771–1778.
14. Wong, G.; Brinkman, A.; Benefield, R.J.; Carlier, M.; Waele, J.J. de; El Helali, N.; Frey, O.; Harbarth, S.;
Huttner, A.; McWhinney, B.; et al. An international, multicentre survey of β‐lactam antibiotic therapeutic drug monitoring practice in intensive care units. jac 2014, 69, 1416–1423.
15. Kremer, J.M.; Wilting, J.; Janssen, L.H. Drug binding to human alpha‐1‐acid glycoprotein in health and disease. Pharmacol. Rev. 1988, 40, 1.
16. Jenkins, R.E.; Meng, X.; Elliott, V.L.; Kitteringham, N.R.; Pirmohamed, M.; Park, B.K. Characterisation of flucloxacillin and 5‐hydroxymethyl flucloxacillin haptenated HSA in vitro and in vivo. Prot. Clin. Appl. 2009, 3, 720–729.
17. Ulldemolins, M.; Roberts, J.A.; Rello, J.; Paterson, D.L.; Lipman, J. The Effects of Hypoalbuminaemia on Optimizing Antibacterial Dosing in Critically Ill Patients. Clin. Pharmacokinet. 2011, 50, 99–110.
18. Roberts, J.A.; Pea, F.; Lipman, J. The Clinical Relevance of Plasma Protein Binding Changes. Clin.
Pharmacokinet. 2013, 52, 1–8.
19. Abdul‐Aziz, M.H.; McDonald, C.; McWhinney, B.; Ungerer, J.P.J.; Lipman, J.; Roberts, J.A. Low flucloxacillin concentrations in a patient with central nervous system infection: the need for plasma and cerebrospinal fluid drug monitoring in the ICU. Ann. Pharm. 2014, 48, 1380–1384.
20. Landersdorfer, C.B.; Kirkpatrick, C.M.J.; Kinzig‐Schippers, M.; Bulitta, J.B.; Holzgrabe, U.; Drusano, G.L.;
Sörgel, F. Population pharmacokinetics at two dose levels and pharmacodynamic profiling of flucloxacillin.
Antimicrob. Agents Chemother. 2007, 51, 3290–3297.
21. Weger, V.A. de; Beijnen, J.H.; Schellens, J.H.M. Cellular and clinical pharmacology of the taxanes docetaxel and paclitaxel‐‐a review. Anti‐Cancer Drugs 2014, 25, 488–494.
22. Regenthal, R.; Krueger, M.; Koeppel, C.; Preiss, R. Drug Levels: Therapeutic and Toxic Serum/Plasma Concentrations of Common Drugs. J. Clin. Monit. Comput. 1999, 15, 529–544.
23. Moreno, J.M.; Wojnicz, A.; Steegman, J.L.; Cano‐Abad, M.F.; Ruiz‐Nuño, A. Imatinib assay by high‐
performance liquid chromatography in tandem mass spectrometry with solid‐phase extraction in human plasma. Biomed. Chromatogr. 2013, 27, 502–508.
24. Rezende, V.M.; Rivellis, A.; Novaes, M.M.Y.; Alencar Fisher Chamone, D. de; Bendit, I. Quantification of imatinib in human serum: validation of a high‐performance liquid chromatography‐mass spectrometry method for therapeutic drug monitoring and pharmacokinetic assays. Drug Des. Devel. 2013, 7, 699–710.
25. Alanazi, F.K.; Yassin, A.E.; El‐Badry, M.; Mowafy, H.A.; Alsarra, I.A. Validated high‐performance liquid chromatographic technique for determination of 5‐fluorouracil: applications to stability studies and simulated colonic media. J. Chromatogr. Sci. 2009, 47, 558–563.
26. Alsarra, I.A.; Alarifi, M.N. Validated liquid chromatographic determination of 5‐fluorouracil in human plasma. J. Chromatogr. B Anal. . Technol. Biomed. Life Sci. 2004, 804, 435–439.
27. Huang, Z.; Ung, T. Effect of Alpha‐1‐Acid Glycoprotein Binding on Pharmacokinetics and Pharmacodynamics. CDM 2013, 14, 226–238.
28. Moser, A.C.; Kingsbury, C.; Hage, D.S. Stability of warfarin solutions for drug‐protein binding measurements: spectroscopic and chromatographic studies. J. Pharm. Biomed. Anal. 2006, 41, 1101–1109.
29. Dufour, C.; Dangles, O. Flavonoid‐serum albumin complexation: determination of binding constants and binding sites by fluorescence spectroscopy. Biochim. Biophys. Acta 2005, 1721, 164–173.
30. Kwon, M.‐J.; Kim, H.‐J.; Kim, J.‐W.; Lee, K.‐H.; Sohn, K.‐H.; Cho, H.‐J.; On, Y.‐K.; Kim, J.‐S.; Lee, S.‐Y.
Determination of plasma warfarin concentrations in Korean patients and its potential for clinical application. Korean J. Lab. Med. 2009, 29, 515–523.
31. Greenblatt, D.J.; Laughren, T.P.; Allen, M.D.; Harmatz, J.S.; Shader, R.I. Plasma diazepam and desmethyldiazepam concentrations during long‐term diazepam therapy. Br. J. Clin. Pharm. 1981, 11, 35–40.
32. Schulz, M.; Schmoldt, A. Therapeutic and toxic blood concentrations of more than 800 drugs and other xenobiotics. Die Pharm. ‐. Int. J. Pharm. Sci. 2003, 58, 447–474.
33. Kratz, F. Albumin as a drug carrier: Design of prodrugs, drug conjugates and nanoparticles. J. Control.
Release 2008, 132, 171–183.
34. Ascenzi, P.; Bocedi, A.; Notari, S.; Fanali, G.; Fesce, R.; Fasano, M. Allosteric Modulation of Drug Binding to Human Serum Albumin. MRMC 2006, 6, 483–489.
35. Ascenzi, P.; Fanali, G.; Fasano, M.; Pallottini, V.; Trezza, V. Clinical relevance of drug binding to plasma proteins. J. Mol. Struct. 2014, 1077, 4–13.
36. Zeitlinger, M.A.; Derendorf, H.; Mouton, J.W.; Cars, O.; Craig, W.A.; Andes, D.; Theuretzbacher, U. Protein binding: do we ever learn? Antimicrob. Agents Chemother. 2011, 55, 3067–3074
37. McKenzie, C. Antibiotic dosing in critical illness. jac 2011, 66, ii25–ii31.
38. Wong, G.; Briscoe, S.; Adnan, S.; McWhinney, B.; Ungerer, J.; Lipman, J.; Roberts, J.A. Protein Binding of β‐
Lactam Antibiotics in Critically Ill Patients: Can We Successfully Predict Unbound Concentrations?
Antimicrob. Agents Chemother. 2013, 57, 6165.
39. Fairley, C.K.; McNeil, J.J.; Desmond, P.; Smallwood, R.; Young, H.; Forbes, A.; Purcell, P.; Boyd, I. Risk factors for development of flucloxacillin associated jaundice. BMJ 1993, 306, 233–235.
40. Ascenzi, P.; Bocedi, A.; Bolli, A.; Fasano, M.; Notari, S.; Polticelli, F. Allosteric modulation of monomeric proteins*. Biochem. Mol. Biol. Educ. 2005, 33, 169–176.
41. Seedher, N.; Agarwal, P. Interaction of some isoxazolyl penicillins with human serum albumin. J. Biol. Sci 2006, 6, 167–172.
42. Bolhuis, M.S.; Panday, P.N.; Pranger, A.D.; Kosterink, J.G.W.; Alffenaar, J.‐W.C. Pharmacokinetic Drug Interactions of Antimicrobial Drugs: A Systematic Review on Oxazolidinones, Rifamycines, Macrolides, Fluoroquinolones, and Beta‐Lactams. Pharmaceutics 2011, 3, 865–913.
43. Landersdorfer, C.B.; Kirkpatrick, C.M.J.; Kinzig, M.; Bulitta, J.B.; Holzgrabe, U.; Sörgel, F. Inhibition of flucloxacillin tubular renal secretion by piperacillin. Br. J. Clin. Pharm. 2008, 66, 648–659.
44. Kennedy, B.; Larcombe, R.; Chaptini, C.; Gordon, D.L. Interaction between voriconazole and flucloxacillin during treatment of disseminated Scedosporium apiospermum infection. J. Antimicrob. Chemother. 2015, 70, 2171–2173.
45. Muilwijk, E.W.; Dekkers, B.G.J.; Henriet, S.S.V.; Verweij, P.E.; Witjes, B.; Lashof, A.M.L.O.; Groeneveld, G.H.; van der Hoeven, J.; Alffenaar, J.W.C.; Russel, F.G.M.; et al. Flucloxacillin Results in Suboptimal Plasma Voriconazole Concentrations. Antimicrob. Agents Chemother. 2017, 61, doi:10.1128/AAC.00915‐17.
46. Garzoni, C.; Uçkay, I.; Belaieff, W.; Breilh, D.; Suvà, D.; Huggler, E.; Lew, D.; Hoffmeyer, P.; Bernard, L. In vivo interactions of continuous flucloxacillin infusion and high‐dose oral rifampicin in the serum of 15 patients with bone and soft tissue infections due to Staphylococcus aureus ‐ a methodological and pilot study. Springer Plus 2014, 3, 287.
47. Janknegt, R. Drug interactions with quinolones. jac 1990, 26 Suppl D, 7–29.
48. Jessurun, N.T.; van Hunsel, F.; van Puijenbroek, E. Metabolic acidosis with a high anion: a drug‐drug interaction between Paracetamol and Flucloxacillin. Clin. Ther. 2015, 37, e47.
49. Taccone, F.S.; Artigas, A.A.; Sprung, C.L.; Moreno, R.; Sakr, Y.; Vincent, J.‐L. Characteristics and outcomes of cancer patients in European ICUs. Crit. Care 2009, 13, R15.
50. Mouzon, A.; Kerger, J.; DʹHondt, L.; Spinewine, A. Potential Interactions with Anticancer Agents: A Cross‐
Sectional Study. Chemotherapy 2013, 59, 85–92.
51. Sime, F.B.; Roberts, M.S.; Peake, S.L.; Lipman, J.; Roberts, J.A. Does Beta‐lactam Pharmacokinetic Variability in Critically Ill Patients Justify Therapeutic Drug Monitoring? A Systematic Review. Ann. Intensive Care 2012, 2, 35.
52. Ohbatake, Y.; Fushida, S.; Tsukada, T.; Kinoshita, J.; Oyama, K.; Hayashi, H.; Miyashita, T.; Tajima, H.;
Takamura, H.; Ninomiya, I.; et al. Elevated alpha1‐acid glycoprotein in gastric cancer patients inhibits the anticancer effects of paclitaxel, effects restored by co‐administration of erythromycin. Clin. Exp. Med. 2016, 16, 585–592.
53. Trynda‐Lemiesz, L. Paclitaxel–HSA interaction. Binding sites on HSA molecule. Bioorganic Med. Chem. 2004, 12, 3269–3275.
54. Peng, B.; Lloyd, P.; Schran, H. Clinical Pharmacokinetics of Imatinib. Clin. Pharmacokinet. 2005, 44, 879–894.
55. Beumer, J.H.; Pillai, V.C.; Parise, R.A.; Christner, S.M.; Kiesel, B.F.; Rudek, M.A.; Venkataramanan, R.
Human hepatocyte assessment of imatinib drug–drug interactions – complexities in clinical translation. Br.
J. Clin. Pharm. 2015, 80.
56. Di Muzio, E.; Polticelli, F.; Trezza, V.; Fanali, G.; Fasano, M.; Ascenzi, P. Imatinib binding to human serum albumin modulates heme association and reactivity. Arch. Biochem. Biophys. 2014, 560, 100–112.
57. Fitos, I.; Visy, J.; Zsila, F.; Mády, G.; Simonyi, M. Selective binding of imatinib to the genetic variants of human α1‐acid glycoprotein. Biochim. Et Biophys. Acta (Bba) ‐ Gen. Subj. 2006, 1760, 1704–1712.
58. Diasio, R.B.; Harris, B.E. Clinical Pharmacology of 5‐Fluorouracil. Clin. Pharmacokinet. 1989, 16, 215–237, doi:10.2165/00003088‐198916040‐00002.
59. Sułkowska, A.; Równicka, J.; Bojko, B.; Sułkowski, W. Interaction of anticancer drugs with human and bovine serum albumin. J. Mol. Struct. 2003, 651, 133–140.
60. Nix, D.E.; Matthias, K.R.; Ferguson, E.C. Effect of ertapenem protein binding on killing of bacteria.
Antimicrob. Agents Chemother. 2004, 48, 3419–3424.
61. Schmidt, S.; Röck, K.; Sahre, M.; Burkhardt, O.; Brunner, M.; Lobmeyer, M.T.; Derendorf, H. Effect of protein binding on the pharmacological activity of highly bound antibiotics. Antimicrob. Agents Chemother. 2008, 52, 3994–4000.
62. Beer, J.; Wagner, C.C.; Zeitlinger, M. Protein Binding of Antimicrobials: Methods for Quantification and for Investigation of its Impact on Bacterial Killing. Aaps J. 2009, 11, 1.
63. Drug Bank. 5‐Fluorouracil. Available online: https://www.drugbank.ca/drugs/DB00544 (accessed on 10 August 2019).
64. Petitpas, I.; Bhattacharya, A.A.; Twine, S.; East, M.; Curry, S. Crystal structure analysis of warfarin binding to human serum albumin: anatomy of drug site I. J. Biol. Chem. 2001, 276, 22804–22809.
65. Drug Bank. Diazepam. Available online: https://www.drugbank.ca/drugs/DB00829 (accessed on 10 August 2019).
66. Tabish Rehman, M.; U Khan, A. Understanding the interaction between human serum albumin and anti‐
bacterial/anti‐cancer compounds. Curr. Pharm. Des. 2015, 21, 1785–1799.
67. Chinnathambi, S. Underlying the Mechanism of 5‐Fluorouracil and Human Serum Albumin Interaction: A Biophysical Study. J. Phys. Chem Biophys 2016, 6, doi:10.4172/2161‐0398.1000214.
68. Bun, S.S.; Ciccolini, J.; Bun, H.; Aubert, C.; Catalin, J. Drug interactions of paclitaxel metabolism in human liver microsomes. J. Chemother. 2003, 15, 266–274.
69. van Leeuwen, R.W.F.; van Gelder, T.; Mathijssen, R.H.J.; Jansman, F.G.A. Drug–drug interactions with tyrosine‐kinase inhibitors: a clinical perspective. Lancet Oncol. 2014, 15, 315–326.
70. Gambacorti‐Passerini, C.; Zucchetti, M.; Russo, D.; Frapolli, R.; Verga, M.; Bungaro, S.; Tornaghi, L.; Rossi, F.; Pioltelli, P.; Pogliani, E.; et al. α1 Acid Glycoprotein Binds to Imatinib (STI571) and Substantially Alters Its Pharmacokinetics in Chronic Myeloid Leukemia Patients. Clin. Cancer Res. 2003, 9, 625.
71. Diasio, R.B. Sorivudine and 5‐fluorouracil; a clinically significant drug‐drug interaction due to inhibition of dihydropyrimidine dehydrogenase. Br. J. Clin. Pharm. 1998, 46, 1–4.
72. McLeod, H.L. Clinically relevant drug‐drug interactions in oncology. Br. J. Clin. Pharm. 1998, 45, 539–544.