Report No. 57
South Asia Human Development Sector International Comparative Study:
Engineering Education in India April 2013
Discussion Paper Series
Public Disclosure AuthorizedPublic Disclosure AuthorizedPublic Disclosure AuthorizedPublic Disclosure Authorized
Report no. 78182
Report No. 57
South Asia Human Development Sector
International Comparative Study:
Engineering Education in India
April 2013
______________________________________________________________________________
Discussion Paper Series
Discussion Papers are published to communicate the results of the World Bank’s work to the development community with the least possible delay. The typescript manuscript of this paper therefore has not been prepared in accordance with the procedures appropriate to formally edited texts. Some sources cited in the paper may be informal documents that are not readily available.
The findings, interpretations, and conclusions expressed herein do not necessarily reflect the views of the International Bank for Reconstruction and Development / The World Bank and its affiliated organizations, or those of the Executive Directors of the World Bank or the governments they represent.
The World Bank does not guarantee the accuracy of the data included in this work. The boundaries, colors, denominations, and other information shown on any map in this work do not imply any judgment on the part of The World Bank concerning the legal status of any territory or the endorsement or acceptance of such boundaries.
i
Contents
Acknowledgments... iii
Executive Summary ... iv
Acronyms and Abbreviations ... vii
1. Introduction ... 1
2. Sectoral Background ... 3
3. Previous Studies on International Engineering Education ... 6
4. Scope of the Study ... 8
5. Survey Methodology ... 9
6. Findings... 10
7. Conclusion ... 23
Appendix A. System and Trends in Engineering Education ... 25
The United States ... 25
The United Kingdom ... 31
Japan ... 35
Russian Federation ... 44
Brazil ... 50
China ... 55
Appendix B. The Top Five Disciplines in Engineering ... 59
Appendix C. Research and Commercialization Outputs: Corporate Patents ... 60
Appendix D. Indicators: Data Collection Status ... 61
Appendix E. Data Sources and Data Year ... 63
Institutions... 63
Students ... 63
Faculty... 65
Graduates ... 65
References ... 67
ii
Figures
Figure 1: Average Number of Institutions Providing Engineering Degrees... 10
Figure 2: Number of Engineering Students per Institution ... 10
Figure 3: Share of Engineering Students among All Students in Higher Education ... 11
Figure 4: Number of Engineering Students, Including Undergraduates and Postgraduates... 11
Figure 5: Number of Engineering Students, per Million Population ... 12
Figure 6: Share of Engineering Students in Public and Private Institutions ... 12
Figure 7: Share of Engineering Students, by Level of Education... 13
Figure 8: Number of Engineering Faculty ... 13
Figure 9: Number of Engineering Faculty per Institution ... 14
Figure 10: Student-Faculty Ratio in Engineering Education ... 14
Figure 11: Average Qualifications of Faculty ... 15
Figure 12: Number of Graduates, by Level of Education ... 16
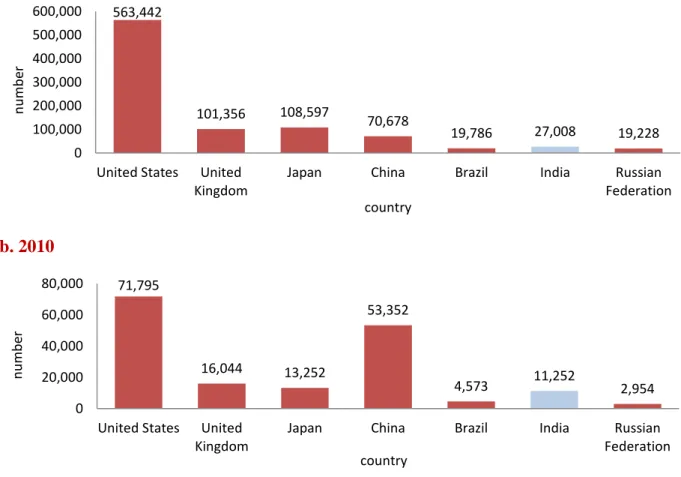
Figure 13: Number of Publications on Engineering, 2000 and 2010 ... 17
Figure 14: Cumulative Number of Citations of Articles on Engineering, 2000 and 2010 ... 18
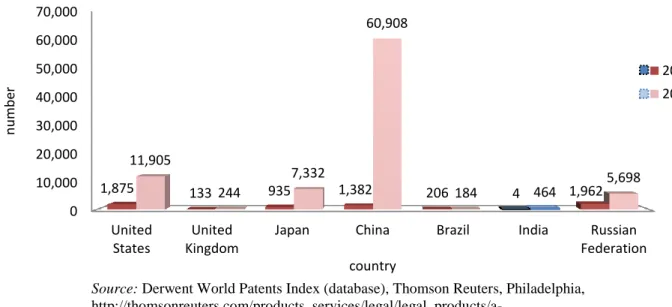
Figure 15: Total Volume of Patents at Engineering Institutions ... 19
Figure 16: The Volume of Inventions (Basic Patents) at Engineering Institutions ... 20
Figure 17: Number of Articles on Engineering per 100 Faculty Members, 2011 ... 21
Figure 18: Number of Citations to Articles on Engineering per 100 Faculty Members, 2010... 21
Figure 19: Volume of Inventions (Basic Patents) at Engineering Schools per 100 Faculty, 201022 Figure 20: The Governance Structure of National Universities, Japan ... 36
Figure 21: Prestige of Engineering Professions, Russian Federation, 2009 ... 46
Figure 22: Students in Engineering among All University Students, by Degree Level, China, 1997–2009... 56
Figure 23: Corporate Patents, Total ... 60
Figure 24: The Volume of Inventions (Basic Patents) among Corporate Patents ... 60
Figure 25: Ratio of Basic Patents to Total Patents, Corporations... 60
Tables Table 1: Types and Number of Higher Education Institutions, India, 2011 ... 3
Table 2: Earned Engineering and Technology Degrees, United States, 2002–11 ... 25
Table 3: Number of First Degrees Achieved in STEM, All Domiciles, 2002/03–2009/10... 32
Table 4: Typical Curriculum, Small Science and Engineering University ... 42
Table 5: Number of Students in Engineering Programs, Russian Federation, 2010 ... 44
Table 6: The Top Five Disciplines among Undergraduates ... 59
Table 7: The Top Five Disciplines among Graduate Students ... 59
Table 8: Students, Faculty, and Institutions ... 61
Table 9: Education Outputs ... 61
Table 10: Education Expenditure... 62
Table 11: Research and Commercialization Output ... 62
Table 12: Data on Institutions ... 63
Table 13: Data on Students ... 64
Table 14: Data on Faculty ... 65
Table 15: Data on Graduates and Degrees ... 66
iii
Acknowledgments
The study on which this report is based has been led by Hiroshi Saeki and Saori Imaizumi. The report has been prepared by collecting data on Brazil, China, India, Japan, the Russian Federation, the United Kingdom, and the United States.
We acknowledge the significant contributions made by data providers in each country: Vanderli Fava de Oliveira (Universidade Federal de Juiz de Fora) and Luiz Carlos Scavarda do Carmo (Pontifical Catholic University of Rio de Janeiro) for Brazil; Prashant Loyalka (Stanford University) and Xiaoyan Liang and Shuang Chen (both at the World Bank) for China; Venkatesh Kumar (consultant at the World Bank) and S. S. Mantha (All India Council for Technical Education) for India; the Ministry of Education, Culture, Sports, Science, and Technology and Tsutomu Kimura (National Institution for Academic Degrees and University Evaluation) for Japan; Natalia Kovaleva and Nikolai B. Schugal (both of the National Research University Higher School of Economics) for Russia; Coralie Mace (Higher Education Statistics Agency) for the United Kingdom; and Brian Yoder (American Society for Engineering Education) and Michael Gibbons (formerly with the American Society for Engineering Education, currently at the National Science Foundation) for the United States.
Izumi Yamasaki (Columbia University) and Thomson Reuters provided the majority of the cross-country data on research and commercialization, and Seo Yeon Hong (World Bank) carried out research on cross-country education expenditure data. During the report preparation stage, we received significant guidance from Andreas Blom on concept design, indicator selection, and the data collection methodology. We have also received support from the World Bank colleagues, Kirill Vasiliev and Dmitry Chugunov for data collection and the identification of experts for data on Russia. During the review stage, the team received useful feedback and guidance from Amit Dar, Tobias Linden, Tara Beteille, and Richard Hopper, and editing by Robert Zimmermann. We would also like to thank Karthika Radhakrishnan-Nair for supporting the logistical part of the study.
Finally, we would like to express our special thanks to the Department of Higher Education in the Ministry of Human Resource Development, government of India for its continued support and the U.K. Department for International Development for its financial support through a trust fund.
iv
Executive Summary
The government of India and state governments there have undertaken reforms in higher education. In particular, the engineering education sector has launched reform initiatives within the current legislative framework through the Technical Education Quality Improvement Program (TEQIP). Participating institutions have been selected through a norm-based funding mechanism after meeting criteria for the reforms, which promote, for instance, autonomy, the decentralization of the financial framework, the establishment of a functioning board of governors, and the strengthening of partnerships with the private sector. The working group report on technical education for the government’s 12th Five Year Plan also proposes ambitious, but feasible reforms in the sector that, over the 10 years, involve, for example, increasing the number of PhD students by 10-fold and the number of faculty members many times over, while encouraging more autonomy in colleges by relying less on the affiliation system (MHRD 2011a).
Given this dynamic momentum in engineering education in India, the sector is expected to receive a significant boost over the next few years. It is therefore timely to assess the position of the sector in India within the international context. This study aims to provide the Ministry of Human Resource Development (MHRD), the All India Council for Technical Education (AICTE), and relevant stakeholders with key facts, reliable data, and international comparisons to establish a common ground and benchmark for the current engineering education system.
Thus, the study is not intended to supply concrete policy recommendations, but, rather, to serve as a foundation to promote discussions on education in engineering. The government–World Bank team selected Japan, the United Kingdom, and the United States from among the members of the Organisation for Economic Co-operation and Development (OECD), as well as Brazil, the Russian Federation, India, and China (the BRICs) for comparative purposes for this study.
Using the latest data on each country (mostly from 2011), the study presents an analysis of the institutions, students, faculty, education outputs, and research and commercialization outputs in engineering education in India. It focuses on institutions providing engineering education and offering at least bachelor’s degrees or above, while excluding polytechnics.
Because the study takes a snapshot of education in engineering without examining the evolution of the sector, the result does not necessarily reflect all the efforts of the government of India in engineering education. However, the commitment of the MHRD and the states has clearly generated major improvements, especially in the area of publishing.
Altogether, the five major findings presented here may serve as the basis for discussions among policy makers and stakeholders to make concrete and optimal policy interventions in the sector in the future.
The first finding involves the large number of engineering institutions in India. The number more than doubled within only five years, from 1,500 in 2006 to 3,400 in 2011, mainly because of the increase in the number of private institutions. Even in China, the number of institutions offering engineering degrees is only 570. These 3,400 Indian institutions accommodate 1.5 million future Indian engineers. The mushrooming engineering institutions in India have resulted in a low
v
number of students and faculty per institution: 450 and 20, respectively. This finding supports the approach of the 12th Five Year Plan, whereby the expansion of existing engineering institutions is a priority over the creation of new institutions.
Second, the total number of engineering students in India exceeds 1.5 million, which is about the same as Brazil; these two countries are behind only China in the total number of students.
Moreover, the proportion of students in higher education in India who are studying engineering is similar to the corresponding proportions in the other countries studied (though higher than the proportions in the United Kingdom or the United States). However, there are only 1,290 engineering students per million population in India, which is the lowest such ratio among the countries examined in this study. Given that industries in India are demanding more engineers (including more with enhanced qualifications), improved access to engineering education is required. Policy makers may need to consider ways to keep the number of engineering institutions at least constant, while strengthening the enrollment capacity of these institutions.
Third, the percentage of faculty with PhDs is low in India. Although there are no official data available on faculty in India, institutions participating in the Second Phase of the Technical Education Quality Improvement Program (TEQIP-II) in Andhra Pradesh show that only about 20 percent of full-time faculty hold PhDs, which is the lowest among the countries in the comparison. Given that Andhra Pradesh is one of the most advanced states in engineering education and that the institutions participating in the TEQIP-II are highly selective, the country average is most likely much less. Poor faculty qualification stems from the low number of students pursuing PhDs. The share of engineering students with PhDs among all engineering students is less than 1 percent in India. The low number of faculty with PhDs is one of the obstacles to improving the research capacity of the country. Policy makers would need to consider both enhancing the qualifications of current faculty, most of whom have only master’s or bachelor’s degrees, while incentivizing current students to pursue PhD degrees in engineering.
Although not specifically aiming at education in engineering, the 12th Five Year Plan seeks to increase the country’s enrollment capacity by another 10 million, among whom 5.7 million are to be enrolled through the accelerated expansion of postgraduate and doctoral programs. This demonstrates that the direction of policy is following the findings.
Fourth, there are limited reliable information resources available on education in engineering.
This makes it difficult for policy makers, researchers, and stakeholders to conduct robust and meaningful analysis of the engineering education system. Establishing a comprehensive management information system in engineering education is indispensable if policy makers are to make strategic and evidence-based decisions. Indeed, the 12th Five Year Plan concurs with this view in that it emphasizes the importance of participation in international surveys and evaluations to compare Indian higher education globally.
Fifth, research outcomes in India, including research papers, research reference citations, and patents, have been improving and increasing in number despite the shortage of faculty with PhDs.
However, the absolute number remains low. In particular, the number of patents originating in India is the lowest among the countries in the comparison. This seems to reflect the want of university-industry partnerships in the country. The 12th Five Year Plan expresses this lack by highlighting that, within the context of the plan, a focus will be on research that is linked to the
vi
national development agenda. The plan seeks to undertake a systematic approach to strengthening the scale and scope of the partnership between academia and industry. The plan also acknowledges the importance of international research collaboration.
vii
Acronyms and Abbreviations
ABET Accreditation Board for Engineering and Technology (United States) AICTE All India Council for Technical Education (India)
ASEE American Society for Engineering Education (United States) BRIC Brazil, the Russian Federation, India, and China
CAPES Coordination for Enhancement of Higher Education Personnel (Brazil) CNI National Confederation of Industry (Brazil)
DWPI Derwent World Patents Index GER Gross Enrollment Ratio
HESA Higher Education Statistics Agency (United Kingdom) ISCED International Standard Classification of Education
MEXT Ministry of Education, Culture, Sports, Science, and Technology (Japan) MHRD Ministry of Human Resource Development (India)
NAE National Academy of Engineering (United States)
OECD Organisation for Economic Co-operation and Development OSTP Office of Science and Technology Policy (United States) STEM Science, Technology, Engineering, and Mathematics TEQIP Technical Education Quality Improvement Program (India) UGC University Grants Commission (India)
USE Unified State Examination (Russian Federation)
Note: All dollar amounts are U.S. dollars ($) unless otherwise indicated.
1
1. Introduction
The central and state governments of India have been pursuing several reforms in the higher education sector. The main efforts so far have centered on legislative changes at the central level that are currently being considered in Parliament.1 In engineering education, the government has already embarked on several reforms within the current legislative framework. The central and state governments are encouraging engineering institutions to take the initiative on reform through the Technical Education Quality Improvement Program (TEQIP), which is currently in the second phase (TEQIP-II).2 Institutions willing to take on the challenges of reform are selected for the program through a norm-based funding mechanism.3 Engineering institutions that are selected undertake to promote autonomy, decentralize the financial framework (for example, decision making on funds and generated revenues occurs at the institutional level), conduct pedagogical training, establish a functioning board of governors, and so on. The goal of these initiatives is to raise the quality of education, enhance the qualifications of faculty, increase and enhance research outputs, and, most importantly, improve educational standards and the employability of students. This will help India to accelerate the growth of the economy, develop a high-quality labor force, and reduce the skill shortages being faced in the country.
The government has exhibited other ambitious visions in India’s 12th Five Year Plan (2012–17).
The working group report on technical education proposes, among other initiatives, to increase the number of PhD students by 10-fold and the number of faculty members several times over (an additional 16,000 faculty members) in the country’s system of institutes of technology within 10 years (MHRD 2011a). It proposes that more autonomy should be encouraged among colleges by relying less on the college affiliation system. The report also recommends that state and private engineering institutions should be upgraded and expanded.
Given this dynamic momentum, the engineering education sector in India is expected to receive a significant boost over the next few years. It is therefore timely to take stock and review the position of the sector internationally. This study thus aims to provide the Ministry of Human Resource Development (MHRD), the All India Council for Technical Education (AICTE), and relevant stakeholders with key facts, reliable data, and the results of relevant international comparisons to establish a common ground and to help in measuring the performance of the current engineering education system in India. This would help raise the quality of the public debate on this topic. The study does not seek to provide specific policy recommendations, but, rather, to serve as a foundation to promote discussion on engineering education in India. The government–World Bank team has selected countries among the members of the Organisation for Economic Co-operation and Development (OECD), as well as Brazil, the Russian Federation,
1 The measures include the National Accreditation Regulatory Autonomy for Higher Education Institutions Bill, the Higher Education and Research Bill, the Foreign Education Institutions Bill, and the Prohibition of Unfair Practice in Technical Educational Institutions, Medical Educational Institutions, and University Bill.
2 A government program, TEQIP consists of three phases. It is financed jointly by the government of India and the World Bank. The total cost of the first and second phases are $315 million and $500 million, respectively. The total number of participating institutions was 127 in the first phase and is approximately 190 in the second phase. The first phase was successfully completed in 2009, and the achievement of the project objective was rated substantial by the Independent Evaluation Group of the World Bank (World Bank 2011a). The second phase is expected to be completed in 2014.
3 This is equivalent to a competitive funding mechanism.
2
India, and China (the BRICs), for a comparison of basic information on engineering education.
For this purpose, the government wished to select leading countries in engineering education, at least in terms of research outputs. Hence, Japan, the United Kingdom, and the United States were selected from among the OECD countries. The government also recognizes the importance of lessons that may be learned from the other BRIC countries, and these countries were therefore selected for the comparison.
This report is organized as follows. The next section briefly discusses the background of both general higher education and engineering education in India. Section 3 reviews earlier comparative studies on international engineering education. Section 4 describes the scope of the study. Section 5 explains the methodology of data collection and identifies the data sources.
Section 6 outlines the analysis of the collected data and the findings. Section 7 presents conclusions. The appendixes describe the engineering education systems of the various countries examined in the study, the related challenges and opportunities, and the future policy goals in each country.
3
2. Sectoral Background
Higher Education in India
The higher education system in India is one of the largest in the world.1 It has expanded exponentially since 1990. In 1990, there were 190 universities and 7,350 colleges, and the total enrollment in higher education was 4,925,000 (UGC 2012). As of 2011, there were 610 universities and 31,320 colleges with 14,624,990 enrollments (UGC 2011a).2 India’s 12th Five Year Plan is expected to continue to assign priority to the expansion of the higher education system, taking into account equity and quality, to achieve a 25 percent gross enrollment ratio (GER) at the national level by 2017.3
Types of Higher Education Institutions and the Related Regulations
There are seven types of higher education institutions in India: (1) central universities, (2) state universities, (3) private universities, (4) deemed-to-be universities, (5) institutions of national importance (such as the Indian Institutes of Technology), (6) institutions under a state legislature act, and (7) colleges. Table 1 describes the types of higher education institutions and the number of each.
Table 1: Types and Number of Higher Education Institutions, India, 2011
totals
Types of Institution Description Number
Central university A university established or incorporated through a central act 43 State university A university established or incorporated through a provincial or state act 289 Private university
A university established through a state or central act by a sponsoring body such as a public trust, a company registered under Section 25 of the Companies Act, 1956, or a society registered under the Societies Registration Act, 1860 or any other corresponding law in force in a state
94
Deemed-to-be university
Commonly known as a deemed university, this refers to a high-performing institution that has been so declared by the central government under Section 3 of the University Grants Commission Act, 1956
130 Institution of national
importance and other institutionsa
An institution established by act of Parliament and declared an institution of national
importance 50
Institution under a
state legislature act An institution established or incorporated through a state legislature act 5 Colleges Colleges award degrees through the universities with which they are affiliated (Agarwal
2009). 31,324
Total 31,935
Sources: MHRD 2011a; UGC 2011b.
Note: According to the 12th Five Year Plan, there were 46,430 institutions in 2011–12 (Planning Commission 2012).
a. “Other institutions” include the Indian Institutes of Science Education and Research, the National Institute of Fashion Technology, the Rajiv Gandhi Institute of Petroleum Technology, and the Jawaharlal Nehru Institute of Post-Graduate Medical Education and Research.
1 Higher education institutions include research institutions, as well as universities and colleges offering diplomas, certificates, and bachelor’s, master’s, and PhD degrees.
2 The enrollment figure is for 2009–10.
3 The GER in 2009–10 was 15 percent (MHRD 2011b).
4
Several entities are involved in the regulatory framework, including state governments, national- and state-level professional councils, and affiliating universities. In particular, the University Grants Commission (UGC) plays an important role in regulating general higher education institutions as the apex body for the establishment and coordination of standards in general higher education. The UGC established the National Assessment and Accreditation Council in 1994 to accredit general higher education institutions and evaluate the quality of institutions and programs. The council evaluates institutions and programs based on predetermined criteria through self-assessment and peer review. Accreditation is currently voluntary and valid for five years.
Engineering Education
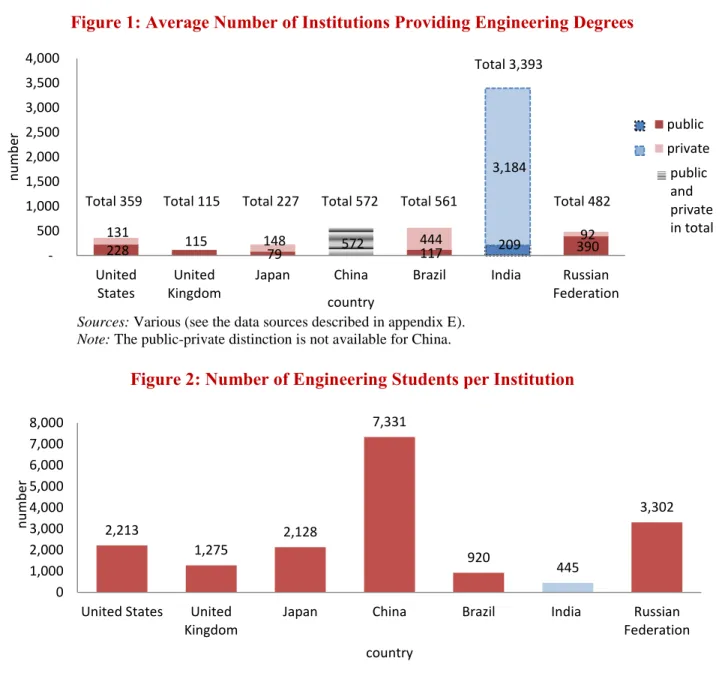
The unprecedented expansion of the higher education system in India has arisen partly because of the substantial growth of engineering education. The number of engineering institutions doubled in merely five years, from 1,510 in 2006 to 3,390 in 2011. Accordingly, the total number of students enrolled in engineering education increased from 795,120 in 2004–05 to more than 1.5 million in 2009–10 (UGC 2004, 2011a). The main component in the significant expansion in engineering education is private institutions, which accounted for about 94 percent of engineering institutions in 2011.4
Types of Engineering Education Institutions and Related Regulations
In terms of types of institutions, the engineering education system follows the general higher education system (see Table 1). While general higher education is regulated by the UGC, engineering institutions are regulated by the AICTE. The AICTE regulates technical education institutions involved in education in engineering and technology, architecture and town planning, management, pharmacy, applied arts and crafts, and hotel management and catering technology (AICTE 2007). The AICTE established the National Board of Accreditation to evaluate technical education institutions. Currently, accreditation is voluntary, and it lasts three to five years, depending on a satisfactory assessment outcome.
Challenges Facing India’s Engineering Education System
The 12th Five Year Plan working group report on technical education emphasizes the importance of three areas: expansion, equity, and excellence (or quality) (MHRD 2011a). This selection reflects the challenges facing the sector. First, expansion implies the issue of access to engineering education. While engineering institutions and student enrollment have significantly increased in engineering education, access to engineering education remains limited. For instance, the latest available comparable figures (mostly from 2010) show that the GER in higher education in India in 2011-2012 is 17.9 percent, including open and distance learning, compared to 26 percent in Brazil and China and 76 percent in Russia.5 Furthermore, per million population,
4 There were 3,393 engineering institutions in 2011, of which 3,184 were private (Sanyal 2012).
5 See "Higher Education," Institute for Statistics, United Nations Educational, Scientific, and Cultural Organization (accessed 2012), http://www.uis.unesco.org/Education/Pages/tertiary-education.aspx. The figures represent the most recent comparable data available. The 12th Five Year Plan estimates the GER for India in 2011-2012 at 17.9 percent, including open and distance learning. This figure is based on the 18-23 age group, which is slightly different from
5
the number of engineering students in India, including both undergraduate and postgraduate students, is 1,290, which is the lowest rate among all the countries in our comparison.6
Second, like all other countries, there is unequal access in terms of gender, geography (urban versus rural residence), social groups, and household welfare. For example, in India, the inequality in household welfare is substantial: the completion rate in tertiary education, which includes engineering education, among 30–34-year-olds in the richest quintile was about 28 times higher than that among the same age-group in the poorest quintile in 2010.7
Finally, excellence mirrors the issue of quality, which stems from various aspects of the engineering education system. Only about 25 percent of technical graduates are suitable for employment in the offshore IT industry, and 64 percent of employers hiring fresh engineering graduates are only somewhat satisfied or worse with the quality of the new hires (NASSCOM and McKinsey 2005; Blom and Saeki 2011). The sector suffers a severe shortage in high-quality faculty. It is estimated that India produces 1,000 PhDs in engineering per year (World Bank 2010). This compares with the PhD production of 9,500 in the United States and 17,000 in China in 2010. It is widely recognized that the affiliation system often represents an impediment to overall quality development in engineering in India because affiliated colleges do not fully exercise academic, financial, and management autonomy under the system. Thus, one university has more than 600 affiliated colleges (World Bank 2011b). Because of the large number of affiliated colleges, the quality in planning, regulation, and supervision is usually not maintained by the affiliating universities. As a result, curricula are often obsolete, the skills taught are usually not matched with the demand or local needs, and the number and quality of faculty are frequently not sufficient.
the UNESCO definition, which includes the 5-year age group starting from the official secondary school graduation age. However, the figure for India is higher as of May 2013, which is 18.65 percent, according to AICTE.
6 The numbers in our comparison countries are Brazil, 2,648; China, 3,149; Japan, 3,791; Russia, 11,227; the United Kingdom, 2,356; and the United States, 2,570.
7 “NSS 66th Round (July 2009–June 2010),” National Sample Survey Office, Ministry of Statistics and Program Implementation, New Delhi, http://mospi.nic.in/Mospi_New/site/inner.aspx?status=3&menu_id=31.
6
3. Previous Studies on International Engineering Education
While some comparative studies on general higher education have been conducted, it is rare for studies to focus specifically on engineering education or on an international perspective on the sector. Among the available resources, we have identified three quantitative and qualitative studies, and these have helped shape this report.
The first study focuses on China, India, and the United States and contains both quantitative and qualitative analysis of the production and utilization of engineers and technology specialists in the three countries. The study, “Getting the Numbers Right: International Engineering Education in the United States, China, and India,” was conducted by Gary Gereffi, Vivek Wadhwa, Ben Rissing, and Ryan Ong (Gereffi et al. 2008). The study relies on a mixed methodology; it uses statistical analysis, interviews, and field research. For quantitative analysis, the study utilizes a cross-national data set on the number of engineering, computer science, and information technology degrees granted from 1994 to 2006, including bachelor’s, master’s, and doctoral degrees. The qualitative analysis was carried out through an examination of the educational policies of leading universities, interviews with executives and recruiters at multinational engineering firms, and assessments of the results of a 2005 survey by the McKinsey Global Institute, as well as other available literature (Farrell et al. 2005). The study concludes that the comparison is challenging because of variations in the definition of engineering from one country to another and, in some cases, inaccuracies and inconsistencies in the data. However, despite the challenges, the study found that the number of engineers in China and India is increasing more rapidly relative to the United States. In terms of the supply of engineers, through a top-down policy change adopted around 1990 in China and a bottom-up policy change in India, including a huge increase in the number of private institutions, both countries succeeded in raising university enrollments in engineering programs. On the demand side, in China, growth in the production of medium- and high-technology products, such as air conditioners and mobile telephones, in addition to traditional industries, including textiles, apparel, and footwear, has fueled the demand for engineers. In India, the demand for engineers has been augmented by the growth in the software and business process outsourcing industries. In both countries, multinational corporations have increased the number of research and development centers and the amount of foreign direct investment. An expansion in local firms in knowledge-intensive industries has also attracted high-quality engineers. Thus, the demand for engineers has risen, even though engineers are unemployed in both countries because of their lack of globally competitive qualifications. The study is based on a clear and detailed methodology in terms of data definition and data collection. It also provides a clear definition of the term engineer in each country and reflects significant effort in the identification of accurate data sources. We have tried to emulate these features in our study.
The second study is a qualitative analysis that provides a snapshot of current international comparative activities and experiences in the United Kingdom, an overview of the range of available resources to conduct comparative analysis, and proposals for future approaches to meet the needs of institutions of higher education in this area (PA Consulting Group 2011). The study was commissioned by the U.K. Higher Education Statistics Agency (HESA), conducted by PA Consulting Group, and published on October 20, 2011 under the title “International Benchmarking in U.K. Higher Education.” The objective of the study was to extend the previous benchmarking report by HESA, which had focused on institutional operations, emphasizing the
7
potential benefits of benchmarking for improving institutional efficiency and utilizing intranational data. Developing on the foundation of this previous study, the new study focuses on a review of international comparisons of the performance and the operations of international benchmarking to assess the potential for learning from other higher education systems. The methodology of the study is based on literature reviews and interviews among planning officers and other staff at U.K. universities that were chosen as samples. The findings show that international benchmarking is a relatively low priority among almost all the institutions that were the subject of the interviews. While most institutions collect and review comparative data on their international performance, few use them systematically in planning or management processes. Even if they use the data, they use them only in specific areas, mainly either detailed analyses of research performance or assessments of the perceptions of their international students.
Some institutions use international institutional data as a tool to help identify potential research and teaching collaborators abroad. Others also use overseas market data and business intelligence resources to support decisions about a potential expansion into particular markets.
Such examples of the use of benchmarking could be a reference for India. The research conducted for this second study was useful to us in identifying data sources and developing ideas for the eventual practical application of our international benchmarking study as a tool to improve engineering education in India.
Finally, EngineeringUK has conducted a quantitative and qualitative analysis on the engineering industry through a holistic approach and compiled a report, EngineeringUK 2011: The State of Engineering (Kumar and Randerson 2011). The report uses secondary data and analyzes both the demand side and the supply side of engineering, including government policy, employer perspectives, research and innovation, perceptions on engineering, employment outcomes, and engineering education, ranging from high school and higher education to vocational programs.
While not international, the study provides key data for rigorously analyzing the situation of the engineering industry in the United Kingdom. In the area of research and innovation, the report provides information on the annual growth in the number of publications, in spending on research and development as a share of gross domestic product (which is comparable to the corresponding spending in other G-8 countries), and research and development expenditure by sector and country. For engineering education, data on gender- and subject-based school enrollments, the number of applicants, the number of graduates, employment following graduation, and salaries are available according to the level of educational attainment. For employability and skills, data on employer satisfaction and employment rates are provided. The analysis concludes that there is a growing demand for engineers, especially in the manufacturing sector, but that the supply of engineers is not sufficient. It also finds that the salaries of engineers are rather competitive; thus, more engineers should be produced in the future, especially if the issue of the lack of teachers is addressed. This report forms a basis for the section on the U.K.
engineering education system of our study that is described in appendix A.
8
4. Scope of the Study
The countries included in our study are Brazil, China, India, Japan, Russia, the United Kingdom, and the United States. The focus of the study is the collection of basic, but important statistical information on engineering education in these countries. The original intention was to collect data on four areas, each of which is associated with multiple indicators: (1) students, faculty, and institutions (26 indicators); (2) education outputs (21 indicators); (3) education expenditures (3 indicators); and (4) research and commercialization outputs (14 indicators). In practice, we could not collect sufficient data to make meaningful comparisons on education expenditure. Most of the data available on this area refer only to higher education, but not specifically to engineering education. In addition, depending on the country, detailed breakdowns of the data are not available. Thus, our study compares only basic data on engineering education.
Differences in education systems, data availability, data definitions, and the timeliness of data collection also impose limitations on the ability of our study to provide a thorough comparison across the countries. In some cases, if data are not available, we have calculated estimates.
The study does not cover other important aspects of engineering education such as curricula, employability, pedagogy, learning outcomes and assessments, and so on. Building on this report, these important aspects might be a fruitful area of future research.
9
5. Survey Methodology
We have collected data through consultations with professors, researchers, and experts in different countries. Details on the indicators and the status of data collection on the indicators are listed in appendix D. In this study, we define engineering as mechanical, civil, electrical, and aerospace engineering and other types of engineering that are included within the engineering discipline as defined at each institution under examination. In some countries, computer engineering is included in the computer science discipline. The study thus covers all education disciplines in which the term engineering is included in the name of the discipline; thus, for example, the number of students and faculty in the computer engineering subdiscipline is also covered. The sources for the data on students, faculty, institutions, and education outputs are industry experts, ministry websites, and nonprofit statistics organizations focusing on higher education and engineering education. Data on research and commercialization outputs have been collected through Thomson Reuters and the Web of Science, including the Arts and Humanities Citation Index, the Science Citation Index Expanded, and the Social Sciences Citation Index databases.8 The data definitions, data sources, and data years are described in appendix E.
8 Web of Science (database), Thomson Reuters, Philadelphia,
http://thomsonreuters.com/products_services/science/science_products/a-z/web_of_science/.
10
6. Findings
Institutions
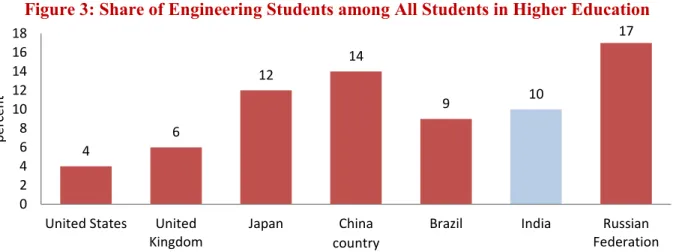
India has the greatest number of institutions relative to other countries (Figure 1). As discussed in section 2, the number of engineering institutions in India doubled between 2006 and 2011, from around 1,500 to 3,400; around half of these are unaided private institutions. However, India shows the lowest number of engineering students per institution among the countries in our comparison (Figure 2). The challenge facing small institutions is their limited financial resources whether from government funds or student fees. Thus, small institutions encounter difficulties in maintaining investments in the necessary upgrades in faculty skills and equipment, which are usually particularly expensive in engineering. It is also difficult for small institutions to form a critical mass of education professionals to provide support for other quality improvements.
Figure 1: Average Number of Institutions Providing Engineering Degrees
Sources: Various (see the data sources described in appendix E).
Note: The public-private distinction is not available for China.
Figure 2: Number of Engineering Students per Institution
Sources: Various (see the data sources described in appendix E).
228 115
79 572
117 209 390 131
148 444
3,184
92 -
500 1,000 1,500 2,000 2,500 3,000 3,500 4,000
United States
United Kingdom
Japan China Brazil India Russian
Federation
number
country
public private
public and private in total Total 115 Total 227 Total 572 Total 561
Total 3,393
Total 482 Total 359
2,213
1,275
2,128
7,331
920 445
3,302
0 1,000 2,000 3,000 4,000 5,000 6,000 7,000 8,000
United States United Kingdom
Japan China Brazil India Russian
Federation
number
country
11 Students
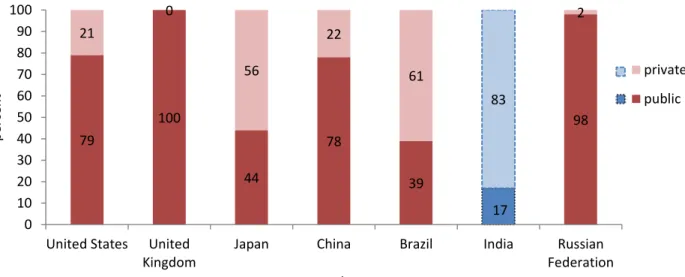
The share of engineering students among all students in higher education is around 10 percent in India, 14 percent in China, 12 percent in Japan, and 17 percent in Russia (Figure 3). The number of engineering students, including undergraduate and postgraduate students, is about 1,500,000 in India, which is less than the 4,200,000 in China, but about the same as Russia’s 1,600,000 (Figure 4). However, relative to the total population of the country, the number of engineering students is actually the lowest in India (Figure 5). Indeed, the information technology sector, for instance, has reported shortages in qualified workforce (Ferrari and Dhingra 2009). The road sector, too, faces severe shortages in qualified workforce. The sector needs to increase hiring by at least two or three times the 2008 level of 6,000–7,000 engineers and diploma holders joining the sector workforce (World Bank 2008). Thus, India seems to need more engineering students.
Figure 3: Share of Engineering Students among All Students in Higher Education
Sources: Various (see the data sources described in appendix E); India: data of 12th Five Year Plan; higher education enrollment data: Custom Tables (database), 2009, Data Center, Institute for Statistics, United Nations Educational, Scientific, and Cultural Organization, Paris,
http://stats.uis.unesco.org/unesco/TableViewer/document.aspx?ReportId=136&IF_Language=eng&BR_To pic=0.
Note: Total enrollment in tertiary education includes public and private institutions and full- and part-time students. Students include undergraduate and postgraduate students.
Figure 4: Number of Engineering Students, Including Undergraduates and Postgraduates
Sources: Various (see the data sources described in appendix E).
4
6
12
14
9 10
17
0 2 4 6 8 10 12 14 16 18
United States United Kingdom
Japan China Brazil India Russian
Federation
percent
country
794,295 146,610 483,120
4,193,129
516,287
1,510,762 1,591,441 0
1,000,000 2,000,000 3,000,000 4,000,000 5,000,000
United States United Kingdom
Japan China Brazil India Russian
Federation
number
country
12
Figure 5: Number of Engineering Students, per Million Population
Sources: Various (see the data sources described in appendix E); population data: World Bank 2010.
Note: Students include undergraduate and postgraduate students.
In India, a significant proportion of students are enrolled in private engineering institutions (80 percent) relative to public institutions (Figure 6). The other countries examined in this study, except Brazil (61 percent) and Japan (56 percent), have more students in public institutions.
Figure 6: Share of Engineering Students in Public and Private Institutions
Sources: Various (see the data sources described in appendix E); data on Brazil, China, and India are estimates.
Note: Students include undergraduate and postgraduate students.
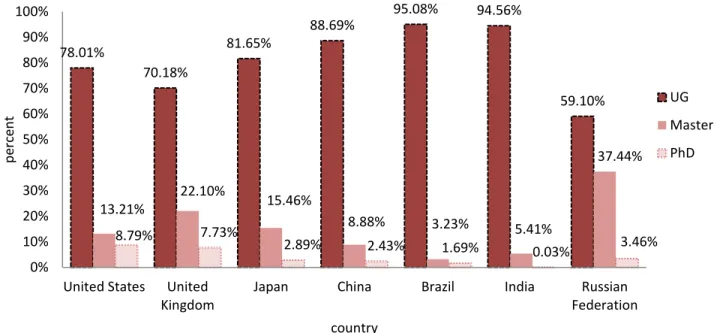
The proportion of students enrolled in PhD programs is less than 1 percent in India; this is the smallest share among the countries in our comparison (Figure 7). In addition, the proportion of students enrolled in master’s programs is 5.4 percent, which is the smallest share except for Brazil. This is a major cause of the shortage in India of faculty with higher-level degrees (see below).
2,570 2,356
3,791
3,149 2,648
1,290
11,227
0 2,000 4,000 6,000 8,000 10,000 12,000
United States United Kingdom
Japan China Brazil India Russian
Federation
number
country
79
100
44
78
39
17
98 21
0
56
22
61
83
2
0 10 20 30 40 50 60 70 80 90 100
United States United Kingdom
Japan China Brazil India Russian
Federation
percent
country
private public
13
Figure 7: Share of Engineering Students, by Level of Education
Sources: Various (see the data sources described in appendix E); data on India and Russia are estimates.
Note: Students include undergraduate and postgraduate students.
Faculty
Currently, there are no official data available on the number of engineering faculty in India.
Based on the faculty-student ratio in general higher education, which is 1 to 24, one might estimate that there are 63,000 engineering faculty (MHRD 2011b) (Figure 8). Engineering faculty are more difficult to recruit than faculty in general higher education because potential faculty with higher degrees readily find employment in the corporate sector. It is therefore likely that the ratio of faculty to students is higher in engineering than in higher education as a whole, and, so, the number of faculty is likely to be less than the 63,000 estimate above.
Figure 8: Number of Engineering Faculty
Sources: Various (see the data sources described in appendix E).
78.01%
70.18%
81.65%
88.69%
95.08% 94.56%
59.10%
13.21%
22.10%
15.46%
8.88% 3.23% 5.41%
37.44%
8.79% 7.73%
2.89% 2.43% 1.69% 0.03% 3.46%
0%
10%
20%
30%
40%
50%
60%
70%
80%
90%
100%
United States United Kingdom
Japan China Brazil India Russian
Federation
percent
country
UG Master PhD
41,053
21,475 26,056
283,440
34,949
62,948
107,529
0 50,000 100,000 150,000 200,000 250,000 300,000
United States United Kingdom
Japan China Brazil India Russian
Federation
number
country
14
The faculty shortage has been a topic of discussion within the engineering education system in India for a long time. The number of engineering faculty seems comparable among the countries examined in this study. The issue in India seems to be the exceptionally large number of engineering institutions, which leads to the low numbers of students and faculty per institution.
Assuming that the number of faculty is close to the true situation, the number of engineering faculty per institution is quite low, at 19 (Figure 9).
Figure 9: Number of Engineering Faculty per Institution
Sources: Various (see the data sources described in appendix E).
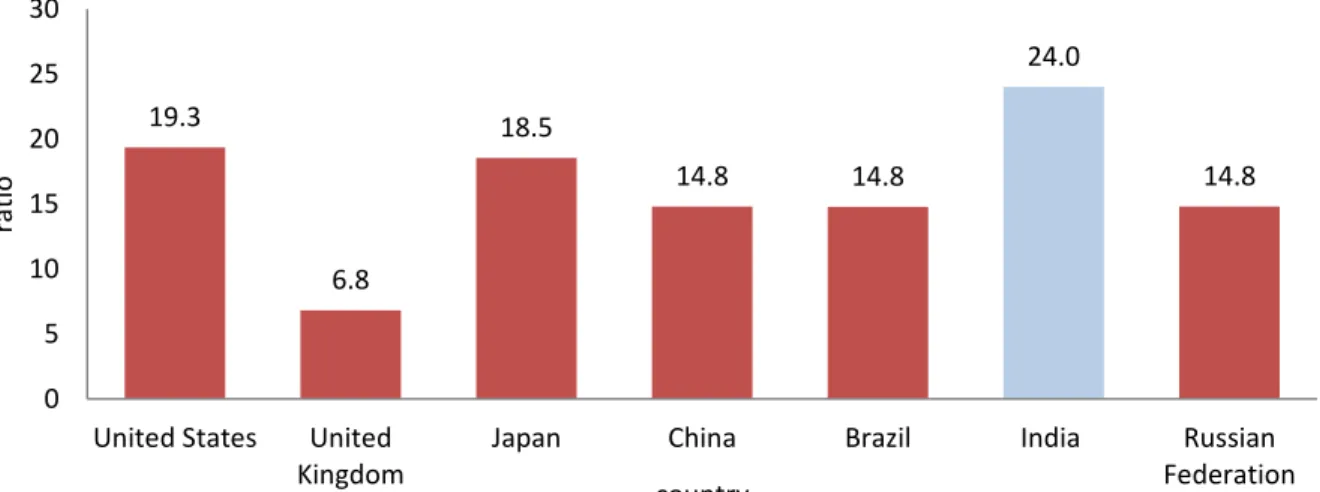
Even a conservative estimate of the ratio of students to faculty in engineering education in India is the highest such ratio among the countries in our comparison (Figure 10). Given that the AICTE norm suggests that the faculty-student ratios at the undergraduate and postgraduate levels are 1 to 15 and 1 to 12, respectively, the ratio of 1 to 24 is significant and indicates that the shortage of engineering faculty is severe if indeed the estimate of the number of engineering faculty is correct.
Figure 10: Student-Faculty Ratio in Engineering Education
Sources: Various (see the data sources described in appendix E).
114
187
115
496
62 19
223
0 100 200 300 400 500 600
United States United Kingdom
Japan China Brazil India Russian
Federation
number
country
19.3
6.8
18.5
14.8 14.8
24.0
14.8
0 5 10 15 20 25 30
United States United Kingdom
Japan China Brazil India Russian
Federation
ratio
country
15
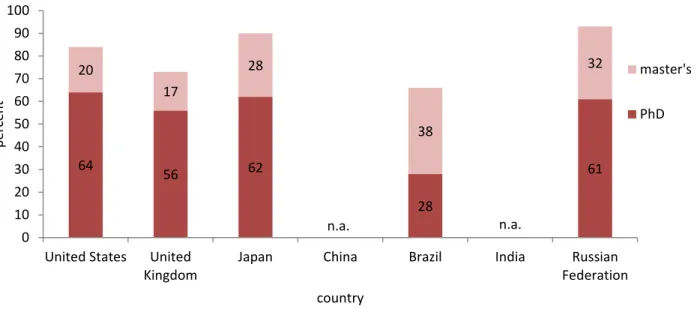
The issue of the engineering faculty in India is not only one of quantity; it is also an issue of quality. The percentage of engineering faculty with PhD degrees is low. Even at competitively selected institutions involved in the TEQIP-II in Andhra Pradesh, one of the most advanced states in terms of engineering education, the share of engineering faculty with PhD degrees is merely 20 percent. This is low even among the BRIC countries (Figure 11).
Figure 11: Average Qualifications of Faculty
Sources: Various (see the data sources described in appendix E); Brazil: data of National Institute for Educational Studies and Research; data on Russia are estimates; United States: data of National Center for Education Statistics.
Note: Faculty includes only members with master’s degrees or PhDs.
Education Outputs
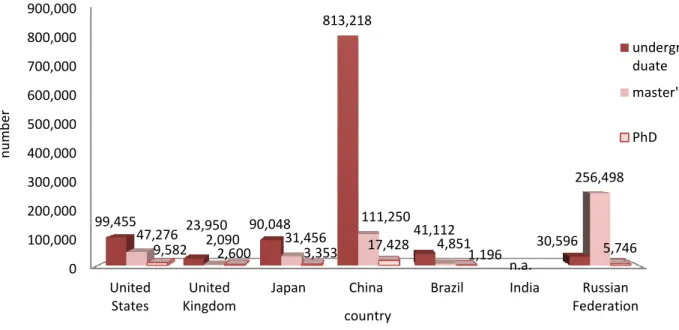
The latest available data on education outputs in India refer to 2006. According to Banerjee and Muley (2009), India awarded about 230,000 engineering degrees, 20,000 engineering master’s degrees, and about 1,000 engineering PhDs in 2006. These may be reference figures for comparison. However, given that engineering education in India has significantly expanded and that there are no recent data available on engineering graduates, we have omitted the number of graduates in India (Figure 12). Among the countries that we compare, China is producing the highest number of engineering graduates by far.
64 56 62
28
61 20
17
28
n.a.
38
n.a.
32
0 10 20 30 40 50 60 70 80 90 100
United States United Kingdom
Japan China Brazil India Russian
Federation
percent
country
master's PhD