Policy Research Working Paper 6160
Understanding the Business Environment in South Asia
Evidence from Firm-Level Surveys
Wendy Carlin Mark Schaffer
The World Bank South Asia Region
Human Development Department August 2012
WPS6160
Public Disclosure AuthorizedPublic Disclosure AuthorizedPublic Disclosure AuthorizedPublic Disclosure Authorized
Abstract
The Policy Research Working Paper Series disseminates the findings of work in progress to encourage the exchange of ideas about development issues. An objective of the series is to get the findings out quickly, even if the presentations are less than fully polished. The papers carry the names of the authors and should be cited accordingly. The findings, interpretations, and conclusions expressed in this paper are entirely those of the authors. They do not necessarily represent the views of the International Bank for Reconstruction and Development/World Bank and
Policy Research Working Paper 6160
This paper examines the relationship between firm performance and growth and the business environment in the countries of the South Asia Region—Afghanistan, Bangladesh, Bhutan, India, Maldives, Nepal, Pakistan, and Sri Lanka—using firm-level data from the World Bank’s Enterprise Surveys. The analysis uses an approach in which the responses of firms to questions about the quality of the business environment can be interpreted as shadow prices: estimations by managers of the cost imposed on the firm by inadequacies of an aspect of the business environment—public inputs such as regulation, physical infrastructure, availability of skilled labor,
This paper is a product of the Human Development Department, South Asia Region. It is part of a larger effort by the World Bank to provide open access to its research and make a contribution to development policy discussions around the world. Policy Research Working Papers are also posted on the Web at http://econ.worldbank.org. The author may be contacted at m.e.schaffer@hw.ac.uk.
macroeconomic conditions, rule of law, etc.—for the growth of their firm. The analysis finds, in line with this approach, that higher-productivity and better-performing firms in the region, and in particular firms that recently expanded their employment and created jobs, report significantly higher constraints in terms of the supply of public inputs. The authors discuss the differences across countries in the importance of various industries, how they relate to various firm characteristics, how informal and rural sector firms are constrained by public inputs, and how firms in the South Asia Region countries compare with firms in the rest of the world.
Understanding the Business Environment in South Asia:
Evidence from Firm-Level Surveys
*Wendy Carlin
1Mark Schaffer
2JEL: D22, O17, O18, O43, O53
Key words: Firm Behavior, Formal and Informal Sectors, Business Environment, Constraints to Firm Growth, South Asia
* We are very grateful to Paul Seabright for discussions on our related work which have influenced this paper. Comments and feedback from Reema Nayar, Pradeep Mitra and their colleagues in the Human Development Department of the South Asia Region, and from the audience at a June 2011 seminar in the SAR Chief Economist Seminar Series, are gratefully acknowledged. The usual caveat applies.
1 University College London and CEPR
2 Heriot-Watt University, CEPR and IZA
1. Introduction
This paper examines the relationship between firm performance and growth and the business environment in the countries of the South Asia Region (SAR): Afghanistan, Bangladesh, Bhutan, India, Maldives, Nepal, Pakistan and Sri Lanka. The analysis uses data collected for the Enterprise Surveys conducted by the World Bank of formal sector firms in the region, along with surveys of informal sector and rural firms in several countries. The paper serves as an input to the World Bank South Asia Region’s flagship report, “More and Better Jobs in South Asia”.
Surveys of firms across countries can be used to provide a rich description of how managers perceive the costs to them of the business environment in which they operate. Interpreting these surveys requires a conceptual framework, and the analysis in this paper uses the approach set out in Carlin et al. (2006, 2010, 2012) and Carlin and Schaffer (2012). In this framework, the responses of firms to questions about the quality of the business environment can be interpreted as shadow prices: estimations by managers of the cost imposed on the firm by inadequacies of an aspect of the business environment – regulation, physical infrastructure, availability of skilled labor, macroeconomic conditions, rule of law, etc. – for the growth of their firm.
Expenditures on mitigation of these costs as reported by firms also fit naturally into this framework. When taken to the data, these predictions inform the policy maker whether, for example, it is the case that improvement in a particular element of the business environment is likely to benefit well- or poorly performing firms; whether public input bottlenecks are more pressing in urban or rural areas; and whether there are important differences across industries in the burden of weaknesses in the business environment. Since the focus of the flagship report is on jobs, we examine in
particular how different elements of the business environment affect firms that are expanding employment.
Our modeling framework allows us to interpret clearly the different business-
environment related measures collected in enterprise surveys and to formulate
hypotheses as to how they relate to firm efficiency and growth. It predicts in
particular that well-performing firms report higher costs of constraints. This insight
has the implication that relaxing the constraints on these firms is likely to produce the largest increases in output and that scarce resources available to policy makers would be better directed toward easing such bottlenecks than in focusing on the bottlenecks reported by poorly performing firms.
The structure of the paper is as follows. In Section 2, we summarize the analytical framework used in the rest of the paper and the predictions it generates about how a firm’s evaluation of the costs of constraints imposed by its external environment would vary with its characteristics; the model is set out in detail in Appendix 1.
Section 3 describes the Enterprise Survey data available for the SAR countries and how the variables in the model map onto the data. In Sections 4-6 we analyze the survey data from formal firms in the region. As expected, firms that had created jobs in the preceding three years reported higher costs of constraints than did other firms.
Reported costs – shadow prices – varied in the expected way with a number of other firm characteristics such as size and location. In Sections 7-8, we use country
averages of costs of constraints reported by formal sector firms to assess which
elements of the external environment are more problematic for firms across the region and in each country, and in Section 9 we compare these country averages for the SAR countries with those reported by formal sector firms in other countries at a similar level of development. Section 10 compares business environment constraints
reported by formal sector firms in the region with those reported by rural and informal sector firms. Section 11 concludes.
2. Modeling framework
Our modeling builds on the framework in Carlin et al. (2006, 2010, 2012). The framework allows us to interpret clearly the different business-environment related measures collected in the Enterprise Surveys and to formulate hypotheses as to how they relate to firm efficiency and growth. Our modeling framework predicts that well-performing firms report higher costs of constraints. This insight has the
implication that relaxing the constraints on these firms is likely to produce the largest
increases in output and that scarce resources would be better directed toward easing
such bottlenecks than in focusing on the bottlenecks reported by poorly performing
firms. However, it is important to remember that the data collected in the business environment surveys provides information only about the constraints facing existing enterprises. It is not a useful source for addressing the constraints facing potential firms.
Before discussing our framework in more detail, it is useful to address the question of why the importance of the business environment for economic performance cannot be readily estimated directly using firm-level indicators.
Why can’t the importance of the business environment be estimated directly using firm-level indicators?
A commonly-employed approach to using firm-level data to estimate the impact of variations in the business environment on firm performance is to estimate a regression in which firm performance is the dependent variable and with a measure of the
business environment as reported by the firm used as a regressor along with various covariates. For example, firm-level data can be used to estimate a total factor productivity equation in which output appears on the left-hand side and inputs and other covariates appear on the right-hand-side along with one or more business environment measures. There are three reasons why such an attempt to estimate the effect of variations in the business environment at the level of the firm on productivity (or growth) is likely to be unsuccessful.
First, the many dimensions of the business environment are likely to be correlated, which makes it very difficult to tease out their separate effects on performance.
Inclusion in the regression of single measures of the business environment reported by the firm is likely to result in endogeneity/omitted variable bias, whereas including many measures and controls will typically lead to very imprecisely estimated
coefficients (the “curse of dimensionality” problem). This is the same problem faced by attempts to uncover the institutional determinants of growth in cross-country studies.
33 See, e.g., Easterly (2009), Dethier (2008, 2010), or Durlauf et al. (2005) for discussions of the macro literature.
Second, even if there was only one candidate dimension of the business environment, for its effect on firm-level productivity to be estimated requires that it vary at the level of the firm. This is clearly not the case for a number of elements of the business environment such as macroeconomic stability and the court system.
Third, in cases where there is variation at the level of the firm, its effect on
performance can be estimated only if there is a way of isolating the quality of such a firm-level micro-business environment from the firm’s characteristics.
A simple example illustrates the problems. It is plausible that a higher productivity firm will attract more attention from rent-seeking bureaucrats; hence, a naïve regression of firm performance on the number of visits would produce a positive estimate of the effect of bureaucratic attention on performance. The major research strategy adopted to get around this problem and uncover the effect of inspections on firm performance separate from the effect of firm performance in attracting
inspections has been to use the so-called “cell averages” approach. Instead of using the firm’s own report on the number of visits, the average number reported by firms with similar characteristics (such as firm size, industry and location) is used. The cell averages approach is one of the strategies for addressing the endogeneity bias problem recommended by Dethier et al. (2008, 2010) in their survey paper.
However, the cell averages approach runs into an immediate problem. Unobservable characteristics that cause or are correlated with higher productivity of the firm in question will also tend to raise the productivity levels of the other firms in the cell (e.g., a local demand or industry-specific shock will boost capacity utilization and performance). This will tend to raise the prevalence of inspections, expenditure on abatement such as bribes and the seriousness of this element of the business
environment reported by the firm. This is an example of Manski’s (1993) “reflection problem”.
The econometric challenge in trying to tease apart differences in the institutional
environment faced by firms in a single country while avoiding the problem of
endogeneity, is too much for the data to bear, which is why a recent careful study of
the data for transition economies that tried to do just this, Commander and Svejnar (2009), found largely null results.
The three problems with attempting to uncover the relevance of elements of the business environment by estimating directly a production function augmented by business environment indicators can be avoided by taking a different approach.
Following Carlin et al. (2006, 2010), we take as our starting point that the business environment is external to the firm and that to an important extent, firms in a country share the same environment. This suggests that firm level information be used in a different way from the augmented production function method. Specifically, we formulate predictions as to how the firm’s response to its business environment in terms of its expenditure on abatement and its evaluation of the costs imposed on it by deficiencies in the business environment varies with its characteristics, including its performance. In short, a firm-level assessment of the business environment is an endogenous variable in the modeling framework and as the dependent variable in estimations. The framework can be also used to address the relative importance of different aspects of the business environment in different countries.
Modeling framework: Summary
The model is set out in Appendix 1 and we summarize it here. We use a simple single-period firm production function with 4 inputs, L, E, B and G, which are combined to product output Y. L is employment; E is an intermediate input that is a flow of services which results from combining a public input B with G, an input the firm purchases in order to mitigate the effects of the unreliability of the public input.
Firms also differ in productivity, which we capture with a productivity parameter A.
We index countries by j and firms by i. In our basic model, the public input B that is
supplied on identical terms to all firms in a country, so we write it as B
j. This
captures the notion of a shared “business environment” – B
jvaries across countries
but not across firms within a given country. We then extend the model to cover the
case where the public input varies with the firm’s productivity or profitability.
For example, if B
jis the quality of the electricity supply from the grid, and G
ijis the firm’s generator, then B
jand G
ijcombine to create the firm’s electricity input E
ij. Spending money on G
ijmeans the firm can generate its own electricity when there is an interruption in supply from the main electricity grid ( B
j). Electricity is then combined with labor to create output. Although the quality of the business environment at country level cannot be directly observed, there are country-level proxies for B
jsuch as the degree of reliability of the electricity supply (e.g., in terms of outages).
Corruption is another example. In this case, B
jis a measure of the honesty of government bureaucrats in country j, but the public input B
ijsupplied to firm i depends not only on B
jbut also on productivity A
ij: high productivity firms will attract attention from dishonest government officials looking for bribes. As a consequence, the quality of the public input supplied to high productivity firms will be lower than that supplied to low productivity firms that are ignored by the bribe- seeking officials. Thus if B
jis the honesty of the bureaucracy in country j, B
ijis the inverse of the number of inspections that a firm with productivity A
ijattracts (more inspections means a lower quality public input B
ijsupplied to the firm), and G
ijis bribes.
Central to our analysis are the “Subjective Severity” indicators collected in the Enterprise Surveys. These are responses to questions about a feature of the business environment faced by the firm, where the question takes the form, “How much of an obstacle is X to the operation and growth of your business?”, and the respondent rates the severity on a 5-point scale of 0 (“no obstacle”) to 4 (“very severe obstacle”).
The key point about these subjective severity indicators is that these are not estimates of the country-wide public input B
j, or even of the public input B
ijsupplied to firm i;
they are valuations of the public input. A simple and intuitive interpretation is that
the “reported cost” R
ijof a public input is the gap between the firm’s profit in the
hypothetical situation where the public input provided is of such high quality that it poses a negligible obstacle to the firm’s operations, and the firm’s profit in reality, given the actual quality of public input provided. We show in the Appendix that R
ijcan be interpreted as the shadow price of shortcomings in the public input B
j.
The core predictions of the model (see the Appendix) are that better performing firms (faster growing, higher productivity, etc.)
• spend more on mitigation, G
ij∗(e.g., are more likely to have a generator; are more likely to pay bribes);
• report better public input services E
ij∗in cases where the input service is not a function of firm-level productivity (e.g., are more likely to report fewer delays at customs);
• report higher or lower public input services E
ij∗in cases where the input service is a positive function of firm-level productivity (e.g., outcome depends on the offsetting effects of a higher number of inspections and greater
expenditure on bribes);
• report higher costs of public input constraints, MRC
ij∗.
3. Mapping the framework to the data
In this section, we show how the framework is matched with the data in the Enterprise Surveys. We begin by identifying a number of proxy variables for unobserved firm productivity and firm growth. We then summarize the variables that are proxies for the reported costs or shadow prices of constraints, R
ij, mitigation costs G
ij*, the flow of public input services E
ij*and the shared business environment B
j.
Performance variables
We define the following measures of firm performance that are available in the
Enterprise Surveys.
• Growth of permanent employment: this is a dummy variable that takes the value of 1 if there was an increase in the number of permanent employees over the preceding three years.
4• Labor productivity: the log of value added per worker, where value added is defined as sales less spending on raw materials and deflated using a PPP-based year-specific exchange rate.
• Total factor productivity: this variable is constructed as a simple residual using logs of sales, employment, fixed capital and material, with weights on the latter three variables set to 0.25, 0.10 and 0.65, respectively.
• R&D-firm: this is a dummy variable that takes the value of 1 if the firm reports that it does R&D.
• Process or product innovation: this is a dummy variable that take the value of 1 if the reports that it introduced a new process or product during the previous three years.
• Sales to MNCs: the percentage of sales reported to have been made to multi- national companies. We interpret this as an indicator of external evaluation of the firm’s quality.
• Education top level of the manager: this is measured in years of education.
• Average education level of the production workforce: this is also measured in years of education.
• Training offered: this is a dummy variable that indicates whether the firm has an in-firm training program.
• Per cent of production workers trained: this relates to the firm’s in-firm training.
The reported costs of public input constraints
Measures of R
ij, the reported cost or shadow price of public inputs, are available in the SAR data: “How much of an obstacle is XX to the operation and growth of your business?” The model predicts that these will be positively related to measures of productivity and growth: they will be increasing in A
ijand positively correlated with
4 If permanent employment data is not available for a firm for 3 years earlier, a shorter period is used.
measures that are also correlated with A
ij. The public inputs for which we have data are:
• Electricity
• Telecoms
• Transport
• Customs
• Unfair competition
• Access to land
• Crime/theft/disorder
• Tax administration
• Business licensing
• Political instability
• Government policy instability
• Corruption
• Operation of the courts and legal system
• Macroeconomic instability
• Labor regulation
• Skilled labor shortages
There is another question that is best interpreted along with the reported costs measures. Firms are asked about the adequacy of their access to water. When they report “insufficient water”, this can be interpreted as meaning that “insufficient water”
is an obstacle to production. Had they answered “sufficient water” then this would be equivalent to the answer above of “not an obstacle”. We therefore consider water together with the other public input constraints.
• Sufficient supply of water
Mitigation outlays
Measures of mitigation costs G
ij*will also be increasing in A
ij. The following indicators of mitigation outlays are included in the Enterprise Surveys.
• Bribes (=1 if the firm paid bribes, =0 if not)
• Managerial time dealing with regulatory issues (%)
• Generator (=1 if the firm has its own generator, =0 if not)
The flow of public input services
Measures of the flow of services E
ij*that are available in the Enterprise Surveys are:
• Average number of days for exporter to get goods through customs. This is an inverse measure of the speed with which goods are processed through
customs.
• Total number of inspections by officials per year. This is also an inverse measure; a higher number of inspections reduces the flow of services from the relevant public input.
Firm-level estimates of the shared business environment
There is only one indicator of B
jin the Enterprise Surveys, namely the firm’s experience of interruptions to the power supply. We use this in dummy variable form:
• Power cuts (=1 if more than one per month, =0 otherwise)
How can the answers to the “Access to Finance” and “Tax Rates” questions be interpreted?
There are a number of reasons why “finance” and “tax rates” cannot be interpreted in the same way as the public input constraints (Carlin et al. 2006).
If finance had the character of a public good like telecoms or customs regulation then we would expect that a high score would mean that better access to finance would boost output. However, because of the agency problems characteristic of the firm, better access to finance may result in more funding of pet projects that do not raise output (on average) but lead to higher default rates.
Where the finance system is working well, we would expect that access to finance is a constraint on at least some managers. This is not the case of a well-functioning electricity system or customs administration.
Finally, if financial institutions are functioning well, the perception of its availability
as a constraint should be inversely related to the quality of investment projects the
firm has available to fund, so that high scores may indicate poor quality projects
rather than the potential for increased output.
The interpretation of responses to managers as to the importance of tax rates for the operation of their business faces similar difficulties as the interpretation of the importance of access to finance, and partly for similar reasons. Just as managers do not take account of the social benefits of a financial system that constrains access to finance by aiming to screen out poor projects, they also do not take account of the social benefits arising from government spending funded by the taxes they pay.
We suggest that the way to interpret the responses of managers on tax rates is that they point to the costs imposed on firms if public inputs are supplied at the cost of higher taxes than necessary. Tax rates are very highly ranked as a constraint by managers in virtually all countries (irrespective of their level of development) but it does not follow that it is a priority everywhere to cut taxation. A high ranking is probably better interpreted as indicating that policies to reduce tax rates while holding other aspects of public infrastructure provision constant (for instance, by improving administrative efficiency) would improve firm performance.
For the public input constraints, we use the survey answers to get at the private cost to the firm of inadequate or unreliable public inputs or burdensome regulation. It is not possible to use micro data of this kind to uncover whether tax rates are a key
constraint to firms – firms are unlikely to take into account the public inputs that are paid for by taxation when responding to the question.
4. Are job-creating firms in the South Asia Region also high-performance firms?
The analysis in this paper relates to formal-sector firms in 8 South Asia Region (SAR)
countries: Afghanistan, Bangladesh, Bhutan, India, the Maldives, Nepal, Pakistan and
Sri Lanka. The data were collected in a series of surveys over the 10-year period
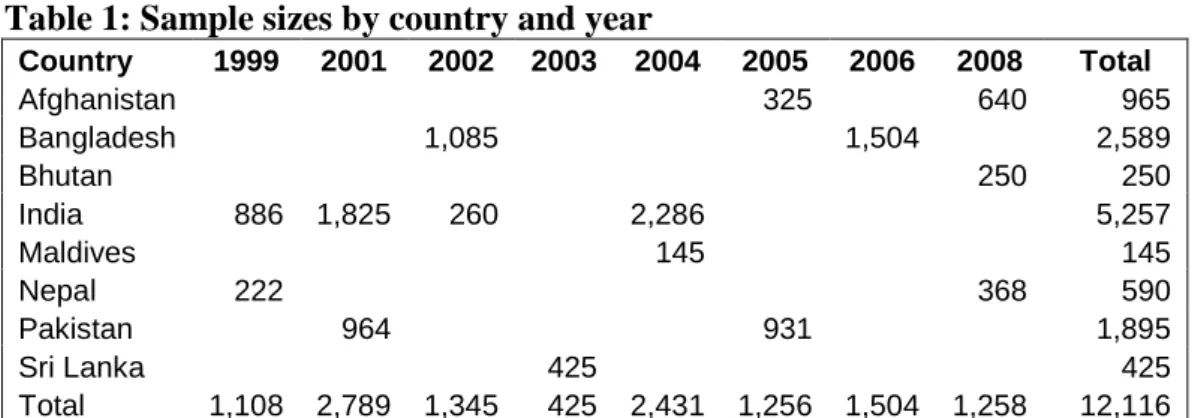
2000-2010. Tables 1 and 2 present the number of firms and the median permanent
employment by country and year. Firms in the three most-populous countries – India,
Bangladesh and Pakistan – account for 80% of the total sample. Most of the firms
surveyed are SMEs; median permanent employment is 19 persons. This is true of the
individual surveys as well; the exceptions are the surveys in Bangladesh and Sri
Lanka in 2002 and 2003, where permanent employment in the median firm exceeded
100 persons. All the estimations reported below, both regressions and correlations, use country fixed effects. This includes pairwise correlations, i.e., these are pairwise partial correlations with country effects partialed out.
When investigating the role of external constraints on firm performance, our modeling framework highlights that it is the firms that are performing well that are predicted to report higher costs of constraints. This insight has the implication that relaxing the constraints on these firms is likely to produce the largest increases in output and that scarce resources would be better directed toward easing such bottlenecks than in focusing on the bottlenecks reported by poorly performing firms.
Before introducing the results on business environment constraints, it is important to understand the correlations among the indicators of firm performance. Country means for these performance measures are given in Table 3. Differences across countries will be discussed in a separate piece. Note that these are unconditional means, and the differences by country are influenced by differences in sample composition (e.g., manufacturing vs. services). Note also that some measures, notably R&D activity and sales to MNCs, are not available for some countries.
Is it the case that permanent employment growth is concentrated in firms that are also successful when measured by the other performance criteria? Broadly speaking the answer is yes. The green cells in Table 4 show a positive and significant correlation between the growth of employment variable and whether the firm does R&D, its introduction of a new process or product, the education level of the top manager and of the workforce, as well as measures of in-firm training.
These are unconditional correlations (more precisely, they are conditioned on country fixed effects only). It is also important to know whether the performance correlations with the growth of employment remain once other firm characteristics are taken into account. As a first step, Table 5 shows that larger, more established, more
internationally engaged firms, and those located in large cities are also the ones where
jobs are most likely to have been created.
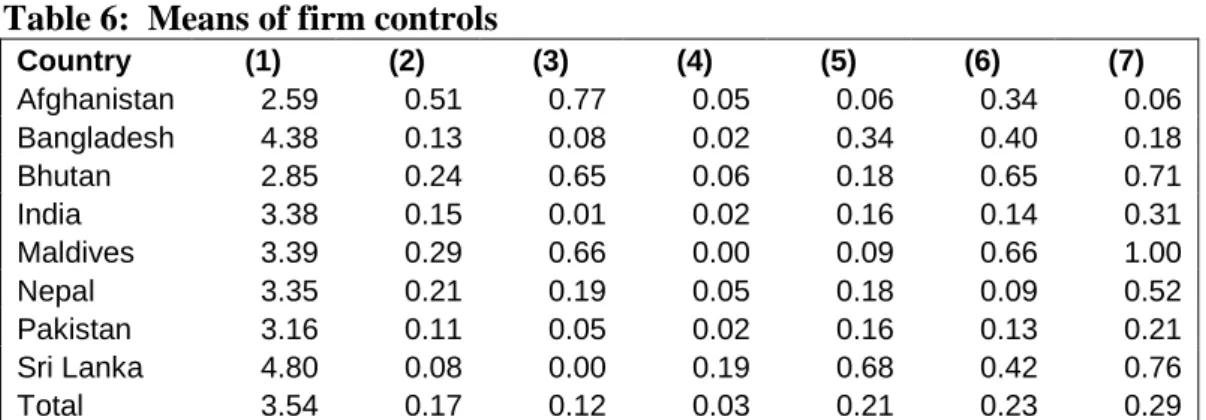
Definitions of the control variables for firm characteristics:
• Firm size: measured by the log of the firm’s average number of employees over the previous three years.
• New firm: this is a dummy variable equal to one if the firm is 4 years old or less.
• Services: this is a dummy variable that takes the value of one for firms in the services sector; the benchmark is manufacturing.
• Foreign: this is a dummy variable that takes the value of one if the firm has a foreign owner with a stake of at least 10%.
• Exporter: this is a dummy variable that the value of one if the firm exports at least 10% of its sales, either directly or through intermediaries.
• Importer: this is a dummy variable equal to one if the firm imports directly.
5• Small city or rural: this is a dummy variable that takes the value of one if the firm is located in a small city or rural area.
Table 6 reports the means for these controls by country and for the sample as a whole.
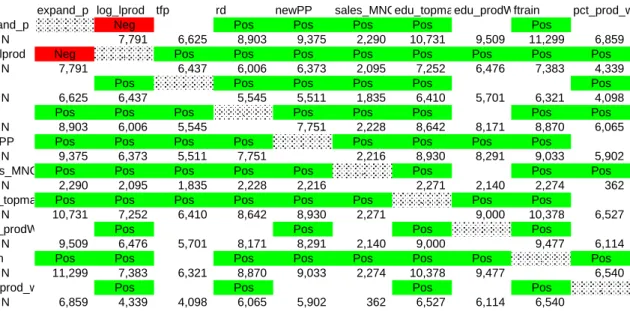
Once we partial out these firm characteristics and re-do the correlations of performance measures, Table 7 shows that the patterns shown in Table 4 remain broadly unchanged. The employment growth variable is significantly correlated with most of the other performance measures – and each of those continues to be correlated with most of the other measures.
Note that employment growth is not positively correlated with the level of labor productivity or total factor productivity. This is explained by the fact that there will be a spurious negative correlation between a firm’s employment growth and its level of productivity when it hires additional labor in order to expand output. When the control variables are included, the correlation between employment growth and labor productivity is significantly negative. The reason is that part of the positive
correlation between the controls and both job growth and labor productivity is
5 Since the importer status variable is missing for some countries, we include a “missing importer”
dummy variable that allows us to include many firms for which this variable is missing.
removed once the controls are included. Hence, the spurious negative correlation between employment growth and labor productivity is then much stronger.
The outcome of this initial descriptive analysis is that job creation is associated with specific firm characteristics and with a wide range of other indicators of firm
performance. Job growth takes place in larger, more established firms that are internationally engaged – and these firms are also more likely than others to be
innovative, and to have a more educated manager and workforce. On the basis of this, we move to examine how the reported costs of constraints vary with firm
performance.
5. How does firm performance affect the evaluation of constraints imposed by the external environment?
Our modeling framework predicts that better-performing firms report higher
constraints from the external environment. Do we find this pattern in the data? In the analysis that follows, we look first at how the evaluation of business environment constraints varies with firm performance. In order to do this, we regress the firm’s evaluation of the seriousness of each element of the external environment on the performance measure and on the standard set of controls introduced above (firm size, firm age, industry, ownership, exporter status, importer status, and location, plus country fixed effects). The results we report use heteroskedatic-robust standard errors.
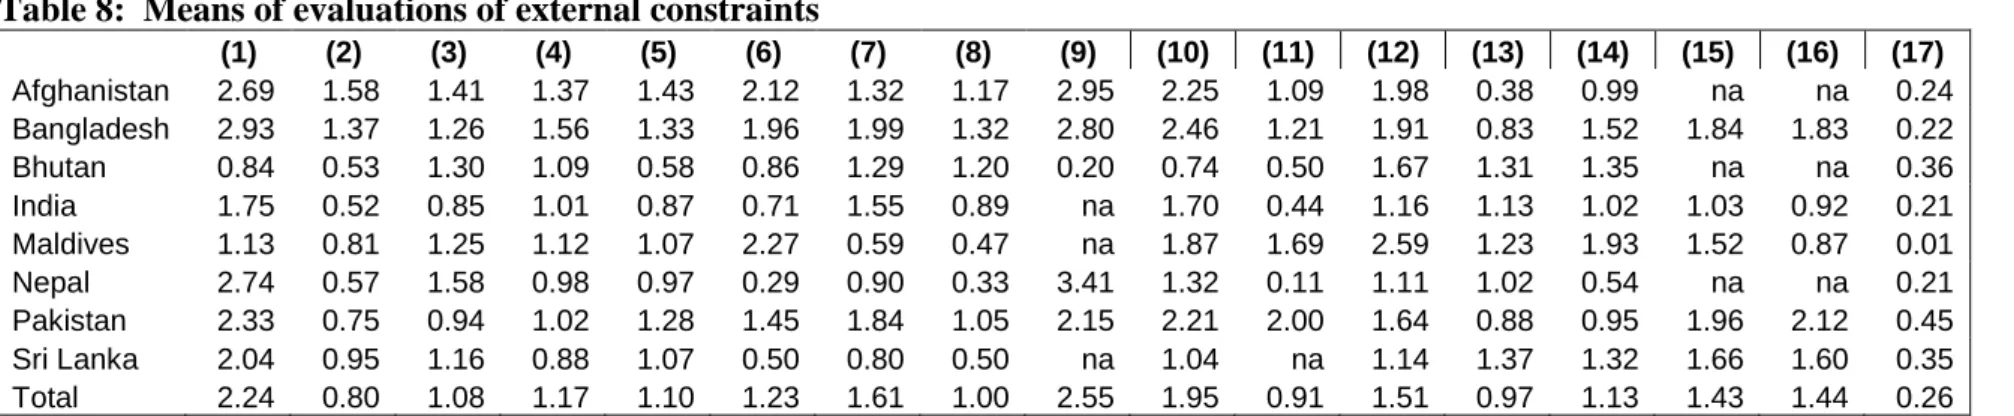
Means by country of the firm’s evaluation of constraints, and of mitigation outlays, the flow of services of public inputs, and of the shared business environment, are reported in Tables 8 and 9. The virtually universal problems with electricity supply in Afghanistan, Bangladesh, Nepal and Pakistan are highlighted by the results
reported in column 8 of Table 9: almost all firms report at least one power cut per month (and most report at least one per week). Note that although almost all firms in these countries face a poor quality business environment in this respect, their
valuations of this aspect of the environment (the “subjective severity” question on
electricity) vary. Over one-third of firms in each of these three countries report that
electricity is at most a “moderate” obstacle (3 on the 0-4 scale). This provides a good illustration of how our framework works: all firms in these three countries report that the quality of this particular public input ( B
j) is poor, but they differ in their
estimates of how costly this is for them (R
ij).
Public input constraints and firm performance
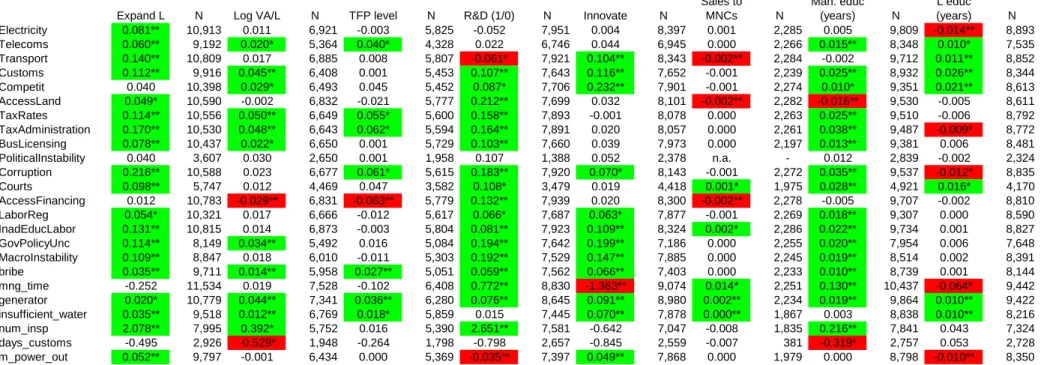
We begin with the public input constraints (Table 10). The coloring of the cells in the table provides an immediate visual impression that firms performing well across each of the performance dimensions shown in the top row of the table report higher costs of constraints than do less well performing firms (green cells). In the lower part of the table, a number of indicators of mitigation expenditure are shown. The predominance of green cells there shows that expenditure on mitigation (e.g., bribes, generators) is also positively correlated with firm performance.
Benchmark performance measure: job-creation
Turning to firms that have recently expanded permanent employment (first column in Table 10), it is apparent that such firms report higher costs of constraints across virtually the whole range of external constraints both in terms of physical
infrastructure and in the regulatory and broader policy environment. The only exceptions among the sixteen constraints (including insufficient water supply) are those imposed by “unfair competition” and political instability. Job-creating firms also report a higher tendency to pay bribes, are the target of more inspections by officials, report a higher frequency of power outages and are more likely to have a generator.
Alternative performance measures
Using the static efficiency measures of performance, higher productivity firms
complain more about most institutional aspects of the business environment (see
Table 10). Since higher productivity firms are not necessarily engaged in expansion, it
is unsurprising that physical infrastructure and access to land and skilled labor are
reported as less onerous than is the case for job-creating firms. Of the physical
infrastructure elements, higher productivity firms appear somewhat more troubled by
poor telecoms than are less productive firms.
Firms that have undertaken R&D and those that have innovated (introduced a new process or product) do not report higher costs of electricity or telecoms constraints than do other firms. R&D-firms report fewer problems with transport than other firms but higher constraints across the board otherwise. The complaints of innovating firms are a little more narrowly focused than for R&D-firms. In both cases, however, higher costs of anti-competitive behavior, customs regulation, corruption, access to land, an inadequately educated labor force, policy uncertainty and macroeconomic instability are reported.
Firms with more highly educated managers also identify a broad range of elements of the external institutional environment as more costly than do firms with less well- educated managers. Like higher productivity firms, those that do R&D and have highly educated managers are more likely to pay bribes, have a generator and attract more inspections. They also report more management time spent with officials.
The constraints reported by firms with a higher share of educated production workers are rather different. In particular, such firms report lower costs associated with tax administration and corruption than do other firms and there is no greater tendency to pay bribes, spend management time with officials or be inspected than is the case for other firms. It is notable that firms with a more educated labor force do not report access to skilled labor as more costly than other firms. However, firms that are engaged in training do report access to skilled labor as more costly.
Firms that sell to MNCs are prone to report higher costs of access to suitably qualified labor and of the courts than firms that are not involved in an MNC
relationship. Otherwise, reported constraints are lower or no different from non-MNC related firms.
To summarize, across a wide range of performance indicators, reported costs of public
input constraints are significantly higher in better-performing firms. Such firms are
also likely to be engaged in more activity to mitigate the effects of poor physical and
institutional infrastructure.
Access to finance is different
We conclude this section by examining the results for access to finance. As explained above, a firm’s evaluations of access to finance will behave differently from the public good constraints, because when asked about the obstacle to their activities posed by difficulties with access to finance, the firm’s own circumstances will directly affect the terms on which finance is available and hence its answer to the question. In particular, the firm’s answer to a question about how much of an obstacle to its operation and growth is posed by access to finance will be influenced by its investment plans and its internal financial resources (retentions). One element of the firm’s ability to access external finance will be the “objective” state of the financial system in the economy (or region). However, the terms on which external finance is available and hence the firm’s answer as to its ease of access will be heavily
conditioned by its need for finance relative to internal sources, and the collateral it has available. A characteristic of a well-functioning financial system is precisely its ability to direct finance according to firm (or project) -specific quality.
Looking at Table 10, we can see that irrespective of the performance measure, for public input constraints, the typical pattern is for better performing firms to report higher costs of constraints (green cells). This is not the case for access to finance.
More efficient firms (as indicated by higher labor productivity and TFP) report lower problems with access to finance than do other firms (red cells). This is also the case for firms that sell to multinational companies. This highlights the likely causal chain from good firm performance to the availability of internal finance and easier access to external finance based on sound prior performance and the associated availability of collateral.
High productivity firms may also be closer to their optimal capital stock and hence have a more limited need for additional external finance. Consistent with this
interpretation is the finding that firms doing R&D report higher financial constraints than firms that do not do R&D. This suggests that informational asymmetries
associated with innovation are likely to make access to external finance difficult –
even if R&D is a signal of a potentially dynamic firm.
6. How do the costs of constraints vary with firm characteristics?
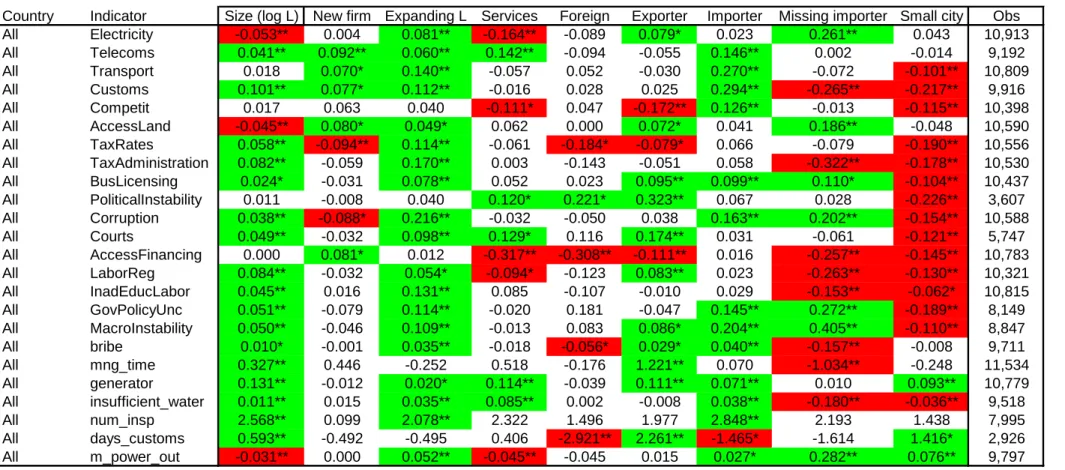
In this section, we report the results of our baseline regression, where each business constraint is regressed on the job creation variable and a set of controls. These are reported in Table 11. The coefficient on the indicator for expanding employment is identical to that in Table 10 and was discussed above. Here we discuss the how the reported cost of the public input constraints are related to other characteristics of the firm.
In our model, the size of the firm is endogenous, i.e., the level of employment chosen is the profit maximizing one given the constraint of the supply of public input
services, the firm’s level of productivity, and prices. The implication is that if we could observe the level of productivity, there would be no separate scale effect on reported costs of constraints. However, since productivity is not measured perfectly, we would expect that variables that are correlated with it to also attract a positive coefficient in the reported constraints regressions.
• In particular, firm size is positively correlated with productivity and we would therefore expect larger firms to report higher costs and more mitigation. As column 1 in Table 11 shows, this prediction is borne out by the data. Apart from electricity and access to land, larger firms report higher costs of constraints, and in most cases the effect is significant (green cells). Larger firms report significantly lower costs associated with electricity and with access to land. Larger firms report fewer outages are more likely to have a generator. Nevertheless, the negative and significant coefficient on electricity is an unusual finding. The sign is positive and significant in a large sample of firms from across the world; including in the sub-sample of countries with levels of per capita GDP similar to those in the SAR sample
• Firms in services are typically less capital-intensive, less unionized, more dependent on communications, and less engaged in trade than are
manufacturing firms. They would be predicted to be less burdened by the electricity network, and by labor regulations and customs administration, and to report a higher cost of poor telecommunications. This is the case in the data.
Services firms also report a significantly lower burden in relation to anti-
competitive behavior and corruption and a higher burden of the courts, political instability, access to land and business licensing.
• Given their access to their parent firm’s internal capital market it would be predicted that foreign-owned firms report fewer problems with access to finance than domestically owned ones. This is indeed the case among the surveyed firms. They are also less prone to bribe and encounter fewer days of customs delay. The only dimensions on which foreign-owned firms report more costly constraints than do domestic firms is in relation to political instability and government policy uncertainty.
• Exporters and importers. There are a number of interesting differences in the constraints reported by these firms. In terms of physical infrastructure,
exporters report electricity as a costly constraint whereas importers report telecoms and transport as well as electricity as more costly than do non- importing firms. It is importers rather than exporters that are particularly bothered by customs administration. In line with expectations, exporters report fewer problems with anti-competitive behavior than do non-exporters;
importers report the opposite. Macroeconomic instability is especially
problematic for both types of internationally engaged firms, which is likely to reflect sensitivity to exchange rate movements and uncertainty.
• Location. A direct extension of the modeling framework is the prediction that in an economy characterized by uneven development between less dynamic rural and more dynamic urban locations, firms in the more urban locations would report higher costs of constraints. Under the assumption that the supply of public goods is uniform across the country, this prediction simply follows from the greater demands on public inputs in the faster-growing locations, which in low income countries are typically the urban ones. To the extent more rural locations have objectively worse levels of public input supply, this would tend to make it less likely that we would observe the predicted dualism result of higher reported constraints in more urban locations. However, the predominance of red cells in the final column of Table 11 confirms the
dualism prediction: firms in small cities or rural locations report lower costs of
constraints across the board (including water); the only exception is telecoms,
which is a low-ranked constraint everywhere and where there is no significant
difference by location. Firms in more rural locations are more likely to have a generator and report more power outages than do firms in more urban
locations, but large-city firms report a higher cost of constraint in relation to electricity.
• Established versus new firms. The modeling framework does not have any particular predictions as to how firm age should relate to the reported cost of constraints. However, as noted above, it is established firms that tend to be expanding employment. In terms of reported constraints, there is no difference between new and established firms across most institutional elements. New firms report higher costs of constraints for telecoms and transport, and lower costs for corruption and crime.
7. Are there country differences in the way constraints vary?
Before looking at the way constraints vary across countries, we check for country differences in the correlations between the job creation variable and firm
characteristics (Table 12). The procedure is the same as that for the pooled sample:
for each country sample, we report the correlation and partial correlation between the job creation variable and the characteristic in question. The “corr” and “pcorr”
columns report these correlations. For comparison purposes, the correlations for the pooled sample in Table 5 are repeated in Table 12 in the rows labeled “All”. We also report whether these correlations are significantly different from those for the rest of the pooled sample; these are reported in the “Diff?” columns. These latter tests are obtained by a pooled estimation in which a dummy variable for the country of interest is interacted with the other variables.
As noted above, in the sample as a whole, firms that expanded employment tended to
be larger, more established ones located in urban areas that were internationally
engaged via ownership, exporting or importing. In the India sample, we see that the
rural-urban pattern is less pronounced than that in the sample as a whole: firms in
large cities report higher employment growth than in small cities but the difference
disappears once the other controls are added. The pattern we saw above for the
sample at a whole – employment growth in large cities – is driven by the firms in Bangladesh, Bhutan, Pakistan and Sri Lanka.
The positive correlation between employment growth and the age of the firm in the sample as a whole is driven by firms in the sample from Afghanistan, Bangladesh and Pakistan. Elsewhere there is no strong age of firm effect.
Once other characteristics are accounted for, the positive association between employment growth and international engagement is strongest in India.
In the sample as a whole, there is no strong association between job-creating firms and either sector or ownership. However, there are some country variations. In Bhutan, Nepal, Pakistan and Sri Lanka, it is services rather than manufacturing firms that are more likely to be job-creating.
Reported constraints – do countries differ?
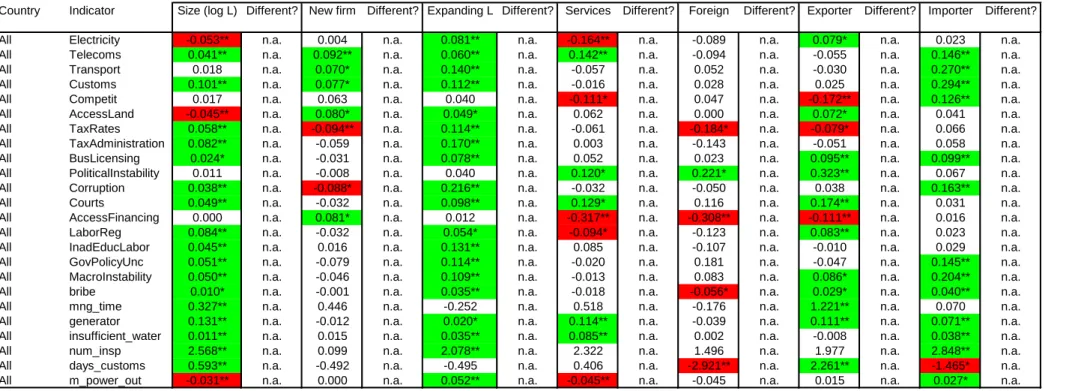
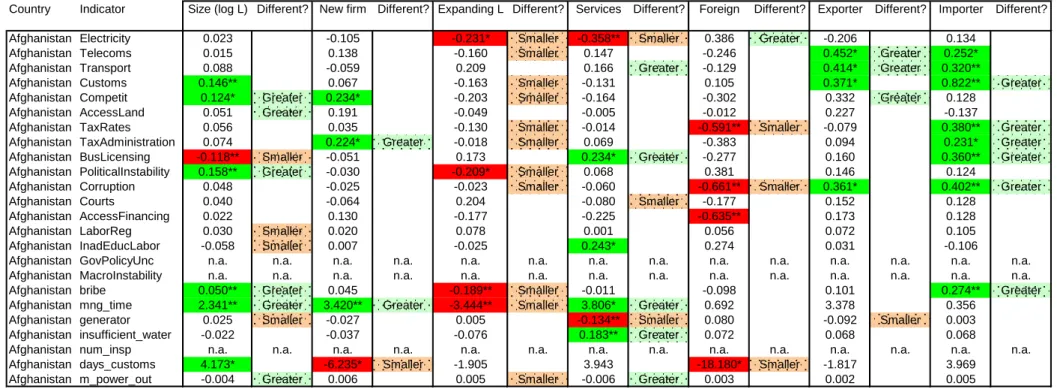
Our investigation of differences across countries in reported constraints uses a similar approach to that above. We estimate the same regression as with the pooled sample, but separately for each country. Significance tests are reported based on these
country-by-country estimations. The results are reported in Table 13; for comparison purposes, the results for the pooled sample in Table 11 are repeated here in the rows labeled “All”. We also report in the “Different?” columns whether regression coefficients are different in the country of interest vs. the rest of the sample, again using the simple procedure of a pooled regression in which the country dummy is interacted with the other regressors.
As we have seen earlier, in the sample as a whole in the benchmark regression (job creation plus controls), firms that expanded employment reported higher costs of constraints virtually across the board. When we look at the individual country
samples, we find this pattern very clearly for India and Pakistan (note the green and the “greater” cells). The countries that look different are Afghanistan and
Bangladesh. In both the latter countries, job-creating firms tend to report lower rather
than higher costs of constraints (red and “smaller” cells). It is also growing firms that
are less likely to pay bribes and spend less manager time dealing with officials. In Bangladesh, growing firms report lower constraints from anti-competitive behavior by other firms and labor regulation.
There are also some interesting cross-country differences in reported constraints for the firm characteristics, which may be relevant for policy.
The most striking difference among the SAR countries concerns the location characteristic. Earlier we found that in contrast to the rest of the region, job-creation was uncorrelated with location in India once we controlled for other firm
characteristics. Elsewhere, employment creation was more prevalent in big city locations. Turning to the constraints regression analysis, we find once again that India does not reflect the dualism pattern found elsewhere in low income countries. The typical pattern is that it is firms in urban (large city) locations that report higher costs of constraints than do firms in rural areas including small cities. Indeed for electricity, Indian firms in more rural locations report higher constraints than do firms in urban areas. In India, large-city firms report higher constraints only in relation to transport, courts, labor regulation, and customs administration. However, for the majority of constraints, there is no significant large city – small city gap in the reported cost of constraints in India.
The standard dualism pattern for low-income countries (found in the large multi- region dataset) is characteristic of most SAR countries apart from India. It is especially pronounced in Bangladesh and Pakistan (red cells). This suggests that in terms of the reported constraints on growth, India is a more integrated economy between rural, small city and large city areas than are the other countries in this sample.
The positive firm size effects across a range of constraints are weaker in India than
elsewhere. The difference between services and manufacturing firms is also different
in India, where it is services firms that complain more about electricity. Unlike the
case elsewhere, they are also more likely to have a generator and have more frequent
power outages than do manufacturing firms. In Pakistan, services firms complain
much less about electricity than do manufacturing firms and are more likely to have a
generator and fewer outages. However, services firms in Pakistan report more
problems in relation to the availability of educated labor than do manufacturing firms.
The other key difference is in relation to exporting firms: in the sample as a whole (and elsewhere in the world) exporting firms tend to complain more about physical infrastructure and institutions than do non-exporters. In India these exporter effects are even stronger. In Bangladesh by contrast, the results are the opposite: exporters report lower costs of constraints relative to non-exporters for electricity and most aspects of institutional infrastructure. Thus, in relation to exporters, it is Bangladesh that stand out from the regional and multi-region sample: for example, exporters complain less about customs administration than do non-exporters. In Bangladesh, also in contrast to experience elsewhere, exporters complain less about
macroeconomic instability than do non-exporters. Although the constraints reported by Bangladeshi importers are very much in line with the sample overall, Pakistani importers stand out from the sample. Importing firms there generally report lower constraints than non-importers and than importing firms elsewhere in the region.
These differences point to the need for more detailed research to uncover what lies behind them.
Are there important industry-specific effects?
An important question for policy-makers is whether there are systematic differences across industries in the extent to which the quality of public inputs imposes costs on firms. We focus on six industries (garments, food and beverages, chemicals,
electronics, machinery and textiles) and use the samples from the three large countries (Bangladesh, India and Pakistan) where each of the six industries is well-represented.
As a first step, we look at whether job creation is concentrated in particular industries.
We do this by using the pooled sample for the six industries in the three countries and, for each industry separately, regress the job creation variable on the dummy variable for the industry of interest plus country fixed effects. The results are in Table 14 in the
“corr” column. They show that job creation is higher in garments and textiles (except
in India) and lower in food and beverages, and electronics (except in Pakistan). It is
lower in the machinery sector in Pakistan.
However, from a policy perspective, what matters is whether these industry differences persist once we control for the other important firm characteristics, i.e.
size, age, etc. It is very striking that once the standard set of firm-level controls are introduced, the differences across industries in job creation mainly disappear. This is shown in the column “pcorr” in Table 14, where for the pooled sample, only the electronics industry dummy retains its significance. There are few significant country differences. Strikingly in the case of Bangladeshi garments, its role as especially job- creating in the initial regression without the controls switches to the opposite once we control for the firm characteristics – it is then less likely to be job-creating than other industries.
Finally, when we look at how reported constraints vary by industry either in the pooled sample or by country, there are very few significant industry effects. The implication of these results for the policy-maker is that there is no basis for
discriminating across industries when identifying priorities for improving the business environment, once the key characteristics we have analyzed here – international engagement, size, location, etc. – have been accounted for.
Summary
We summarize the core results of this section by returning to the predictions of the modeling framework. Using our baseline performance indicator of job creation, the model predicts that firms that expanded employment will:
• Report higher costs of public input constraints R
ij, i.e., higher shadow prices.
Such firms report higher costs of constraints in fourteen of the sixteen dimensions (including adequacy of water supplies).
• Spend more on mitigation, G
ij∗. The results reported above confirm that such firms are more likely to have a generator and to pay bribes. Contrary to expectation, they are not more likely to spend management time dealing with officials.
• Report better public input services E
ij∗(in cases where the input service is not
a function of firm-level productivity). We find that such firms do not report
shorter delays at customs (although higher productivity firms do report shorter delays).
These results provide a strong case for a policy focus on the constraints identified by firms as most costly. In the next piece, we examine how the relative importance of different public input constraints reported by firms varies across countries in the sample.
8. Which elements of the business environment matter most for firms and how do they vary across countries?
In this section, we use the country averages of the costs of public inputs reported by firms, R
ij, to assess which elements of the external environment are more problematic for firms across the region and in each country. We also compare the country average evaluations with those in other countries at a similar level of development.
The data that we use in this section pools the surveys of the SAR countries used above with data from the surveys available from the World Bank’s Enterprise Surveys portal. We consider only formal sector firms in the analysis. Altogether, the surveys cover almost 120,000 firms from over 230 different surveys in 126 countries over the period 2000-2010. Of these, about 16,000 firms were from the 8 SAR countries. We use these firm-level data to calculate country average evaluations, i.e., country means.
In order to correct for differences in survey samples when comparing reported constraints across countries, we construct the “conditional country means” for each constraint for a standard firm. The controls included in the estimations are the same as those used above: size (log employment), and dummy variables for whether the firm is newly established, expanding employment, has substantial foreign ownership, is a significant exporter or importer, and is located in a small city.
6Log employment is centered on ln(30). The estimations are identical to the country regressions
reported earlier; the country conditional means are, in fact, the estimated intercepts
6 Also as previously, we include a dummy variable in case the importer dummy is missing, in order to increase the sample size and number of surveys included.
reported in the first column of Table 13. The intercepts can therefore be interpreted as estimates of the constraint level in a given country for a benchmark manufacturing firm with 30 employees that is domestically owned, with no foreign ownership or import/export activity, and that is located in a large or capital city. These intercepts are the “country conditional means” that we analyze below.
7For those SAR countries for which we have surveys in multiple years, we obtain year-specific conditional means from the means by year of the residuals from the firm-level regression.
The implication of the modeling framework set out above is that job-creating firms are likely to benefit most from the success of policy-makers in relaxing the most pressing external environment constraints. For the reasons discussed earlier, we focus on business environment constraints with a public good character and therefore do not include the “Tax Rates” or “Access to Finance” constraints in the main analysis. The latter measures are considered briefly in Appendix 2.
The ranking of constraints by country
The conditional country means are reported for each of the SAR countries and for the region as a whole in Table 15. The countries are listed according to GDP per capita.
Because the conditional means are sometimes based on surveys from more than one year, GDP per capita used in the table and in the diagrams is a weighted average of GDP per capita, where the weights are the survey sample size in the relevant sample years. For the region as a whole, political instability, electricity and corruption are the three top-ranked constraints. However, there is considerable variation across the countries.
The differences between “finance” and the public good constraints discussed above mean it is not possible to interpret the country conditional mean for finance as comparable with the other constraints. As an example, think of the following experiment. If the economy is affected by a positive productivity shock, we would expect the average firm to report a higher cost of a public good constraint but lower cost of access to finance. Since the responses to the finance question are non-
7 The results for the unconditional country means, i.e., when using simple means across firms in a given survey, are very similar.