September 2006
Financial Structure and its Impact on the Convergence of Interest Rate Pass-through in Europe: A Time- varying Interest Rate Pass-through
Model
Wolfgang Schwarzbauer
Wolfgang Schwarzbauer Title:
Financial Structure and its Impact on the Convergence of Interest Rate Pass-through in Europe: A Time-varying Interest Rate Pass-through Model
ISSN: Unspecified
2006 Institut für Höhere Studien - Institute for Advanced Studies (IHS) Josefstädter Straße 39, A-1080 Wien
E-Mail: o ce@ihs.ac.atffi Web: ww w .ihs.ac. a t
All IHS Working Papers are available online: http://irihs. ihs. ac.at/view/ihs_series/
This paper is available for download without charge at:
https://irihs.ihs.ac.at/id/eprint/1725/
Financial Structure and its Impact on the Convergence of Interest Rate Pass-through in Europe:
A Time-varying Interest Rate Pass-through Model
Wolfgang Schwarzbauer
Economics Series
Economics Series
Financial Structure and its Impact on the Convergence of Interest Rate Pass-through in Europe:
A Time-varying Interest Rate Pass-through Model
Wolfgang Schwarzbauer September 2006
Institut für Höhere Studien (IHS), Wien
Institute for Advanced Studies, Vienna
Contact:
Wolfgang Schwarzbauer
Department of Economics and Finance Institute for Advanced Studies Stumpergasse 56
1060 Vienna, Austria : +43/1/599 91-112 Fax: +43/1/599 91-555 email: schwarzba@ihs.ac.at
Founded in 1963 by two prominent Austrians living in exile – the sociologist Paul F. Lazarsfeld and the economist Oskar Morgenstern – with the financial support from the Ford Foundation, the Austrian Federal Ministry of Education and the City of Vienna, the Institute for Advanced Studies (IHS) is the first institution for postgraduate education and research in economics and the social sciences in Austria.
The Economics Series presents research done at the Department of Economics and Finance and aims to share “work in progress” in a timely way before formal publication. As usual, authors bear full responsibility for the content of their contributions.
Das Institut für Höhere Studien (IHS) wurde im Jahr 1963 von zwei prominenten Exilösterreichern – dem Soziologen Paul F. Lazarsfeld und dem Ökonomen Oskar Morgenstern – mit Hilfe der Ford- Stiftung, des Österreichischen Bundesministeriums für Unterricht und der Stadt Wien gegründet und ist somit die erste nachuniversitäre Lehr- und Forschungsstätte für die Sozial- und Wirtschafts- wissenschaften in Österreich. Die Reihe Ökonomie bietet Einblick in die Forschungsarbeit der Abteilung für Ökonomie und Finanzwirtschaft und verfolgt das Ziel, abteilungsinterne Diskussionsbeiträge einer breiteren fachinternen Öffentlichkeit zugänglich zu machen. Die inhaltliche Verantwortung für die veröffentlichten Beiträge liegt bei den Autoren und Autorinnen.
So far studies concerned with the interest pass-through of monetary policy have not taken into account one central issue that arose in Europe in the late 1990s: the importance of financial structure for the convergence of monetary transmission. This study addresses this shortcoming. We estimate a time varying interest pass-through allowing us to test for the importance of financial structure and its impact on the convergence of the effects of monetary policy. We find convergence in banks' reaction to money market movements, which is additionally reduced in groups of countries with similar financial structure.
Furthermore, there is a significant impact of financial structure on the extent of transmission of monetary policy impulses within the same month. Thus, differences in financial structure between countries must not be ignored when considering convergence of monetary transmission in Europe.
Keywords
Convergence, interest rate pass-through, EMU, financial structure, money and bank interest rates, transmission mechanism
JEL Classification
E43, G21, E52
Comments
This research was funded by the Austrian Academy of Sciences through the DOC programme. The author is thankful to comments by the participants of the Empirical Econometrics Research seminar at the IHS, especially by Helmut Hofer, Robert Kunst, and Rudolf Winter-Ebner.
Introduction 1 1 The Effects of Monetary Policy 3
1.1 The model ... 3
1.2 Results ... 4
2 Impact of Financial Structure 6
2.1 Sigma-Convergence ... 82.1.1 Concept ... 8
2.1.2 Results ... 9
2.2 Cluster Analysis ... 14
2.2.1 Concept ... 14
2.2.2 Results ... 15
2.3 Panel Regression Analysis ... 17
2.3.1 Concept ... 17
2.3.2 Results ... 18
Conclusions 20 References 21 A Data Description 23 B Regression Specifications 26 C Regression and Test Statistics 27
C.1 Multiplier Models – Regression Statistics ... 27C.2 Residual Tests ... 31
C.3 Panel Regression Tests ... 35
Introduction
During the 1990s eorts to foster integration of the European market were intensied which led to an increase in the degree of integration. The single most outstanding event in the decade was the introduction of the common currency. This had - amongst other reforms - a strong impact on nancial markets. Out of nancial markets the money markets experienced the main push toward one single integrated market. Arbitrage opportunities were essentially reduced by the introduction of one currency managed by a single monetary authority through a single interest rate as well as a single Euro- area wide payment system. Another indication for the increased integration is the stark increase in intra-EMU cross-border interbank lending over the 1990s till now.
(Hartmann, Maddaloni & Manganelli 2003)
The integration of capital markets is not so pronounced, but there is evidence that capital market movements have synchronized over the last decade. (see Fratzscher 2001) The lesser degree of integration in capital markets points at factors which cannot simply be eliminated by the removal of cross-border transaction risk, stemming from exchange rates and divergent interest rates.
Therefore dierences in nancial structure were preserved in the course of European nancial integration. As a result, intermediaries, which are of considerable importance within the nancial structure of economies, play dierent roles, which is reinforced by the fact that only few cross-country mergers were observed in the EMU area until 2002.(see Schmidt 2001) The concentration on bank lending as well as the lack to draw resources from capital markets directly might also be rooted in the origin of the legal system in the country under consideration, as was put forward by a number of authors such as La Porta, Lopez-de Silanes, Shleifer & Vishny (1997), La Porta, Lopez-de Silanes, Shleifer & Vishny (1998) and Cechetti (1999). Summing up, nancial structure will have a considerable impact on the operation and eects of the European central bank and is likely to lead to asymmetries in the European monetary transmission.
(Mojon 2000)
As Amable (2003) demonstrates, even though there was some considerable trans-
formation of nancial structures within the last twenty years, most notably in France
(compare also Hackethal, Schmidt & Tyrell 2002) due to privatisation of the banking
sector and capital market reforms, through privatisation of parts of the economy other
than banking and pension reforms, nancial structures are far from being uniform. This
assigns dierent importance to intermediaries such as banks throughout Europe. Banks
will, depending on the environment they operate in, reinforce or stand against actions
of the central bank. In bank-based nancial systems, they will stand by their related
customers and provide resources even in a time of monetary tightness. Ehrmann, Gam-
bacorta, Sevestre & Worms (2003) stress the importance of banking networks, such as loan cooperatives and savings banks in some EMU economies like France, Germany, Austria and Finland. The question that therefore arises is whether dierences in nan- cial structure in Europe facilitate the operation of monetary policy of the European Central Bank or not as nancial structure seems to determine the nature of monetary transmission mechanism through interest rate setting behaviour.
Cottarelli & Kourelis (1994) were the rst to estimate the degree and speed of pass- through of interest rates trying to link the eects of monetary policy in various countries on banks and explaining it by nancial structure variables. They show that there is signicant inuence of nancial structure on the monetary transmission mechanism which diers between various countries. There are three other studies that seem to be of importance for the topic above. Mojon (2000) estimates the interest pass-through by a vector error correction model (VECM) for a rather large variety of dierent interest rates for some economies of the Euro area for various subsamples up until 1998. Therefore it is not possible to draw any conclusions about the eects of the introduction of the common currency. de Bondt (2005) also estimates interest pass-through VECMs for the Euro area as a whole between 1996 and 2001. Again, as for Mojon this specication does not allow to test for convergence issues as a VECM implies that there is no adjustment to a new equilibrium but to the old. This is unlikely to occur when a new policy regime like a common currency is introduced. With respect to convergence Haan, Sturm &
Toolsema (2001) provide interesting insights. In contrast to de Bondt (2005) they estimate interest channels for a small set of individual member states of the European union. They secondly let the pass-through parameters in contrast to VECMs vary over time to tackle the question whether dierences in interest pass-through across countries vanish over time due to the introduction of the Euro. They nd however little evidence of convergence, but this may be due to the relatively short span of the Euro in operation.
This paper tries to redo on the one hand the analysis of Haan et al., as we have a longer period of the Euro in operation. On the other hand it goes beyond their analysis in terms of countries covered and the convergence analysis undertaken combined with nancial structure considerations. Thirdly it investigates the role of nancial structure as an explanation for the dierences in the immediate interest pass-through in the European economies under consideration.
To test for the inuence of the nancial structure the following hypotheses will be evaluated:
Hypothesis 1 There is convergence in the transmission mechanism within the EMU member states.
Hypothesis 2 There is faster convergence between countries with similar nancial
structures than between economies with dierent nancial structures.
Hypothesis 3 Due to the rigidity of nancial structures there will not be any signif- icant speeding up of convergence in the European monetary transmission mecha- nism due to the introduction of the Euro.
These three hypotheses lie at the heart of this paper. The rst tests whether there is convergence at all. Given that there is convergence hypothesis 2 states that one should see a faster pace of convergence between countries with similar nancial structures which was not considered in Haan et al. (2001). The third hypothesis then aims to disentangle exchange rate risk and the nancial structure eect. So if all three hypotheses cannot be rejected we have established that it is the nancial structure that is important for the degree of asymmetry.
The remainder of the paper is organized as follows. Section 1 estimates and discusses the main characteristics of the underlying econometric model. The second part (1.2) will present the main results of the rst step of the analysis. Section two presents the three ways convergence and nancial structure are linked in the paper, Sigma convergence, cluster methods and panel regression analysis.
1 The Eects of Monetary Policy
1.1 The model
In this section we estimate the pass-through of monetary policy impulses through the banking system of most old-EU economies. Even though this was done to some extent by Mojon (2000) the specication diers in this study as we take into account the dynamics of monetary integration. In contrast to Mojon (2000) the rolling regression technique is used to assess the time variation in the estimators. Furthermore we do not estimate cointegrating relationships between bank and policy interest rates as it is not clear whether there exists such a stable relationship or whether it has changed due to the introduction of the Euro. In this case we would estimate something that does not exist, a stable long run relationship between bank lending and money market rates.
The data coverage is the third distinguishing feature of this analysis. Last but not least, due to data availability, only a general bank lending rate instead of more precise bank interest rates was used. As a baseline, the model used is due to Cottarelli & Kourelis (1994), which also forms the basis of Mojon's (2000) model.
Cottarelli & Kourelis (1994) model assumes that nancial intermediaries such as
banks are not neutral conveyors of monetary policy impulses. This is motivated by the
observation that bank rates are relatively inelastic with respect to shifts in the demand
for loans as well as deposits and that bank rates change less in magnitude than do money market rates.
As a rst step, an equation that links bank lending rates to money market and discount rates is considered
1:
∆i
j,t= α
j,1+ α
j,2∆i
j,t−1+ β
j,0∆d
j,t+ . . . + β
j,k∆d
j,t−k+
γ
j,0∆m
j,t+ . . . + γ
j,n∆m
j,t−n+ u
j,t, (1) where ∆i
j,t, ∆m
j,tand ∆d
j,trepresent changes of the lending rate, money market rate and the discount rate at t for country j , where j = 1, . . . J . The values of β and γ will vary over the countries in the sample, therefore there will be a dierent degree of stickiness in the interest rates in every country. From the β s or γ s, various sets of multipliers are derived, which will be in general nonlinear functions of the two parameter sets, and are given by
h
m,0= γ
j,0, (2a)
h
d,0= β
j,0. (2b)
h
m,t+p= α
pj,2γ
j,0+ . . . + α
j,2γ
j,p−1+ γ
j,p=
p
X
i=0
α
p−ij,2γ
j,i, (3a) h
d,t+p= α
pj,2βj, 0 + . . . + α
j,2β
j,p−1+ β
j,p=
p
X
i=0
α
p−ij,2β
j,i. (3b) In the discussion we shall however mainly focus on the money market multiplier, taking into account the direct eect of monetary policy in some countries.
1.2 Results
Before showing the multipliers implied by the estimated country models, a few words about the model selection methodology. The country models are based on Cottarelli and Kourelis, and the optimal lag length was chosen by minimizing the AIC criterion.
As during the 1980s monetary policy did not solely rely on discount rate manipulation,
1This equation corresponds to Cottarelli & Kourelis's (1994) model 2. Model 1 is in levels for the lending rates and money market rates, whereas the discount rate is in dierences. The reason for that is that they want to control for policy changes which are signals to the market. Model 2 was chosen because nearly all interest rates of the countries investigated here are not stationary in levels, so that a model in rst dierences is more appropriate.
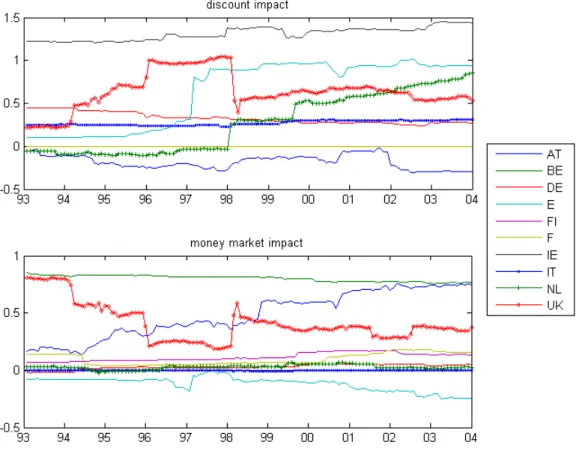
but also on other means such as credit control, the model selection was also undertaken between estimating a pure bank lending lending rate and money market rate model as well as a model that additionally included the discount rate of the central bank in the respective country. There is evidence in nearly every country, as gure 5 points out, that excluding the discount rate for the whole sample leads to a misspecication of the interest pass-through models as there is additional information in the discount rate, that is not captured by variation in the money market rates only.
For the assessment of the impact of European monetary policy discount rates of central banks exert a statistically positive inuence on bank lending behavior. Not taking this into account leads to misspecied models for these countries.
Figure 5 in the appendix plots the dierence of absolute values between the absolute value of the AIC of the money market rate only model and the absolute value of the AIC of the model also including the discount rates over time. If the dierence is positive, then we would select the money market rate only model, if negative we would do the opposite.
In case of Belgium, Ireland, Italy and the Netherlands it can be seen that the inclusion of the discount rate makes the mixed specication better over time, whereas in France and Finland the dierence is stable at slightly below zero. For the case of Austria and the UK the money market rate only specication is preferable. Nevertheless in order to ensure comparability with the other models the discount rate was included. For Finland the money market only model was chosen, as there is not that a big dierence between both specication on the one hand and because the discount rate series for Finland only just begins in 1987, which considerably restricts the number of estimation subperiods. The exact specications which were chosen are shown in appendix B.
The money market multipliers
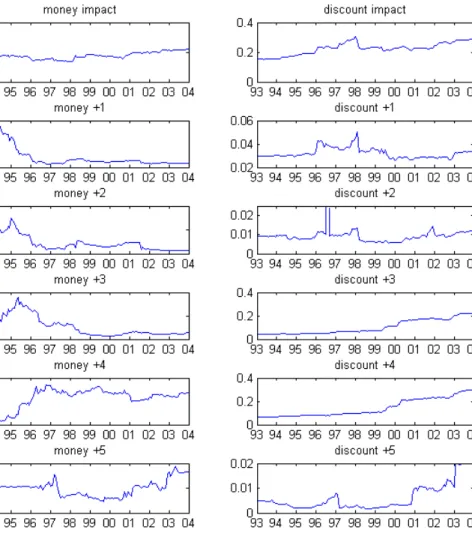
Figure 1 shows some important results. Only the impact multipliers are shown , but gures (6) and (7) in the appendix will show some of the patterns at the beginning and at the end of the sample period. As these gures show, the model mainly characterizes the rst four periods following a money market rate shock. For the fth and sixth we nd hardly any signicant movement. This is in line with the analysis of Cottarelli &
Kourelis, as they have rstly set up a model which analyzes the short run eects only, which secondly produces signicant multipliers up to the third lead. This can be also justied on the basis of economic theory as in the long(er) run other factors such as the demand for loans are important determinants for bank lending rates.
The impact multipliers for market oriented economies like the Netherlands or the
UK are stronger than for typical bank-based economies such as Germany. Also, as
Hackethal et al. (2002) and Amable (2003) explain, France is moving toward the group
of market-oriented economies due to structural reforms in the mid-1980s. This develop-
ment becomes dominant at the end of the time span. Thus, the French banks' response
Figure 1: Impact Multipliers
to money market movements is stronger in latter regressions than in previous.
Belgium and Austria deserve special attention. According to Amable (2003) Belgium displays the second lowest intermediation ratio of all EMU countries with a declining tendency. As a consequence it is not surprising that money market impulses are trans- mitted quite strongly. On the other hand Austria remains puzzling. As Amable shows Austria has by far the persistently highest degree of intermediation, which could explain the outstandingly high transmission after three months. But what remains puzzling is the high degree of transmission at impact.
2 Impact of Financial Structure
To link the multipliers to nancial structure variables, Cottarelli & Kourelis (1994) suggest that they depend on the structural features of the nancial structure of the economy:
h
j,l= Z
jη
l+ υ
j,l, (4)
where Z
jis a n-element vector describing the nancial structure of the economy j and υ
j,lare errors that are not correlated between the countries. Taking together all countries the multiplier system can be re-written in the following matrix form:
h
0= Zη
0+ υ
0, (5)
where Z is a J × K matrix and l = 0 , so that h
0is the impact multiplier. In a similar manner medium and long term multipliers can be formulated,
h
l= Zη
l+ υ
l. (6)
These equations enable us to study the eects of nancial structure on the eects of monetary policy in the various countries. While section 2 will deal with the multipliers and look at the development of these over time, section 3 will discuss the direct eect of nancial structure on the transmission of monetary impulses.
The empirical model combined with the rolling regression technique allows to track changes in the relationships we are interested in. There are various ways to characterize nancial structures of economies: We consider two concepts, the rst being the legal family concept due to La Porta et al. (1997) and for the second we follow the grouping by Amable (2003).
The idea behind the concept rst introduced by La Porta et al. (1997) is that the legal origin of the countries' law code matters for the role capital markets play within the economy, as they dier with respect to shareholder and investor protection. They globally nd four main families:
1. common law (English) 2. civil law
(a) French (b) Scandinavian
(c) German
Civil law countries do give fewer rights to parties in capital markets, but the rights are strongest enforced in German and Scandinavian countries.
By principal component and cluster analysis Amable (2003) pins down four groups
which are similar to the legal family grouping, but not entirely the same. He nds a
factor that explains 45 percent of the total variation, and which is dened by negative
and positive components:
1. negative: stock market cap. to GDP, ownership of large listed companies, per- centage of share held by institutional investors, M&A activity, accounting stan- dards, importance of venture capital
2. positive: ownership concentration, scope of public ownership % the public sec- tor, control of large rms by families, share of bonds in institutional investors' portfolios
From this rst step he performs a cluster analysis and nds four groups,
1. high level of protection, high importance of stock markets and institutional in- vestors, low public ownership
USA, Canada, UK, Switzerland, Australia and Japan 2. larger than average control of rms by nancial institutions
France, Norway and Sweden 3. low importance of family control
Ireland, Denmark, Finland and Austria
4. ownership concentration, lack of coherence to international accounting standards, low M&A activity, low development of capital markets
Germany, Spain, Italy Portugal and Greece
These two groupings will be taken as proposed by theory in the rst two sections of the section. To gain more robust evidence the following three ways are undertaken to assess potential changes, Sigma convergence, cluster analysis and panel regression analysis.
2.1 Sigma-Convergence
2.1.1 Concept
The concept of σ -convergence originally stems from the growth literature. It states that there is convergence (in growth) between a group of economies if the variation (in growth rates) within the group declines over time. This is of course a more general idea that is also applicable to other notions of convergence as well.
More explicitly, we are interested in the development of some kind of dispersion measure such as the standard deviation,
σ
K= v u u t
K
X
j=1
(m
j− m
K)
2, (7a)
where K is a group of k countries and m is the respective multiplier.
As however dierent dierent groups have dierent means this might bias the results and thus lead to the wrong conclusions. To take into account the dierent means we will alternatively consider the coecient of variation, which is dened as
cv
K=
q P
Kj=1
(m
j− m
K)
2m
K. (7b)
For this purpose the appropriate groups have to be dened. These groups should be found by using an appropriate measure for the nancial structure.
2.1.2 Results
Figures 2, 3 and 4 not only give the grouping eect according to nancial structure, but let us also assess possible convergence patterns across countries, over time and over the periods following a shock in the money market as well as discount rates.
Overall eects
Figure 2 displays convergence patterns distinguishing between money and discount rates. We nd that there is a clear trend towards a more uniform reaction of banks after one to three months. This pattern clearly emerges in the late 1980s/ early 1990s, as the mass of observations are in the subsamples at the beginning. However for the discount rate multipliers there is a clear trend toward diversity over the 1990s and the beginning of the new century. From the discussion about measuring monetary policy and the relative importance of money market and discount rates we have to give more weight to the money market rate, especially as the discount rate multiplier is not included in a third of the economies involved. Summing up we cannot reject hypothesis one, even though there seems to be a contrary development for the impact multiplier and the reaction four to six months after the interest rate movement.
It should be noted at this stage that the convergence measures for gures 2, 3 and 4
dier in the sense that gure 2 uses the ordinary standard deviation measure, whereas
the latter gures show coecients of variation for obvious reasons.
Figure 2: Variance of Multipliers
Legal Family
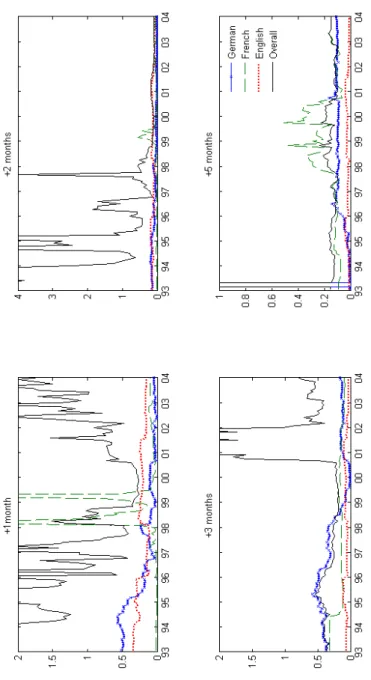
Looking at the money market rst, grouping according relative to legal families does have an important inuence on the variation of bank behavior in the rst three and the fth months after the movement in the money market and only these are shown.
The remainig months are not shown for presentational clearness. As to the impact multiplier a signicant impact cannot be found, as the French legal families response as well as the German families response is being more and more divergent. In case of the French family this seems to have to do with the money-market eect in Belgium, which is by far larger than in all the other economies within this group. For the German legal family this divergence seems to be driven by the Austrian development.
There is convergence in monetary transmission in Europe in the 1990s. This conver- gence can be observed in the rst three month following a money market rate movement.
Financial Structure
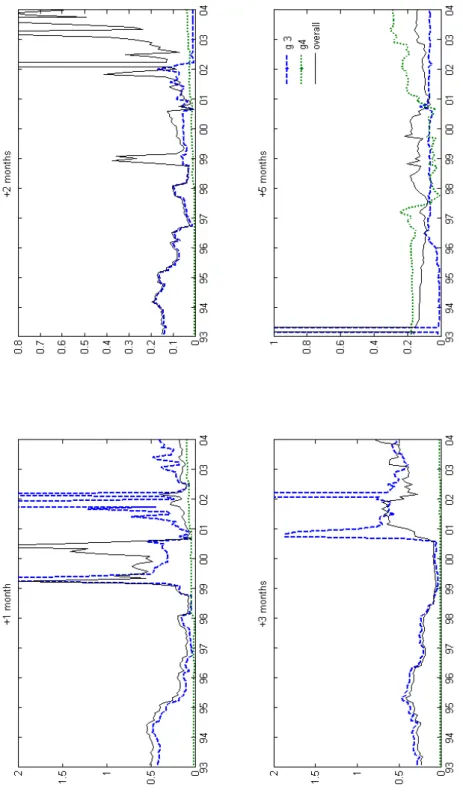
Looking at nancial structure from a less historical perspective and for the other strategy that uses the Amable-factors a problematic feature is that we have to drop the Netherlands and can only look at group three and four because we only have the UK of his group one and for group two we only have France. Therefore it does not make sense to look at deviation measures for the rst two groups.
For the money market (gure 4) grouping makes sense for ve out of six cases (5th month after the change in the money market rate). Similar to the legal family distinction a signicant grouping eect for the impact and the rst three months after the change in the money market rate is obtained. This seems to be robust across the two grouping procedures.
Given convergence in Europe following a money market movement in the rst three months, the dispersion between countries with similar nancial structure is further reduced. There is a signicant impact of nancial structure on the convergence of the European monetary transmission.
The conclusion is that there is a clear pattern of convergence in the money market
in the rst three months following an interest rate movement. This is is even rein-
forced when we look at the grouping motivated by nancial structure. Not only do
we nd convergence in these months, but furthermore the variation in countries with
similar nancial structure is also lower in these economies. This might be interpreted
as an indication that nancial structure inuences the convergence of the monetary
transmission mechanism.
Figure 3: Variation due to legal family
Figure 4: Variation due to nancial structure
2.2 Cluster Analysis
2.2.1 Concept
The cluster approach
2turns the problem of σ -convergence upside down as from only observing the estimated multipliers groups will be formed. It is interesting whether the groups that are formed on the basis of some measure that will later correspond to the groups that nancial structure would predict.
For our purposes we dene for each sample period n = 1, . . . , N and country j = 1, . . . , J a point
s
n,j= (h
j,m,0, h
j,d,0, . . . , h
j,m,p, h
j,d,p) , (8) where p are again periods ahead, h are the multipliers and m and d refer to the money market and discount rates respectively.
Starting with s
n,jgroups on the basis of minimizing the distance between the country points, groups with similar characteristics will be formed. The classical concept of distance between points is Euclidian distance, which is dened as follows. Take any two points s
i= (x
1, x
2, . . . , x
p) and s
j= (y
1, y
2, . . . , y
p) , the Euclidian distance is dened by
d
i,j= [(x
1− y
1)
2+ . . . + (x
p− y
p)
2]
1/2.
In general there are two ways to do cluster analysis, hierarchical and non - hierar- chical clustering. Within the rst class it can be distinguished between agglomerative and divisive methods. In case of the agglomerative method J clusters are the star- ing points, so each country forms a cluster. The two closest clusters are successively combined until only one cluster, which consists of the whole group, remains. Divisive methods start from the biggest available group and step down until there are exactly J groups. A popular way to nd the closest cluster to a given cluster is the centroid technique. For the agglomerative cluster method each cluster consists of only one point.
The centroid is the point the coordinates of which are just the mean of all coordinates of the points in the respective cluster. So at the start each point is the centroid of its own cluster. Then the two points the centroids of which are closest are grouped into one cluster. Afterwords the minimal distance between the centroids of all clusters is searched and the two clusters with the minimal distance are formed and so on until one single cluster is left.
A popular non-hierarchical clustering technique is k-means clustering. For this method the points are grouped into K clusters by some method. The centroids of these clusters are calculated. Then the distance between every point in the set and the
2The discussion of cluster analysis follows closely A, Clark & May (2004), chapter 16
centroid of each cluster is calculated. If it is closest to its own centroid the point is kept within the group. If not it is assigned to the centroid of the group the centroid of which it is closest. This is repeated until no point is re-assigned.
2.2.2 Results
In the following subsection another way of detecting convergence is presented. Given the sets of multipliers for the economies, can groups be identied and if yes, do these correspond closely to the ones, the grouping of which is motivated by theory, i.e. legal family or nancial structure groups?
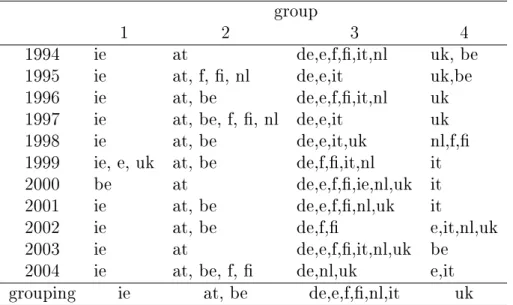
For this purpose we rst consider partitional clustering and look at the four group stage given in tables 1 and 2.
Table 1: Partitional Cluster Analysis: both multipliers group
1 2 3 4
1994 ie at de,e,f,,it,nl uk, be
1995 ie at, f, , nl de,e,it uk,be
1996 ie at, be de,e,f,,it,nl uk
1997 ie at, be, f, , nl de,e,it uk
1998 ie at, be de,e,it,uk nl,f,
1999 ie, e, uk at, be de,f,,it,nl it
2000 be at de,e,f,,ie,nl,uk it
2001 ie at, be de,e,f,,nl,uk it
2002 ie at, be de,f, e,it,nl,uk
2003 ie at de,e,f,,it,nl,uk be
2004 ie at, be, f, de,nl,uk e,it
grouping ie at, be de,e,f,,nl,it uk
Looking at the overall eect a clear separation of the Common Law system from the Civil Law system can be observed, as both, Ireland and the UK are clearly separated over the individual years as well as on average. The dierence between German and French law system seems to be less pronounced in comparison, as France and Germany as well as Belgium and Austria are often grouped into the same category. It is interesting that in every year, France and Finland seem to be closest, as they are always in the same group.
Taking the other proposed proxy for nancial structure proposed by Amable, there
seems to be a clear contradiction to Amable's (2003) results, as France (an Amable
group 2 country) an Germany (an Amable group 4 country) are grouped almost always
in the same group in this analysis. What is in line with Amable (2003) is the grouping
of Italy, Germany and Spain in the overall consideration.
Table 2: Partitional Cluster Analysis: money market multipliers group
1 2 3 4
1994 at de,e,ie,it f,,nl be,uk
1995 at de,f,,ie,it,nl e be,uk
1996 at de,f, e,ie,it,nl be,uk
1997 at,be de,f,,ie,it,nl e uk
1998 at,be de,f,,ie,it,nl e uk
1999 at de,f,,ie,it,nl,uk e be
2000 at,be de,f,,ie,it,nl e uk
2001 at,be,uk de,f,ie,it,nl e
2002 at de,e,ie,it,nl be uk,f,
2003 at de,f,,ie,it,nl e uk,be
2004 at,be de,ie,it,nl f, uk
grouping at de,f,,ie,it,nl e uk
Additional to that a hierarchial cluster method was undertaken, which is summa- rized in table 3. Dissimilarity between the economies increased in the late 1990s, but decreased after 2000, which is compatible with the results obtained from the section on sigma convergence. Another similarity can be seen in table 1 that Ireland and the UK occupy a special position, and most European economies are grouped into one group, which appears to be growing over time.
Table 3: Hierarchial Cluster Method
minimal distance* group
for 4 clusters 1 2 3 4
1995 0.92 at, f, , nl de, e, it ie be, uk
1997 1.02 at, be de, e, f, , it, nl ie uk 2000 1.03 at, be de, f, , it, nl, uk e ie 2003 0.68 at, be de, f, , it, nl, uk e ie
*Euclidian distance metric
Observing the pattern of monetary transmission mechanism we cannot identify groups according to their nancial structure.
Considering the subset of money market multipliers the UK still diers from the
rest of Europe, but also Austria is separated. This latter observation can potentially be
attributed to the strong and dominant impact eect of the Austrian money market on
bank-credit interest rates. Another dierence to table 1 is that Spain is nearly always
singled out. Again the dierence between French and German legal families does not
seem to be too strong as in the overall case. As Amable (2003) is concerned the money
market multiplier that groups 3 and 4 (with the notable exceptions of Austria and Spain) seem to have merged. So judging from cluster analysis we cannot fully identify groups due to nancial structure from only looking at the response of banks in the respective economies.
2.3 Panel Regression Analysis
2.3.1 Concept
Another way to assess the impact of nancial structure on monetary transmission is to estimate it directly by a panel regression. Within this framework proxies for the nancial structure can be directly tested for their inuence on monetary transmission, in this case on the multipliers of the money market as well as the discount rate multipliers.
By a panel regression the (set of) economy(ies) we are interested in can be accounted for more directly.
More formally we have the following system:
h
0,(j,t)= Z
jtη + u
j,t, (9a)
u
j,t= µ
j+ ν
jt, (9b)
where j = 1, . . . , J , t = 1, . . . , T , Z
jtis a vector of nancial structure variables, µ
jmeasures the individual eect in country j and ν
jt∼ N (0, 1) is a disturbance term.
The parameter vector η accounts for the inuence of nancial structure on the transmission of monetary policy impulses. We rst require all the parameters to dier signicantly from zero. As we also take into account time we will incorporate the Euro eects and this will have of course inuence the estimation of the parameters.
If we were to account for changes over time, we could slightly change the specication of equation (9b) to
u
j,t= µ
j+ λ
t+ ν
jt, (9c)
where λ
tmeasures the time-specic eects. The model comprised of equations (9a) and (9c) is typically referred to as a two-way panel.
The following structural variables will be used:
1. Volatility of of the money market
residuals from an ARMA(p,q) tted to the money market rate 2. Capital market deepness
ratio of domestic market capitalization to GDP
3. Degree of intermediation
(a) bank deposits to GDP and
(b) bank credits to GDP (both overall and non-nancial corporations)
To account for other inuences also ination is included in the panel regression estimates.
From the previous discussion the following expectations can be made about the inuence of nancial structure variables.
In an economy where nancial structure matters all variables have a signicant in- uence on the multipliers. In countries with a higher degree of intermediation volatility and capital market deepness exerts a lesser whereas the degree of nancial intermedi- ation exerts a higher inuence on the multipliers. In bank based or relationship based economy the latter eect is expected to dominate the other two and thus a negative in- dividual eect ( µ
j), which is reversed for the market based or (arm's length) economies.
2.3.2 Results
Of the countries investigated previously we unfortunately had to drop UK and Ireland as for the UK there are not bank deposit series in the IFS database and for Ireland the market capitalization is only published from 1994 onwards. Whether to include Ireland or not is debatable, even if the data were observable, as it is expected that the inclusion of this economy would have adverse eects on the results due its fast growth during the 1990s. As table 11 in the appendix shows there is no signicant dierence between the one- and the two way models, whereas the poolability tests indicate that estimating a pooled regression is worse than estimating a panel regression model. In order to achieve parsimony the one-way xed eects model was chosen. Given that there are only 8 countries in the sample a xed eects model is clearly the better choice over a random eects model. Five specications were estimated.
In table 4 the variables market capitalisation( mc ), bank deposits to GDP ( bd ) and
the yieldspread ( ys ) inuence the impact money market multiplier signicantly. Start-
ing with the maximum specication as discussed above we consecutively dropped all
insignicant variables until all variables were signicant. This was done in a way to
avoid a decrease in the adjusted R-squared. If such a decrease occured we would have
left the otherwise insignicant variable in the regression. The variable bd shows a posi-
tive inuence on the multiplier as expected. As the inuence of banks channeling funds
from households to rms increases so does the rigidity of banks with respect to money
market movements. The negative coecient of mc is not easily interpretable. It could
probably be explained by the fact that if banks dominate the stock market, the higher
Table 4: Panel Regression Results
(1) (2) (3) (4) (5)
market cap. .0005 -.0016 -.0018 -.0020 -.0019
(.0009) (.0005) (.0006) (.0006) (.0006) bank dep./GDP -2.1510 2.7579 2.6056 2.5071 2.5713 (.5286) (.5588) (.5907) (.5828) (.5842)
yieldspread .0115 .0202 .0165 .0154 .0194
(.0181) (.0058) (.0074) (.0067) (.0076)
AT
-
.1980 .1896 .2004 .2333(.054) (.0547) (.0533) (.0660)
BE*
-
.2735 .2981 .3112 .2959(.0354) ( .0466) (.0442) (.0461)
DE*
-
-.5639 -.5429 -.5319 -.5455(.039) (.0469) (.0449) (.0464)
E*
-
-.7372 -.7116 -.6972 -.7118(.0443) (.0545) (.0524) (.0539)
F*
-
-.5711 -.5483 -.5322 -.5395(.0561) (.0629) (.0622) (.0624)
FI*
-
-.5314 -.4924 -.4702 -.4921(.0460) (.0666) (.0630) (.0658)
IT*
-
-1.0127 -.9708 -.9462 -.9685(.1129) (.1243) (.1216) (.1229)
NL*
-
-.5653 -.5226 -.4972 -.5191(.0430) (.0679) (.0645) (.0671)
t
- -
.0043-
-.0145(.0053) (.0128)
t2
- - -
.0006 .0017(.0004) (.0011)
Obs. 80 80 80 80 80
Adj. R-squ. 0.1525 0.9498 0.9496 0.9505 0.9507
F-Stat. 5.74 150.55 136.25 138.99 128.06
Standard Errors in parentheses.
* relative to Austria
their inuence in capital markets the lower the power of the market to compete with the banks. This crucial implication depends on the assumption that banks are domi- nant players in capital markets. The yield spread is the third source of inuence, and it has a positive eect. Considering a positive spread, when the margin between long and short term interest rates widens, it becomes more attractive for banks to adjust their portfolio. This is due to the fact that every adjustment is costly and therefore only adjustment is undertaken if the gains from rebalancing the portfolio exceed the corresponding costs. This occurs more often the bigger the spread in yields.
Financial structure signicantly inuences the extent of monetary transmission, be- cause nancial structure factors exert a signicant impact on the magnitude of trans- mission of interest movements by European banks.
Furthermore all country dummies are signicant. Belgium, which displays the lowest intermediation ratio, has also a bigger multiplier than Austria. Netherlands and France which usually display low degrees of intermediation have however a smaller intercept term than Austria. This could be attributed to the fact that French and Dutch banks are more international, which dampens the propensity of banks to react to money market movements.
We consecutively eliminated insignicant explanatory variables, still the signs were preserved and the variables mc , bd and ys stayed signicant.
From specications (3) - (5) there is no signicant and common inuence of the trend, neither linear nor quadratic on the impact multiplier. Also the sign of the coecients remain unchanged. As however only 10 time points could be used this should be treated with caution. After the inclusion of various forms of trends the inuence of the proxies for nancial structures are reduced whereas the inuence of country specics are more pronounced, which could be interpreted as an indication for a change. The adjusted R-squared indicates that model (5) is preferred to model (3) , indicating a negative non-linear trend for h
0,m.
Conclusions
This paper has several objectives. First it tries to investigate how to best assess the
impact of monetary policy on bank behavior. The result is that for the structure
of the chosen model it is best for most European countries to include the discount
rate next to the money market rate, because this exerts statistical inuence on bank
behavior. Secondly we nd that not accounting for the change in European monetary
transmission over the last decade and only estimating a cointegration relationship misses
the essential development in European monetary policy: the convergence of the nature
of monetary transmission. This study argues that bank behavior after a money market
rate movement has in fact synchronized over the 1990s, not at impact but at the three months following the movement. This is even more emphasized when countries with similar nancial structure are grouped accordingly. Starting with the nature of bank response and trying to form groups accordingly, these do not resemble groups with similar nancial structure however. Last but not least we established that there is a signicant impact of nancial structure, because factors such as the ratio of bank deposits to GDP or market capitalization to GDP as well as the term structure have a statistically signicant impact. So all in all we do not nd a falsication of the three hypotheses proposed.
References
A, A., Clark, V. A. & May, S. (2004), Computer Aided Multivariate Analysis, 4th edn, Chapman & Hall/CRC.
Amable, B. (2003), An overview of nancial systems' diversity, in `The Transformation of the European Financial System. Where do we go? Where should we go?', OENB.
Cechetti, S. G. (1999), `Legal structure, nancial structure, and the monetary policy transmission mechanism', FRBNY economic policy review 5, 928.
Cottarelli, C. & Kourelis, A. (1994), `Financial structure, bank lending rates, and the transmission mechanism of monetary policy', IMF Sta Papers 42(3), 670 700.
de Bondt, G. J. (2005), `Interest pass through: Empirical results for the euro area.', German Economic Review 6, 33.
Ehrmann, M., Gambacorta, L., Sevestre, P. & Worms, A. (2003), `The eects of mon- etary policy in the Euro area', Oxford Review of Economic policy 19(1), 5872.
Fratzscher, M. (2001), Financial market integration in Europe, Working Paper 48, ECB.
Haan, J. d., Sturm, J. E. & Toolsema, l. A. (2001), Convergence of monetary transmis- sion in EMU. new evidence, CesIfo WP Nr. 465, CESIfo.
Hackethal, A., Schmidt, R. & Tyrell, M. (2002), `The convergence of nancial systems in Europe', Schmalenbach Business Review 1(02), 752. Special Issue.
Hartmann, P., Maddaloni, A. & Manganelli, S. (2003), `The Euro area nancial system:
structure, integration, and policy initiatives', Oxford Review of Economic policy
19, 180213.
La Porta, R., Lopez-de Silanes, F., Shleifer, A. & Vishny, R. (1997), `Legal determinants of external nance', Journal of Finance 52(3), 111311150.
La Porta, R., Lopez-de Silanes, F., Shleifer, A. & Vishny, R. (1998), `Law and nance', Journal of the Political Economy 106(6), 111355.
Mojon, B. (2000), Financial structure and the interest rate channel of ecb monetary policy, Working paper no. 42., ECB.
Schmidt, R. (2001), The future of banking in europe, Working Paper 72, Johann Wolfgang v. Goethe Universitaet, Frankfurt am Main. Fachbereich Wirtschaftswis- senschaften.
White, H. (1980), `A heteroskedasticity-consistent covariance matrix estimator and a
direct test for heteroskedasticity', Econometrica 48(4), 81738.
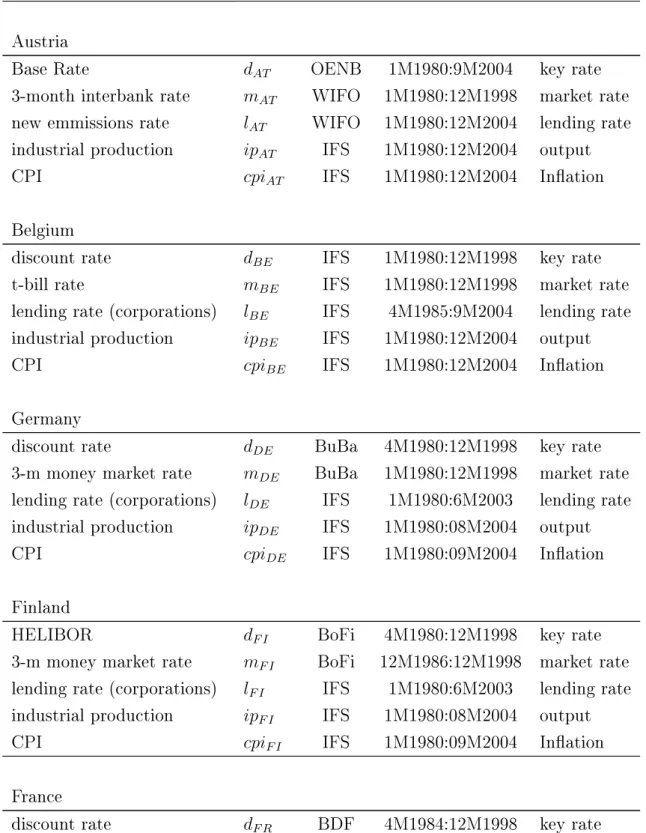
A Data Description
Table 5: Data Description
Type Label Source Range category
Austria
Base Rate d
ATOENB 1M1980:9M2004 key rate
3-month interbank rate m
ATWIFO 1M1980:12M1998 market rate new emmissions rate l
ATWIFO 1M1980:12M2004 lending rate industrial production ip
ATIFS 1M1980:12M2004 output
CPI cpi
ATIFS 1M1980:12M2004 Ination
Belgium
discount rate d
BEIFS 1M1980:12M1998 key rate
t-bill rate m
BEIFS 1M1980:12M1998 market rate
lending rate (corporations) l
BEIFS 4M1985:9M2004 lending rate industrial production ip
BEIFS 1M1980:12M2004 output
CPI cpi
BEIFS 1M1980:12M2004 Ination
Germany
discount rate d
DEBuBa 4M1980:12M1998 key rate
3-m money market rate m
DEBuBa 1M1980:12M1998 market rate lending rate (corporations) l
DEIFS 1M1980:6M2003 lending rate industrial production ip
DEIFS 1M1980:08M2004 output
CPI cpi
DEIFS 1M1980:09M2004 Ination
Finland
HELIBOR d
F IBoFi 4M1980:12M1998 key rate
3-m money market rate m
F IBoFi 12M1986:12M1998 market rate lending rate (corporations) l
F IIFS 1M1980:6M2003 lending rate industrial production ip
F IIFS 1M1980:08M2004 output
CPI cpi
F IIFS 1M1980:09M2004 Ination
France
discount rate d
F RBDF 4M1984:12M1998 key rate
to be continued ...
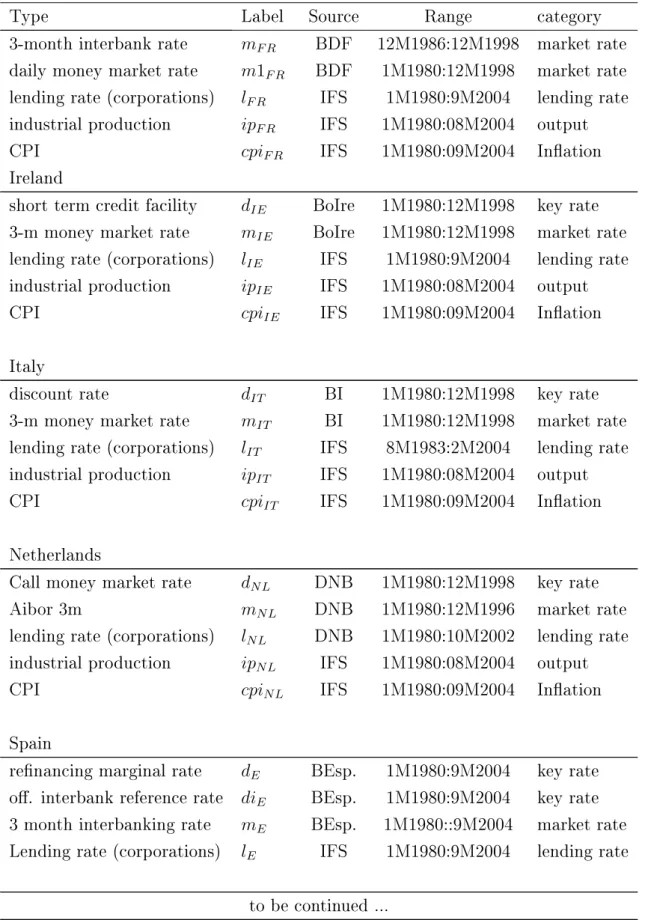
Table 5: Data Description
Type Label Source Range category
3-month interbank rate m
F RBDF 12M1986:12M1998 market rate daily money market rate m1
F RBDF 1M1980:12M1998 market rate lending rate (corporations) l
F RIFS 1M1980:9M2004 lending rate industrial production ip
F RIFS 1M1980:08M2004 output
CPI cpi
F RIFS 1M1980:09M2004 Ination
Ireland
short term credit facility d
IEBoIre 1M1980:12M1998 key rate 3-m money market rate m
IEBoIre 1M1980:12M1998 market rate lending rate (corporations) l
IEIFS 1M1980:9M2004 lending rate industrial production ip
IEIFS 1M1980:08M2004 output
CPI cpi
IEIFS 1M1980:09M2004 Ination
Italy
discount rate d
ITBI 1M1980:12M1998 key rate
3-m money market rate m
ITBI 1M1980:12M1998 market rate lending rate (corporations) l
ITIFS 8M1983:2M2004 lending rate industrial production ip
ITIFS 1M1980:08M2004 output
CPI cpi
ITIFS 1M1980:09M2004 Ination
Netherlands
Call money market rate d
N LDNB 1M1980:12M1998 key rate
Aibor 3m m
N LDNB 1M1980:12M1996 market rate
lending rate (corporations) l
N LDNB 1M1980:10M2002 lending rate industrial production ip
N LIFS 1M1980:08M2004 output
CPI cpi
N LIFS 1M1980:09M2004 Ination
Spain
renancing marginal rate d
EBEsp. 1M1980:9M2004 key rate o. interbank reference rate di
EBEsp. 1M1980:9M2004 key rate 3 month interbanking rate m
EBEsp. 1M1980::9M2004 market rate Lending rate (corporations) l
EIFS 1M1980:9M2004 lending rate
to be continued ...
Table 5: Data Description
Type Label Source Range category
UK
Monthly average of El. bills d
U KBoE 1M1980:10M2004 key rate discount rate, 3 month
t-bill rate m
U KIFS 1M1980:9M2004 market rate
lending rate l
U K1M2004:8M2004 lending rate
industrial production ip
U KIFS 1M1980:08M2004 output
CPI cpi
U KIFS 1M1980:09M2004 Ination
EMU Data
main renancing, xed rate d
EM UECB 1M1999:6M2000 key rate main renancing, min. rate d
EM UECB 6M2000:1M2005 key rate
EURIBOR, 3m m
EM UBuBa 1M1999:1M2005 market rate
xed conversion rates - ECB - -
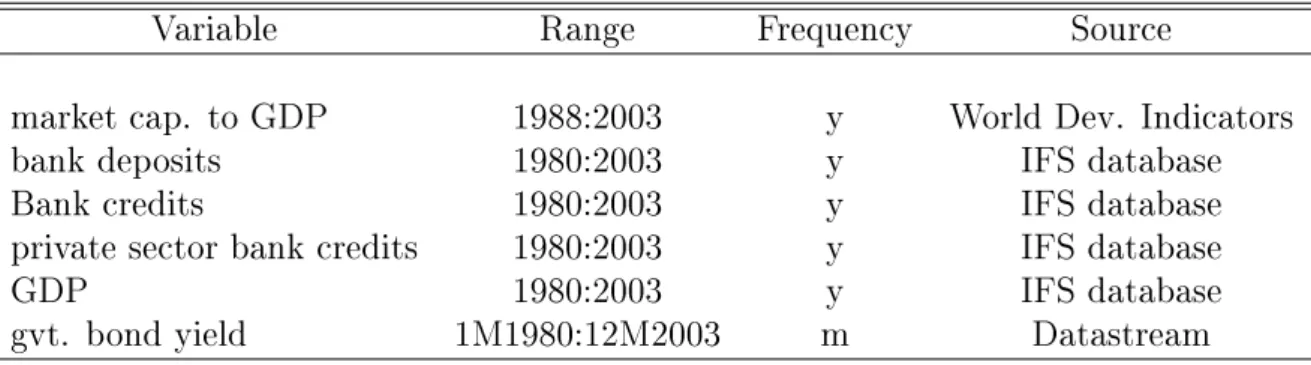
Table 6: Panel Regression Data
Variable Range Frequency Source
market cap. to GDP 1988:2003 y World Dev. Indicators
bank deposits 1980:2003 y IFS database
Bank credits 1980:2003 y IFS database
private sector bank credits 1980:2003 y IFS database
GDP 1980:2003 y IFS database
gvt. bond yield 1M1980:12M2003 m Datastream
B Regression Specications
Austria
∆l
at,t= α
0+ α
1∆l
at,t−1+ β
0∆d
at,t+ γ
0∆m
at,t+ γ
1∆d
at,t−1+
γ
2∆m
at,t−2+ γ
3∆m
at,t−3+
t(10)
Belgium
∆l
be,t= α
0+ α
1∆l
be,t−1+ γ
0∆m
be,t+ γ
1∆d
be,t−1+ γ
2∆m
be,t−2+
γ
5∆m
be,t−5+ γ
7∆m
be,t−7+ γ
8∆m
be,t−8+
t(11) Germany
∆l
de,t= α
0+ β
0∆d
de,t+ β
2∆d
de,t−2+ β
3∆d
de,t−3+ β
4∆d
de,t−4+
β
5∆d
de,t−5+ γ
0∆m
de,t+
t(12)
Spain
∆l
e,t= α
0+ α
1∆l
e,t−1+ β
0∆d
e,t+ β
1∆d
e,t−1+ β
3∆d
e,t−3+
β
4∆d
e,t−4+ β
5∆d
e,t−5+ β
7∆d
e,t−7+ γ
0∆m
e,t+ γ
4∆m
e,t−4+ (13) γ
5∆m
e,t−5+ γ
6∆m
e,t−6+ γ
10∆m
e,t−10+ γ
11∆m
e,t−11+
tFinland
∆l
f i,t= α
0+ α
1∆l
f i,t−1+ P
5i=0
γ
i∆m
f i,t−i+
t(14)
France
∆l
f,t= α
0+ α
1∆l
f,t−1+ P
14i=0
γ
i∆m
f,t−i+
t(15)
Ireland
∆l
ie,t= α
0+ α
1∆l
ie,t−1+ β
0∆d
ie,t−0+ β
1∆d
ie,t−1+ β
3∆d
ie,t−3+
β
4∆d
ie,t−4+
t(16)
Italy
∆l
it,t= α
0+ α
1∆l
it,t−1+ P
2i=0
β
i∆d
it,t−i+ γ
0∆m
it,0t(17) The Netherlands
∆l
nl,t= α
0+ α
1∆l
nl,t−1+ P
6i=0
β
i∆d
nl,t−i+ γ
0∆m
nl,0t(18) United Kingdom
∆l
uk,t= α
0+ α
1∆l
uk,t−1+ β
1∆d
uk,t−1+ β
2∆d
uk,t−2+ β
6∆d
uk,t−6+
β
10∆d
uk,t−10+ +γ
0∆m
uk,t+
t(19)
C Regression and Test Statistics
C.1 Multiplier Models - Regression Statistics
Figure 5: Modelselection by AIC
Figure 6: Multipliers (money market rate)
Figure 7: Multipliers (discount rate)
C.2 Residual Tests
As table indicates 7 we have serial correlation in Germany, France, Finland and Italy indicating changes in the nature of the estimated relationship as when estimating the rolling regressions this autocorrelation disappears.
The regression residuals from France, Finland and Italy display heteroskedasticity.
Thus, the rolling regressions are estimated as before, but the standard errors are calcu- lated correcting for heteroskedasticity, which is due to White (1980) and computes the variance - covariance matrix the following way:
Σ = b T
T − k (X
0X)
−1T
X
t=1
u
2tx
tx
0t!
(X
0X)
−1where u
tare the OLS residuals, T is the sample size and X is a T × k matrix of regressors.
Table 7: Breusch-Godfrey Serial Correlation LM Test Austria
F-statistic 16.87907 Probability 0 Obs*R-squared 44.52453 Probability 0 Belgium
F-statistic 3.675106 Probability 0.000498 Obs*R-squared 28.22671 Probability 0.000433 Germany
F-statistic 1.557115 Probability 0.160072 Obs*R-squared 9.57447 Probability 0.143754 Spain
F-statistic 1.742387 Probability 0.059768 Obs*R-squared 22.61518 Probability 0.031176 France
F-statistic 0.806678 Probability 0.44755 Obs*R-squared 1.642769 Probability 0.439822
to be continued . . .
Table 7: Breusch-Godfrey Serial Correlation LM Test
Finland
F-statistic 0.334148 Probability 0.937485 Obs*R-squared 2.549151 Probability 0.923351 Ireland
F-statistic 12.27252 Probability 0 Obs*R-squared 43.55738 Probability 0 Italy
F-statistic 1.292046 Probability 0.276636 Obs*R-squared 2.642507 Probability 0.266801 The Netherlands
F-statistic 2.74554 Probability 0.01316 Obs*R-squared 16.4464 Probability 0.011548 UK
F-statistic 3.416235 Probability 0.000116 Obs*R-squared 39.19506 Probability 0.000098
Table 8: White Heteroscedasticity Test Austria
F-statistic 1.773358 Probability 0.05221 Obs*R-squared 20.7012 Probability 0.054931 Belgium
F-statistic 3.584163 Probability 0.000001 Obs*R-squared 63.22639 Probability 0.000007
to be continued . . .
Table 8: White Heteroscedasticity Test Germany
F-statistic 3.171316 Probability 0.000025 Obs*R-squared 50.14 Probability 0.000072 Spain
F-statistic 7.652177 Probability 0 Obs*R-squared 171.0423 Probability 0 France
F-statistic 0.296645 Probability 0.938119 Obs*R-squared 1.818618 Probability 0.935602 Finland
F-statistic 1.361072 Probability 0.14832 Obs*R-squared 26.35834 Probability 0.1543 Ireland
F-statistic 65.63948 Probability 0 Obs*R-squared 224.3686 Probability 0 Italy
F-statistic 0.15187 Probability 0.998807 Obs*R-squared 1.579833 Probability 0.998664 The Netherlands
F-statistic 10.1433 Probability 0 Obs*R-squared 116.7338 Probability 0 UK
F-statistic 10.1882 Probability 0
Obs*R-squared 155.1124 Probability 0
Table 9: Normality Tests
Austria Ireland
Jarque-Bera 381.33 Jarque-Bera 15941
probability 0 probability 0
Belgium Italy
Jarque-Bera 50.06 Jarque-Bera 90437
probability 0 probability 0
Germany The Netherlands
Jarque-Bera 6629.62 Jarque-Bera 726.51
probability 0 probability 0
Finland Spain
Jarque-Bera 5538.70 Jarque-Bera 1649
probability 0 probability 0
France UK
Jarque-Bera 390.81 Jarque-Bera 2538.9
probability 0 probability 0
C.3 Panel Regression Tests
Table 10: Variable description
Variable Description Calculation
MC Market capitalization as a share of GDP obt. from the DB (7 yr. ma*) bd Bank deposits to GDP obt. from the DB (7 yr. ma*) bpuc public bank loans to GDP obt. from the DB (7 yr. ma*)
(total loans - private loans)
bpc Bank credits to GDP obt. from the DB
(excl. public loans) (7 yr. ma*)
inf last year's Ination (1994, . . . , 2003)
ys Spread between government return (gvt. bonds) - mmrate bonds and 3-month mmrates
vola Volatility of the money market s.e. of tted ARMA processes from the mmr (2yr. ma*)
* ma = moving average
Table 11: Poolability Tests
pooled one-way two-way
rss 2.2054 0.29442 0.22998
df 7 64 55
Fstat. Fcrit dcrit
ols vs 1w 59.3431735 2.15 (n-1,nt-n-k)
ols vs 2w 67.48916055 2.18 (n-1,nt-n-t-k+1)
1w vs 2w 0.240795395 1.54 (nt-n-k,nt-n-t-k+1)
Author: Wolfgang Schwarzbauer
Title: Financial Structure and its Impact on the Convergence of Interest Rate Pass-through in Europe:
A Time-varying Interest Rate Pass-through Model Reihe Ökonomie / Economics Series 191
Editor: Robert M. Kunst (Econometrics)
Associate Editors: Walter Fisher (Macroeconomics), Klaus Ritzberger (Microeconomics)
ISSN: 1605-7996
© 2006 by the Department of Economics and Finance, Institute for Advanced Studies (IHS),
Stumpergasse 56, A-1060 Vienna • +43 1 59991-0 • Fax +43 1 59991-555 • http://www.ihs.ac.at
ISSN: 1605-7996