Report No.
Stabilization and Fiscal Empowerment:
The Twin Challenges Facing India's States
Volume II (Detailed Report) May 10,2004
Poverty Reduction and Economic Management Unit South Asia Region
Public Disclosure AuthorizedPublic Disclosure AuthorizedPublic Disclosure AuthorizedPublic Disclosure Authorized
82686-IN
82686 v2
Explanatory Note
This report is written in three different versions to suit a variety of audiences:
o The Executive Summary (in Volume I) is 4 pages long and gives a quick overview.
o The Main Report (also in Volume I) is 26 pages long, and conveys the main findings.
o The Detailed Report (in Volume II) is 90 pages long, and provides the detailed analysis.
The executive summary and main report are brief on attributions and sourcing to save space. We have in fact drawn heavily on work by Indian and international experts. Full referencing and attribution can be found in the technical report.
This report was prepared by a team consisting of Stephen Howes, Rinku Murgai, Smita Kuriakose (expenditure issues), Marina Wes, Farah Zahir, Bala Bhaskar Kalimili (fiscal issues), Ronnie Das-Gupta (revenue issues) and V.J. Ravishankar, Bill McCarten and Anwar Shah (fiscal federalism), Vidya Kamath, Shahnaz Rana, Rita Soni, and Jyoti Sriram (report management).
The report has benefited greatly from inputs by the whole India PREM Team, and from many sectoral colleagues.
Box 1: Definitions and Data
>-- If not indicated, the state-level data is aggregated for all states.
>-- Much of the report focuses on 14 major states, which make up 91% of the population oflndia.
>-- These 14 major states are further divided as poor states (those with a per capita income in 1999/00 ofRs.
10,000 or less at 1993/94 prices) and other states.
>-- The poor states are Bihar, Madhya Pradesh, Orissa, Uttar Pradesh and Rajasthan while the other states are Maharashtra, Punjab, Haryana, Gujarat, Kerala, Karnataka, Tamil Nadu, West Bengal and Andhra Pradesh.
>-- The data for the three newly created states (created in 2000/01) of Jharkhand, Chattisgarh and Uttaranchal have been aggregated with that of the states of Bihar, Madhya Pradesh and Uttar Pradesh respectively in order to maintain consistency over time. However, data for Jharkhand is not available for 2000/01 and so is not included in the analysis for 2000/01.
>-- New- state debt as published by the RBI is included in the old -state debt for 2000/01 (actuals) and 2001/02 (revised estimates).
>-- India's Gross Domestic Product (GDP) at market prices is used while referring to All States.
>-- Gross State Domestic Product (GSDP) atfactor cost is used for ratios involving the 14 major states, or individual states.
>-- Revenues receipts and expenditure are expressed net of lottery expenditures; other indicators are as reported by the Reserve Bank of India.
>-- The latest available actuals are used. This is 2001/02 for all states combined and 2000/01 for individual states (only revised estimates for 2001/02 are available for individual states; since we know at the aggregate level there is a large deviation for 2001/02 between revised estimates and actuals, we do not use the revised estimates). The revised estimates for 2002/03, which are available for all states, are used sparingly, and as indicated.
>-- For Bihar and Nagaland, 2000/01 figures are revised estimates.
>-- 1990 and 1990/91 both refer to the Indian fiscal year 1 April 1990-31 March 1991. Debt -stock is measured at the end of the fiscal year.
>-- The source for tables and figures, unless mentioned in the text is the World Bank State Fiscal Database, which is built up from RBI published state-finance data.
DETAILED VOLUME TABLE OF CONTENTS
CHAPTER 1: THE STATE- LEVEL FISCAL CRISIS OF THE LATE NINETIES; EVOLUTION AND IMPACT
I Introduction... . . 1
II India's states... 1
III Genesis. . . 3
IV Impact... 6
V Response. . . 1 0 VI Challenges. . . 13
CHAPTER 2: EXPENDITURE REFORMS I Overview and introduction... 16
II Salaries and pensions. . . 16
III Subsidies... 22
IV Public enterprise and debt restructuring... 27
V Reforms to improve the quality of spending... . . . 29
CHAPTER 3: REVENUE REFORMS I II III IV Introduction ... .. State own-revenue structure and reforms ... . Reforms to tax institutions ... . Conclusion ... . 34 35 47 50 CHAPTER 4: FISCAL FEDERALISM AND THE INCENTIVE FRAMEWORK FOR STATE- LEVEL REFORM I Introduction... 52
II Borrowing regime... 53
III Revenue transfers (grants)... 60
IV Conclusion... 71
CHAPTER 5: CONCLUSIONS AND PROSPECTS I Introduction... 76
II A no-reform scenario: what will happen if reforms stop?... 76
III A states' reform package... 77
IV Reform scenarios: do the reforms add up?... 80
V Scenarios for the poor states... 81
VI Risks... 82
VII Implications for the central government... 83
ANNEX TO CHAPTER 2: CASE STUDIES IN REFORMS TO IMPROVE EXPENDITURE QUJlLITY ... i... ... 85
ANNEX TO CHAPTER 3: INSTITUTIONS FOR REVENUE COORDINATION... 92
REF'ERENCES... 94
Table 1.1 Table 1.2 Table 1.3 Table 1.4 Table 1.5 Table 1.6 Table 2.1 Table 2.2 Table 2.3 Table 2.4 Table 2.5 Table 2.6 Table 2.7 Table 3.1 Table 3.2
Table 4.1 Table 5.1 Table 5.2 Table 5.3 Table 5.4 Table 5.5
Box 1.1 Box 1.2 Box 1.3 Box 1.4 Box 2.1 Box 2.2 Box 2.3 Box 2.4 Box 2.5 Box 2.6 Box 3.1 Box 3.2 Box 3.3
TABLES
Average real per capita growth rates. . . 2
Fourteen large states: key social and economic indicators... 2
Fiscal indicators: poor states and others (1999/2000)... ... 6
Average real growth rates of expenditures in some key sectors (14 major states) 9 Average real growth rates of expenditures in some key sectors (low-income states and others of the 14 major states)... 10
The paradigm transition at the state level... . . . 11
Ratio of average wages in the public and private sector, 1993/94 and 1999/00 17 Starting basic salary of primary school teacher... . . . 17
Enterprise restructuring by state... 27
Total redundancy compensation by state... 29
Average tenure of managing directors of Rural Women's Empowerment and Development Project (1998-200 1)... . . . .. 31
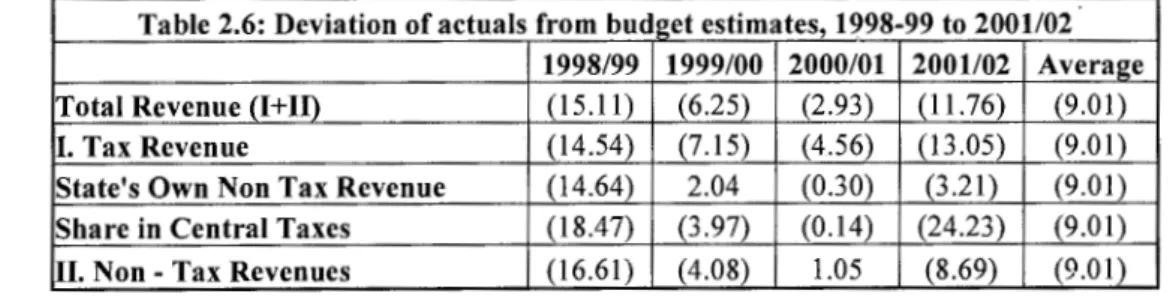
Deviation ofactuals from budget estimates, 1998-99 to 2001-02... ... 32
Institutions for effective departmental governance... 32
Structure of state's own tax revenue: 1985-86 to 2001-02... ... ... 36
Revenue from sales tax and transport taxes per vehicle versus road costs, 2000-01... .. . ... ... ... ... ... ... ... ... ... ... ... ... ... .. . ... ... ... ... ... ... ... ... ... 45
Per-capita transfers among India's states (average for 1995-2000)... 63
Fiscal indicators in the no-reform scenario... 77
Key revenue reform recommendations... 78
Key expenditure reform recommendations... 79
Fiscal indicators under three reform scenarios... 81
Fiscal indicators under three reform scenarios for the 5 low-income states... 82
BOXES
Was there really a fiscal crisis at the state level? ... . State government expenditures and poverty reduction ... . Fiscal responsibility legislation at the state-level in India: the story so far. ... . International experience with fiscal adjustment ... . Experience with para-teacher schemes in India ... . Tamil Nadu pension reforms ... . Attempts to increase the agricultural tariff: a history of repeated failure ... . Food subsidy reforms in Tamil Nadu ... . Public enterprise reforms in Andhra Pradesh ... . Mid-day meals: an example of productive, additional expenditure ... . Tax structures in major federations ... . Tax administration recommendations for Tamil Nadu's commercial
tax department ... . Haryana's VAT- going it alone ... .
4 8 11 15 18 22 24 27 28 33 35 39 40
Box 3.4 Box 3.5 Box 3.6 Box 3.7 Box 4.1 Box 4.2 Box 4.3 Box 4.4 Box 4.5 Box 4.6 Box 4.7 Box 4.8 Box 5.1
Figure 1.1 Figure 1.2 Figure 1.3 Figure 1.4 Figure 1.5 Figure 1.6 Figure 1.7 Figure 1.8
Figure 2.1 Figure 3.1 Figure 3.2 Figure 3.3 Figure 3.4 Figure 3.5 Figure 3.6
Figure 4.1 Figme 4.2 Figure 4.3 Figure 4.4 Figure 4.5 Figure 4.6 Figure 4.7
International experience with value-added taxes in a federation - lessons for India ... . State taxation of services: expert group versus advisory group ... . Five principles for improved cost recovery ... ..
Performance measurement in the commercial tax department, Andhra Pradesh ..
International perspective on India's fiscal federalism ... . Borrowing restrictions on sub-national governments: principles and practice ... ..
HIPC - what is it, and has it worked? ... . Econometric studies of the determinants and impact oflndia's fiscal federal Transfers ... . R TS approach to fiscal equalization ... ..
Design of conditional grants: international experience ... ..
Fiscal reform facility (FRF) ... . Problems in the financing of the state plan ... . Key assumptions and methodology underlying the no reform scenario ... .
FIGURES
41 42 46 48 53 58 60 66 68 69
70 74 76
State revenue receipts and expenditures. . . 3
State deficits and debt levels... 4
State fiscal deficit including power... . . 5
State fiscal deficit: poor states and others... 5
Own and total state revenues: poor states and others... 6
Salaries, pensions and interest payments for India's states as a percentage of GDP... . . .. 7
Aggregate expenditure trends for India's states as a percentage ofGDP... ... 7
Non-salary operating recurrent spending per rupee of salary spending (14 major states)... 10
Power sector losses (pre-subsidy) and budget subsidies to the power sector... 23
Trends in revenues as a percentage of GDP... .... 34
Share of central transfers in state total revenue... 34
Trends in states' own revenues as a percentage ofGDP... ... ... . ... ... ... ... 36
Trends in states' own revenues as a percentage ofGSDP, 2000-01... ... ... ... 37
Tax collection costs... 37
Real growth in sales taxes for the 14 major states: the impact of floor rate introduction(%)... 38
Borrowing sources for state governments... 54
Debt to revenue ratios for major states & Goi, 2001-02... ... ... 59
Central transfers to states, 1985-2000... .. 61
Trends in Gol revenues and transfers to states... 62
Per capita revenues normalized, 2000/01... 63
Transfers from Goi to the 5 large poorest states as a percentage of total transfers... 62
State revenues before and after transfers (formal and FCI)... 63
Figure 4.8 Figure 4.9 Figure 5.1
Actual vs. equalizing transfers for India's states ... . Resources other than own-revenue used by states to finance expenditure .... . All state debt-to-GDP ratio under three different fiscal targets ... .
67 72 80
CHAPTERl
THE STATE-LEVEL FISCAL CRISIS OF THE LATE NINETIES:
EVOLUTION AND IMPACT
I INTRODUCTION
1.1 India, home to one billion people, is a federation of 28 States and 7 Union Territories. The largest (Uttar Pradesh) is populous enough to be the fifth largest country in the world; the smallest (Sikkim) has a population of less than half a million. Among the 14 major states, the richest has a per-capita income that is five times that of the poorest state. Infant mortality ranges from a low of 14 per 1000 in Kerala, on par with east European countries, to 96 for Orissa, more typical of Sub-Saharan African nations. In an era of liberalization, a state's own policies and quality of government is increasingly critical for a state's development. Since the second half of the nineties, when the slow secular deterioration in fiscal performance of Indian states over the eighties and nineties was catalyzed into a crisis by the fifth pay commission awards, no area of state policy has been more important to development than its fiscal health.
1.2 The fiscal stress of the late nineties gave rise to an intense state-level reform effort. Six years on, this report documents the many initiatives undertaken by the states to restore fiscal sustainability, and become more effective agents of development. It outlines successes, lessons learnt, and highlights further challenges, on both the expenditure side (Chapter 2) and the revenue side (Chapter 3). It also looks at the incentive framework within which the states operate (Chapter 4), and asks whether there is a feasible reform package that will take the states not only out of fiscal crisis, but strengthened to meet the development challenges which confront them.
1.3 This chapter provides the context for what follows by outlining the role and increasingly divergent performance of the state governments (Section II), and then in turn, the genesis of the fiscal crisis (Section III), its developmental impact (Section IV), the reform response of the state and central governments (Section V), and the reform challenges facing the states today (Section VI).
II INDIA'S STATES
States in India play an increasingly important role in devising and implementing policies to reduce poverty, promote human development, and stimulate growth.
1.4 Under the Indian constitution, state governments are assigned significant responsibilities in sectors such as agriculture, industry, infrastructure, education, health, and social welfare. India's state governments are key financiers of a number of areas critical for enhancing growth and reducing poverty: in 2000/01, 57% oflndia's total government capital expenditure was financed by the states, as was 97 % of irrigation maintenance, 39% of road maintenance, 90% of public health expenditures, and 86% of public education expenditures. In fact, India's states are responsible for a higher proportion of general government spending than in any other developing country, except China. Moreover, the states' increasingly large fiscal deficits mean their fiscal policy is not only an important determinant of their own developmental performance but of India's overall macroeconomic and fiscal sustainability.
1.5 One of the striking features of Indian States prior to the 1990s was the relative uniformity of policies across states. The policy environment changed significantly after 1991 with the central government's liberalization of the trade and investment regime, and the growth of regional political parties. These developments allowed the states a larger role in determining their development paths and attracting investment.
The performance of India's states is increasingly divergent
1.6 Balanced regional growth has been an objective of India's development strategy since independence, and is supported by a system of redistributive transfers to the states. Of the 14 major states, the 5 poorest have
a per capita income of Rs 10,000 (in 1993/94 constant prices) or less: Bihar, Madhya Pradesh, Orissa, Rajasthan and Uttar Pradesh. These are classified throughout this report as the poor or low-income states.
They are home to over 40% of India's population, and nearly 50% oflndia' poor. These states are also slower growing than the other states (Table 1.1 ). In particular, following the liberalization of 1991, most of the middle and high income states were able to take greater advantage of the changes, because of better initial conditions, governance, infrastructure and human resources
than the poorer states. Moreover a number of the poorer states failed to improve their state-level policies to offset their initial disadvantage in attracting new investment. As a result, the average per capita income in the poor states relative to the others has decreased from 71% in 1980/81 to 54% in 1999/00.
Table 1.1: Average real per capita growth rates 1980/81-1989/90 1990/91-1999/00 Poor states
Other states
2.4 3.1
2.5 4.8
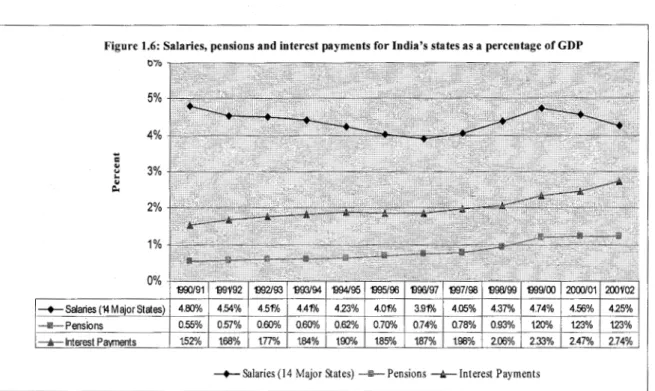
1. 7 The low-income states rank well below the other states on broader economic indices, such as on infrastructure, and investment dimate (Table 1.2). 1 They also have much worse social indicators than the other states, for example, infant mortality is almost twice as high. Although human development indicators improved in all states, progress on these broader indicators was also generally faster in the fast-growing states, except for literacy, where there was some catch-up. In some cases human development indicators actually worsened in the poor states. For instance, the number of underweight children increased over the nineties for all poor states, whereas it declined for the other states (except Kerala and Maharashtra). Unless the poor states improve their performance, it will become increasingly difficult to accelerate poverty reduction and development in India.
Table 1.2: Fourteen large states- Key social and economic indicators
Population Per capita Composite Investment Infrastructure Financial Literacy Female Under-weight Infant (in Millions) incomeb performance climate penetration sector strength rate0 literacy childrene mortality
(Rs) index" index" index" index" rated
Medium I 495 13471 2.4 2.4 2.5 2.7 75.8 66.7 41.9 47.0
High income states
Andhra Pradesh 76 10598 2.1 2.3 2.1 1.6 61.1 70.9 37.7 65.8
Gujarat 51 15768 2.5 2.4 2.3 2.2 70.0 58.6 45.1 62.6
Haryana 21 15304 2.3 2.5 2.0 1.7 68.6 56.3 34.6 56.8
Karnataka 53 12614 2.4 2.7 2.4 2.0 67.0 57.5 43.9 51.5
Kerala 32 11360 2.8 2.8 2.5 2.1 90.9 87.9 26.9 16.3
Maharashtra 96 17107 2.8 2.3 2.8 3.5 77.3 67.5 49.6 43.7
Punjab 24 16659 2.7 2.9 2.5 2.2 70.0 63.6 28.7 57.1
Tamil Nadu 62 13756 2.7 3.1 2.6 2.4 73.5 64.6 36.7 48.2
West Bengal 80 10226 1.7 1.2 2.0 2.0 69.2 60.2 48.7 48.7
Low income states 429 7211 1.1 1.4 1.0 0.9 58.8 44.3 52.7 83.2
Bihar 83 4846 0 0.4 - 0.3 47.5 33.6 54.4 72.9
Madhya Pradesh 81 9037 1.3 1.8 1.2 1.1 64.1 50.3 55.1 86.1
Orissa 37 6602 0.9 1.7 0.8 1.0 63.6 51.0 54.4 81.0
Rajasthan 56 9716 1.5 1.6 1.3 1.2 61.0 44.3 50.6 80.4
Uttar Pradesh 172 7149 1.2 1.4 1.0 0.9 57.4 43.0 51.7 86.7
Notes: a: ConfederatiOn of Indmn Industry (CII), 2002; b: 1999/00, m 1993/94 constant pnces; c: 2001, percent of population 7 years and older; d: 2001, percent of population; e: 1998/99, percent of children under 3 years of age; f:
1998/99, per 1000 live births. Sources: CII, 2002; 2001 Census, 1998/99 National Family and Health Survey.
1 A "composite performance" index (based on state performance in different categories, including investment climate, infrastructure penetration, finance, work force quality, social well-being, agricultural performance, and law and order) calculated by the Confederation of Indian Industries (CII, 2002) gives the poor states an average of 1.1 and the other states a score of 2.4. The index is strongly correlated with GSDP per capita, suggesting that focusing on GSDP per capita to capture regional variations in development and performance is reasonable.
Ill GENESIS
A slow secular deterioration in fiscal performance over the eighties and nineties was catalyzed into a state-level fiscal crisis by the Fifth Central Pay Commission pay awards in the late 1990s.
1.8 We use the term "fiscal crisis" not to be alarmist, or to suggest faltering macroeconomic performance but to convey the sharp deterioration in state-level fiscal performance witnessed in the late nineties - deficits rose, the state-level debt-stock, which had been declining, started rising rapidly, and off-budget liabilities also grew quickly.
(See Box 1.1 for a discussion as to whether or not there really was a fiscal crisis.) There was also a liquidity crunch, not on the economy, but on state-governments themselves, who started to find it much more difficult to pay bills, and even salaries. State governments themselves certainly perceived that they were facing a crisis. Many wrote White Papers, such as the Government of Tamil Nadu did in August 2001, to apprise legislators and the public "of the extent and causes of the serious financial crisis confronting the state". Finally, there is a close parallel with the balance of payments crisis of the early nineties, not in the nature of the crisis, but in its impact: just as the BoP crisis of 1991 gave rise to a decade of central government reforms push, so did the state-level fiscal crisis give an enormous impetus to reforms at the state level.
12.0%
115%
110%
"0.5%
"0.0%
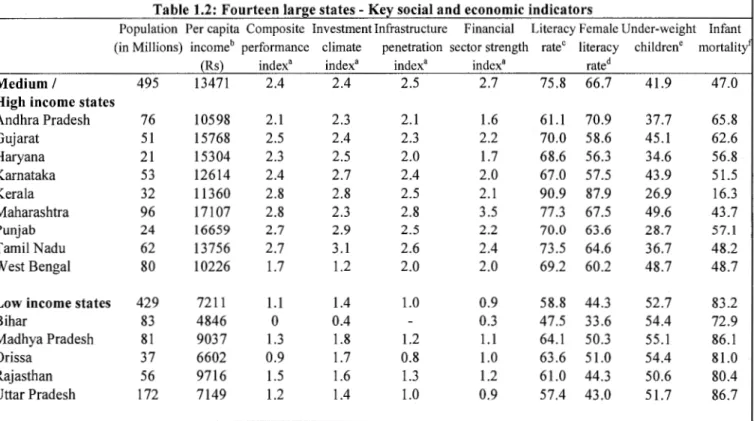
Figure 1.1: State revenue receipts and expenditures
<0 co 0 C\1 <t <0 co 0
co co Q) Q) Q) Q) Q) 0
I ...:. dl I I ..n ...:. dl
1.() c;; (V)
co co co Q) Q) Q) Q)
C\1 9 Ci
-+--Revenue receipts/GOP -1111--Revenue expenditure/GOP
1.9 The Fifth Pay Commission awards, phased in by the states starting in 1997-98, resulted in real wage increases of about 30%. Pensions, which had been growing slightly faster than the rate of GDP through the nineties started to grow much more rapidly in the late 1990s as the Commission ruling indexed pensions to real wages. Although the salary bill is now starting to fall again - relative to GDP - due to a hiring freeze, state governments continue to pay the price of the Fifth Pay Commission: the salary bill is about 1 percentage point of GDP higher than it would have been without the pay-rises, and the salary-intensity of expenditure is higher than it was in the mid-nineties, despite zero net hiring.
1.1 0 While the large pay awards were the immediate cause for the sharp fiscal deterioration, the secular worsening in the revenue (current) balance of the state governments can be traced back as far as the past two decades (Figure 1.1 ), and is related to the growth of populist policies, symbolized by rapid growth in public employment, and the introduction in many states of free power to farmers in the eighties. The growing revenue deficit was prevented from translating into a higher fiscal deficit until the second half of the nineties only because capital expenditures were compressed. On the expenditure side, the interest burden grew over the nineties initially due to a hardening of interest rates as the old regime of financial repression and subsidized rates for government borrowing was brought to an end in the nineties, and subsequently due to a rising debt-stock. By contrast, revenues fell over the nineties. The state-level revenue/GDP ratio fell from around 12% in the late eighties and early nineties to 10% in 1998/99. Both own-revenues and Goi transfers fell, though the latter more so, as its share in total revenue declined from slightly above 40% up to 1993/94 to 36% in the late nineties.
Box 1.1: Was there really a fiscal crisis at the state level?
Does what is described in this report amount to a "fiscal crisis" or is this sensationalism?
There was clearly no macro crisis (hyper inflation, or a foreign exchange shortage), but there was a fiscal crisis. There are three reasons we call what happened a fiscal crisis.
o First, the sharp deterioration in fiscal indicators, as indicated in Figure 1.2, which, as we note below, would look worse if off-budget liabilities were included, and reversed a mild fiscal improvement.
o Second, the liquidity shock, as state governments struggled to pay the salary increases they had agreed to. State governments, with limited borrowing sources, experienced severe liquidity problems in the late nineties. The Reserve Bank of India runs an emergency overdraft facility for state governments. In 1997/98, the average number of days in overdraft for a state was 32. This rose to 88 in 2000/01 and 117 in 2001/02. There were numerous reports in the late-90s of state governments "closing the treasuries" since they no longer had the cash to pay bills. State-government distress is also evident from their borrowing from their employees through the impounding of salary increases to the provident fund. Borrowing from the provident fund tripled in nominal terms between 1997/98 and 1999/00 (reaching 0.9% of GDP). Basically, state governments lacked the cash to pass on the promised increase to workers, and were only able to do so by promising part of the increase (with interest) when the employees retired. There were also several reported cases in which the Government of India provided states with medium- term loans basically as a bail out. Finally, one can also note a sharp accumulation of arrears. Para. 1.14 discusses the case of the power sector. Comprehensive data on arrears on salaries and other bills is not available. The Government of Tamil Nadu claims that, as of 2002, it faced unpaid bills of Rs 3,100 crore (2% of the states domestic product), including salary/pension arrears ofRs 1, 800 crore. (Government of Tamil Nadu, 2003).
o Third, the sense of crisis. The influential india Today in its February 14, 2000 issue titled its cover story: "States Going Broke: Bankruptcy Stalking a Collapse of Public Services".
And it was not just a sensationalizing media. State governments used this language as well: see para. 1.8 and Box 4.8 for examples.
o Fourth, the impact of the crisis. just as the BoP crisis of 1991 gave rise to a decade of central government reforms push, so did the state-level fiscal crisis give an enormous impetus to reforms at the state level.
It is true that certain cyclical factors operated to make 1998/99, the worst year of the crisis a particularly bad year, with low revenue from both states' own sources and from the Gol. But the crisis can by no means be explained simply as a cyclical phenomenon. In 1998/99, state governments borrowed 68 percent more than they had the previous year. Since then, borrowing has not decreased, and the debt stock has continued to rise.
Deficits and debt levels rose sharply in the late-nineties.
1.11 The sharp increase in expenditures in the latter half of the nineties alongside declining revenues could only be supported by greater borrowing by state governments. The aggregate fiscal deficit of the states jumped from 2.9% of GDP in 1997/98 to 4.3%
in 1998/99, and has remained above 4% of GDP since (Figure 1.2). At least half of the fiscal deficit is accounted for by the
30 25
20
10 5
Figure 1.2: State deficits and debt levels
5.0 4.5 4.0 3.5 3.0 ~ 2.5 i;
""'
2.0 1.5 1.0 0.5 0 +""-+""-+""4-"'4-"'4"'4"'4"'"+""+""+""-+""-+""-+""'-+'"'-+'IIJ4J!lil..j.JmEJ- 0. 0
- D e b t / G D P --+--Fiscal deficit/GOP
revenue deficit, implying that at least half of states' borrowing is to finance current expenditure.
1.12 Despite Government of India (Goi) control over state government borrowings being enshrined in the constitution, state governments were able to increase their borrowing in the late nineties by largely drawing on sources over which Goi exercises no active control: there was a boom in "small savings" loans, a relatively expensive form of debt with high administratively-determined interest rates; and state governments borrowed from their own employees by impounding promised salary increases into their provident funds.2 States also used non-debt sources of deficit financing, such as cash balances and public account borrowing (para. 4.5).
1.13 As a result, the state-level debt stock which was actually falling in the first half of the nineties reversed its downward course in 1997/98 and has been rising every since (Figure 1.2). A 10 percentage point increase in the ratio of debt to GDP over a span of six years poses a serious threat to debt sustainability. The severity of the situation can also be seen from the fact that almost one quarter of revenues were pre-empted by interest payments in 2001/02.
Off-budget liabilities also increased rapidly.
1.14 The most significant off-budget liability is in the power sector. Over the course of the nineties, cash-strapped governments were unable to meet their rapidly rising subsidy obligations to their electricity companies. Thus an increasing proportion of power sector losses, which reached over 1.4% of GDP by 2000/01, were met off budget, in large part through arrears to central utilities. If the full amount of the loss, or subsidy obligation, were included, the fiscal deficits of the states would rise by an
Figure 1.3: State fiscal deficit including power
6
. 0
92/93 93/94 94/95 95/96 96/97 97/98 98/99 99/00 00/0 I 01/02
average of 30% and the combined states' fiscal deficit Source: Planning Commission (2002)
would increase even more sharply over the crisis period by
lscal deficit
an additional 1.0-1.5 percentage points of GDP (see Figure 1.3).
1.15 State-government guarantees have also risen sharply since 1996, and their quality has declined because an increasing proportion of government guarantees go to back borrowing by government-owned special purpose vehicles whose debt servicing will revert entirely to the budget. Such liabilities, albeit off budget, are thus in the nature of actual rather than contingent state government
liabilities. In 2000, outstanding guarantees of state governments were estimated at Rs 1661 billion, equivalent to 7.2% of GDP, up from Rs 526 billion in 1996 (equivalent to 4.4% of GDP).
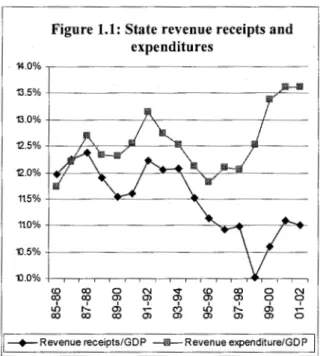
1lhe poorer states saw the most severe fiscal deterioration.
1.16 The degree of fiscal deterioration has been worse in the poorer states (Figure 1.4). They are more reliant on central transfers (in poor states central transfers account for about half of all revenues, versus about a quarter in the other states), and so they have suffered more from the reduction in these transfers.
They have also experienced greater variability in
Figure 1.4: State fiscal deficit: poor states and
~ 5.0%
"
... ~ 4.0%
= "
~ 3.0%
=-
2.0%
1.0%
0 N (") .... LO CD ... co en 0
~ en ~ en ~ en ~ en ~ en e
en 0 c;; N (") ~ LO co ... co en
co en en en en en en en en en en ~ ~ ~ en ~ ~ ~ ~ ~ ~
~ ~
0
0 0 0 N
2 In 1998/99, state governments as a whole borrowed 68% more than they had the previous year. During that year, borrowings from 'small savings' (i.e., from post office and other savings' schemes for individuals) rose by 53%, provident fund borrowing by 92%, and Go! controlled borrowing by 18%.
revenues, including in their own revenues. (Figure 1.5 and Table 1.3).3
1.17 On the expenditure side, with higher initial debt stocks and salary bills (relative to total spending), poorer states also suffered more from the shocks of the nineties. As a result, some of the fiscal indicators have experienced greater deterioration in poorer than in richer states, and have reached alarming levels in the poor states. In 1999/00 the debt to GSDP ratio was over 32.5% in poor states, versus 22.6% in other states. Interest payments as a share of own revenues are nearly twice as high in poor states than in other states, and are still increasing. In Bihar and Orissa, debt service preempts more than 90% of own revenues.
Figure 1.5: Own and total state revenues: poor states and others
18%
16%
10. 14%
§ 12%
'8 10%
~ = 8%
"
" 6%
.. "
10. 4%
2%
0%
0 ~
"'
ro ~
~ C\1
"' "<I'
~ ~ 0 Oi ~ C\1 "' ?;
"' "' "'
~ "' ~ ~ ~
c:::::::J Own Revenues (Poor States) - T o t a l Revenues (Poor States)
IV IMPACT
"' "' ~
"'
~
CD f"-.. CO 0') 0
~ ~ ~ ~ a3 §
m m en m m o m m m m m o ~ ~
C\1
c:::::::J Own Revenues (Other States) -+--Total Revenues (Other States)
Table 1.3: Fiscal indicators: poor states and others Interest Go I revenu Fiscal Revenue payment Debt/
transfers es deficit/ Deficit I s I own GSDP /GSDP /GSDP GSDP GSDP revenues Poor states 6.1 7.0 6.3 4.1 46.5 32.5 Other
states 2.9 8.8 5.5 3.3 29.4 22.6
Although associated with an increase in public spending, the fiscal crisis weakened the developmental and poverty impact of state governments, especially in the poorer states; it also called into question India's overall fiscal sustainability.
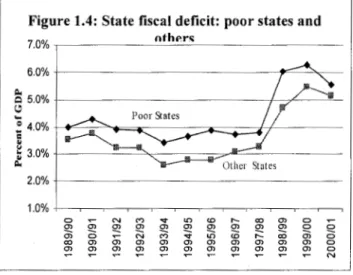
1.18 Various studies have showed the importance of both the quantity and quality of state government expenditures for poverty reduction in India, and drawn attention to their low levels, especially in the poorer states (Box 1.2). Although the fiscal stance was expansionary in the late nineties, the impact on expenditure quantity and quality was largely negative. This is because all of the increase is accounted for by the rise m interest, pensions, and the average salary.
1.19 Figure 1.6 shows trends in these three variables at the state level over the nineties. The salary bill as a whole has started to adjust, but this reflects the lack of net hiring in the late nineties, which has compensated for the large average wage increases. Once one adjusts for the large increases in interest and pension payments, and for the large real salary increase in the second half of the nineties, "adjusted" aggregate expenditure has continued the downward trend observed through the first half of the nineties (Figure 1. 7).
3 This is related to the recommendations of the Tenth and Eleventh Finance Commissions. Revenue deficit grants to the poorer states, recommended by the Tenth Finance Commission, came to an end in 1997/98. Similar grants were resumed in 2000/01, on the recommendation of the next Finance Commission. As a consequence, transfers to the poor states reached a low of 5.4% of GSDP in 1998/99 and then increased to 8.5% by 2000/01 -for the other states central transfers as a share of GSDP have been roughly constant since the mid-1980s.
Figure 1.6: Salaries, pensions and interest payments for India's states as a percentage of GDP
0~ ~~~~--c-~----~~~--~~-r~~~~~~~~~~~~,--~~~~---
= ~ 3% +--'~~---.e-~~~-~~~--~----~~~~--~~~---~~~"~~~=~~~--~~
~ ..
0%
-+-Salaries (14 Major States) -mi!-Pensions
---$-Interest Pavments
'!l90/91 4.80%
0.55%
1.52%
199'1'92 1992/93 1993194 1994/95 1995/96 1996/97 1997/98 1998/99 1999/00 2000/01 200'1'02 4.54% 4.51'/o 4.41'/o 4.23% 4.01'/o 3.91'/o 4.05% 4.37% 4.74% 4.56% 425%
0.57% 0.80% 0.60% 0.62% 0.70% 0.74% 0.78% 0.93% 120% 1.23% 123%
168% 1.77% 184% 190% 1.85% 187% 1.98% 2.06% 2.33% 2.47% 2.74%
--+-Salaries (14 Major States)- Pensions ---$-Interest Payments
Notes and source: Salary data has been provided by N.J Kurian and is only for the 14 major states. Other data is for all states. 2001102 data are actuals for interest payments, but revised estimates for the other variables.
Figure 1.7: Aggregate expenditure trends for India's states as a percentage of GDP 16.0
15.0 14.0
-= ... .. ... <.J 13.0
12.0
l:l.
11.0 10.0 9.0
N C')
~ 0)
o; N 0)
-+-Total expenditure Potentially productive expenditure, adjusted for real salary increases
Notes: See Table 1.4
Box 1.2. State government expenditures and poverty reduction
In the aggregate, state government development expenditures appear to have been growth promoting and poverty reducing. Using state-level poverty measures spanning 1960 to 1994, and controlling for other factors such as agricultural and non-farm productivity growth, Ravallion and Datt (2002) find that poverty declined more in states that had higher development expenditure. Linking individual items of expenditure to poverty reduction and growth provides some tentative evidence of which types of government expenditures matter the most. There is evidence that infrastructure spending by the government crowds in private investment (Gulati and Bathala, 2002; RBI, 2002) and that spending on infrastructure can be particularly effective in alleviating rural poverty (Fan et a!., 2000). The connection between public spending and health outcomes is more complex and econometric investigations have drawn conflicting results. Kingdon (1996) and Filmer and Pritchett (1999) both demonstrate the importance of quality, in their case that education outcomes appear to be much more responsive to non-salary inputs than salaries.
Quality of expenditure by state governments is undermined by various problems, including: skewed composition of spending skewed towards salaries even though outcomes appear to be much more responsive to non-salary inputs (Kingdon, 1996; Filmer and Pritchett, 1999), a regressive distribution of benefits, especially in health (World Bank, 1998; Mahal et.al., 2001); low civil-service productivity, as evidenced, for example, by very high absence levels of service providers (Devarajan and Shah, 2004); an ineffective spread of funds over too many projects; and duplication of services provided by the private sector.
Quantity is also low in key areas. Public and private investment in infrastructure is about 4% of GDP which is low compared to levels of about 5% of GDP invested in infrastructure up to the mid-nineties, and 6-8% in the East Asian countries (Mody, 1997), to whose rapid growth rates India aspires. Infrastructure maintenance is also very low, despite very high returns (World Bank, 2004b). Education and health funding is inadequate: a study of public primary schools points to large, overcrowded classrooms (with an average pupil-teacher ratio of 50, but higher than 150 in some cases), inadequate infrastructure (84% of schools lacked a toilet, 54% lacked drinking water), and a lack of teaching aids (PROBE, 1999). Rural health centers are often dilapidated, and lacking in basic facilities, such as electricity, drugs and basic medical equipment, making them dysfunctional and disused (Dreze, 2004). India's level of public expenditure on health, at about 1% of GDP, is among the lowest in the world, even in South Asia.
(Combined private and public expenditure is much higher, but much of the private expenditure on health is also of low quality.)
Finally, both quantity and quality of expenditure are particularly low in the poorer states. The greater salary intensity of expenditure is demonstrated in Section IV ofthis chapter. Using 2000/01 data, on an average per capita basis, low income states spend only 57% as much as middle- and high-income states on health and education, 54% as much on capital expenditure, 64% on roads maintenance, and 42% on irrigation maintenance. The differences between individual states can be even more striking. There are five states which spend at least twice as much on health per capita as the two lowest spending states, Bihar and Madhya Pradesh (MP). Nine states spend two times or more on education per capita than MP and Bihar: the two lowest spending states; Punjab and Maharashtra's spending is more than three times. Differences in public expenditures across states are reflected in much lower access to public services in the poorer states. Even more striking is the finding that the poor in the richest six states have better access to basic services than even the non-poor in the bottom five states (Paul et. a!., 2004). Jean Dreze (2004) illustrates this difference by a comparison between the health centres of Tamil Nadu and the (poorer) northern states:
Last year, I .. visited health centres in three districts of Tamil Nadu. They were clean, lively and well staffed.
Plenty of medicines were available for free, and there were regular inspections. The walls were plastered with charts and posters giving details of the daily routine, available facilities, progress of various programmes, and related information. Patients streamed in and out, evidently at ease with the system. It was a joy to see this, in contrast with the bare, deserted, gloomy, hostile premises that pass for health centres in north India.
To summarize, the messages that emerge the most clearly from the large, and sometimes conflicting, literature on this subject are that both the quantity and the quality of certain types of state government expenditures matter for poverty reduction, and that both are on average low, especially in the poorer states.
1.20 The fiscal crisis also weakened the developmental and poverty impact of state governments by slowing down real growth of expenditure in education and halting real growth in health expenditure. At first glance, health and education spending appear to have done very well in the last years from 1996/97 to 2000/01 with average real increases of 9.6% and 5.9%, compared to 3.1% and 2.5% in the six years leading up to 1996/97 (Table 1.4). However, deflation simply by price indices ignores the impact ofthe Fifth Central Pay Commission real wage increases in these labor-intensive sectors. Factoring in wage increases alters the picture dramatically.
Now education shows an average real spending increase of only 1.6% in the five years post 1996/97, and health of -0. 7%, both significantly less than the pre-1996/97 rates of growth.
Education Health
Irrigation maintenance Roads maintenance Capital expenditure
3.1%
2.5%
4.8%
0.9%
0.5%
Adjusting for price increases only
9.6%
5.9%
2.4%
3.5%
5.9%
Adjusting for price and wage increases.
1.6%
-0.7%
Notes: To avoid downward bias of growth rates, we add expenditure levels in the three new states back into the old states from which they were created in 1999/00. Jharkhand however has not been included in the analysis as there is no data available on it for 2000/01 This causes downward bias in the second period. If we take out Bihar, however, the slow-down in the second period is even greater.
Maharashtra is excluded from the maintenance calculations since the data appears unreliable. We assume that the ratio of salary to total current spending in education is 90% and in health 75%. We calculate wage inflation using data from Figure 1.6 on the assumption that there was no net hiring post 1996-97 and that any excess in the increase of the wage bill over the rate of inflation is due to increases in real wages. 1996-97 is the dividing year, since implementation of the Fifth Central Pay Commission wage hikes began in 1997-98.
1.21 The only positive fiscal development in the post-1996/97 period is an increase in real growth in state- level capital expenditure. Capital investment by state governments was virtually flat in real terms in the first half of the nineties, but resumed growth in the second half of the nineties with an annual average real growth rate of 5.9%. This contrast between the two halves of the nineties may be ovt:rdrawn. Capital expenditure is lumpy and volatile, and the dividing year 1996/97 was an unusually low year for capital expenditure figures.4 There is also evidence that in 1998/99 and 1999/00, recorded expenditure on capital payments was inflated. 5 At the same time, however, the growth in guarantees probably also allowed increased capital spending by government enterprises. While the news about capital spending is good, in terms of volume of expenditure, capital expenditure is only about 10% of total expenditure, and slightly less, on average, than education expenditure, for example. Maintenance spending shows a mixed picture: average roads maintenance growth increased from 0.9%
to 3.5%, while average irrigation maintenance growth fell from 4.8% to 2.4%.
1.22 The poorer states in particular suffered. The poor states show negative real spending growth post-crisis in health, education, and irrigation maintenance, and much lower expenditure growth rates for the other two categories of capital investment and road maintenance spending (Table 1.5).
4 State capital expenditure as a ratio ofGDP was 2.0%-2.1% ofGDP for 1991/92 to 1996/96 but fell to 1.6% in 1996/97. From 1997/98 to 2001/02 the ratio was in the range of 1.6%-1.8% ofGDP.
5 Public account borrowing increased rapidly, from 0.3-0.5% of GDP pre-1998/99 to 1.0% of GDP in 1998/99 and 0.8% in 1999/00.
This mechanism is often used at a time of fiscal stress to prevent the need to show deep cuts in areas such as capital expenditure (see para 4.4). This suggests that the official capital expenditure figures exaggerate growth in capital expenditure at least in the worst years of the fiscal crisis, 1998/99 and 1999/00.
Table 1.5: Average real growth rates of expenditures in some key sectors (Low-income states and others of the 14 major states)
Low Income States Other States
1990/91- 1996/97 1996/97- 2000/01 1990/91- 1996/97 1996/97- 2000/01 Education
Health
Irrigation maintenance Roads maintenance
1.23 Quality of
spending also suffered, as expenditures became much more salary- intensive, particularly in the poorer states (Figure 1.8). In 1990/91, rich and poor states alike spent about Rs. 0.9-1 on non- salary operating recurrent expenditure for every
rupee of salary
expenditure. By 2000/01, this ratio for the better off states at 1.11, was marginally better than at the start of the nineties, but for the poor states it
2.8% -0.2% 3.3% 2.6%
2.2% -2.6% 2.8% 0.3%
2.6% -2.0% 6.0% 4.5%
1.5% 1.0% 0.4% 5.0%
-4.4% 2.9% 3.8% 7.6%
Figure 1.8: Non-salary operating recurrent spending per rupee of salary spending (14 major states) 1.4
1.3 1.2 1.1
~ ~ 1.0
!:=: = 0.9 0.8 0.7
- - Low Income States __,._Others States
0 0
0
~
had fallen precipitously to 0. 73, a roughly 20% fall from the early nineties. Given that there was virtually no hiring in the second half of the nineties, it is ironic that all states, but especially the poorer ones, should, nevertheless, at the end of the nineties, have at their disposal significantly fewer non-salary resources relative to their salary bill than they had midway through the nineties. There are indeed many anecdotal accounts from the late nineties of teachers without chalk, and doctors without drugs (Saxena, 1999).
1.24 The deterioration in state finances also significantly weakened India's overall macroeconomic performance, which, with the exception of the burgeoning fiscal deficit was strong in the nineties. Almost half ofthe consolidated fiscal deficit is now made up of the state-level deficits.
V Response
The sharp fiscal deterioration gave rise to an intense state-level reform effort.
1.25 The sense that "business-as-usual" was not an option gave enormous momentum to reform efforts at the state level. Many states have now adopted reform programs, albeit to differing degrees of strength and credibility, to return deficits to sustainable levels, and more broadly to improve government efficiency and effectiveness.
1.26 These reform programs go way beyond the realm of fiscal space, and have objectives far more ambitious than fiscal correction. Although, to keep it manageable, the scope of the study is restricted to fiscal reforms, this is not because sectoral reforms are seen as less important. Indeed, even fiscal adjustment confronts serious sectoral issues, and we do try to grapple with some of these in subsequent chapters. One key set of