Reconstruct Past Climate
Data Source, Proxies
Thomas Kuster
http://fam-kuster.ch
Large-scale climate variability, 13.11.2006
1 Parameter and Resolution
The follow-up weather parameters normaly could reconstruct:
temperature
precipitation
wind
The Resolution depends on the data source.
2 Data Source
Descriptive documentary data such as:
reports from chronicles
daily weather reports
travel diaries
ship logbooks
Documentary proxy data are more indirect evidence that reflects weather or climate conditions.
2.1 Speleothem
Speleothems are secondary cave deposits such as stalactites and stalagmites (Stalagmites grow from the ground, stalactites grow from the ceiling).
2.1.1 Development of Speleothems
CaCO
3+ H
2O + CO
2= ⇒ Ca
+2+ 2 HCO
−3Ca
+2+ 2 HCO
−3= ⇒ CaCO
3+ H
2O + CO
21
Reconstruct Past Climate Data Source, Proxies 2
2.1.2 Age
Thorium-Uran method
2.1.3 Precipitation
The δ
18O depends on the precipitation. The δ
18O is more negativ in periods with more precipitation.
and 9.6 ky B.P. indicate a rapid northward mi- gration of the ITCZ and are in agreement with Arabian Sea upwelling records (
4, 5) and re-gional lake level (
3), ice core (14), and spe- leothem records (6,
12). Although some records(4,
5) indicate an initial increase in IOM strengthbetween 13 and 12.5 ky B.P., there is no spe- leothem evidence in Oman for a monsoon in- tensification before
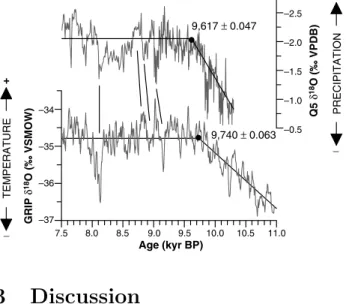
⬃10.3 ky B.P. (6,12). Thecomparison between the Q5 and GRIP
␦18O records (15) clearly reveals that the abrupt in- crease in monsoon precipitation is in phase with increasing air temperature in the northern Atlan- tic region (Fig. 2). When age uncertainties of
⫾
1 to 2% of the absolute age in both the Q5 and GRIP records are taken into account, decadal- scale intervals of reduced monsoon precipitation (more positive
␦18O values) correlate with cool- ing events in Greenland and vice versa, as best expressed at 9.1 and 8.2 ky B.P. (
15,16) (Fig.
2). Although precise estimation of leads and lags is hampered by age uncertainties, the marked similarity between both records indicates that early Holocene IOM intensity was controlled on centennial and even on decadal time scales by glacial boundary forcing (e.g., Himalayan snow cover and North Atlantic sea surface tempera- tures). Such a strong teleconnection between low-latitude IOM variability and high-latitude temperature fluctuations during the late Pleisto- cene and last deglaciation is well known and was previously detected in marine cores from the Arabian Sea (4,
5,17–19), but not in suchdetail for an early Holocene monsoon record.
After
⬃8 ky B.P., the gradual long-term de-crease in monsoon precipitation (as inferred by the shift toward modern
␦18O values) indicates a continuous southward migration of the mean summer ITCZ and a gradual weakening of mon- soon intensity in response to declining June to August summer insolation at 30°N (20,
21) (Fig.3A). A decrease in summer insolation reduced the land/sea thermal contrast and, therefore, the northward pull on the ITCZ and the monsoonal rainfall belt into the Arabian Peninsula. Support- ing evidence for a gradual middle to late Holo- cene weakening in IOM wind strength and in- tensity is indicated by a decrease in abundance of
Globigerina bulloidesin an upwelling record from the Arabian Sea (Fig. 3B) (19). Additional evidence for an insolation-controlled gradual southward migration of the ITCZ during the Holocene has also been found for tropical South America (22) (10°43 N; 65°10 W), where de- creasing Ti content indicates a long-term decline in summer precipitation (Fig. 3C). Taken togeth- er, these lines of evidence suggest that postgla- cial to modern precipitation patterns in the north- ern tropics are controlled, probably on a global scale, by the gradual southward migration of the ITCZ and gradual weakening of the mon- soons in response to orbitally induced decreas- ing summer insolation.
Although in southern Oman monsoon pre- cipitation continuously decreases from
⬃8 ky
B.P. to the present, lake records in the African and Indian monsoon domain (1–3,
23) and amarine dust record off West Africa (24 ) rather suggest that monsoon precipitation decreased abruptly between 6 and 5 ky B.P. (Fig. 3D).
How can we explain this apparent mismatch?
First, both fully coupled (ocean-atmosphere- vegetation) climate model simulations (25) and geological data (3,
24) suggest that this abrupt humid-arid transition in northern Africa can be best explained by a threshold response (negative vegetation-atmosphere feedback) of the African monsoon to orbitally induced summer insola- tion. Second, lake levels in Indian monsoon domain may show a nonlinear response to pre- cipitation changes. A shorter monsoon season and/or high-amplitude fluctuations in monsoon precipitation can quickly induce a negative pre- cipitation-minus-evaporation balance, leading to rapid desiccation of the lake and, thus, terminat- ing the record. Furthermore, lakes dry out as soon as the summer monsoonal rainfall belt retreats south of their drainage basin. We sug- gest that the Q5 record is, by virtue of its nature and geographical position, more suitable to record the gradual middle to late Holocene de- crease in IOM intensity and precipitation. The Q5 record reveals an almost linear response of the IOM to orbitally induced variations in sum- mer insolation after
⬃8 ky and, thus, confirms results of previously published climate model simulations (26 ).
Although during the early Holocene decadal to multidecadal changes in monsoon precipita- tion coincide with temperature fluctuations in the North Atlantic (Fig. 2), short-term fluctua- tions in IOM precipitation also occurred after 8 ky B.P. To examine the nature of these varia- tions, we removed the long-term trend in the isotopic record by removing a sinusoidal fit to the later part (Fig. 1). We then compared the Q5 record to the tree-ring
⌬14C record (27 ). The Q5 record was tuned—within the Th-U age uncer- tainties—to the
⌬14C time scale [see (6) and fig.
S4 for details]. The fine-tuned Q5
␦18O isotopic record shows a strong similarity to the detrended
⌬14
C residuals (
14C
res) record (27 ), which large- ly reflects variations in solar activity (Fig. 4) (28,
29). In the fine-tuned Q5 record, intervalsof weak (strong) solar activity correlate with periods of low (high) monsoon precipitation (Fig. 4). However, the visible correlation be- comes less clear in the late Holocene when the
⌬14
C
resrecord shows only small amplitude vari- ations in solar activity. Results of spectral anal- ysis of both the detrended raw data and fine- tuned data further reinforce our interpretation that second-order variations in IOM precipitation were triggered by changes in solar activity, as indicated by statistically significant major solar cycles (within the 6-dB bandwidth) centered at
⬃
220,
⬃140,
⬃107, 11, and 10 years for the untuned and
⬃240,
⬃140,
⬃90,
⬃18, and
⬃11 years for the fine-tuned
␦18O paleoprecipitation
Fig. 1.Q5
␦18O record
from southern Oman.
Black dots with horizontal error bars are TIMS and MC-ICPMS Th-U ages (see tables S1 and S2). Black dot with vertical error bars and gray shaded area show the
␦18O range of modern stalagmites (101 stable-isotope measure- ments during the past 50 years). Heavy gray line shows the long-term trend as defined by RAMPFIT
(34) for the early Holocene and a sinusoidal in the late part.
Fig. 2.
Comparison of the Q5
␦18
O record with the smoothed (five-point running average) GRIP
␦18