Research Collection
Journal Article
Measuring the heat transfer coefficient (HTC) in buildings: A stakeholder's survey
Author(s):
Deb, Chirag; Gelder, V.L.; Spiekman, Marleen; Pandraud, Guillaume; Jack, Richard; Fitton, Richard Publication Date:
2021-07
Permanent Link:
https://doi.org/10.3929/ethz-b-000476938
Originally published in:
Renewable and Sustainable Energy Reviews 144, http://doi.org/10.1016/j.rser.2021.111008
Rights / License:
Creative Commons Attribution-NonCommercial-NoDerivatives 4.0 International
This page was generated automatically upon download from the ETH Zurich Research Collection. For more
information please consult the Terms of use.
Renewable and Sustainable Energy Reviews 144 (2021) 111008
Available online 25 March 2021
1364-0321/© 2021 The Authors. Published by Elsevier Ltd. This is an open access article under the CC BY-NC-ND license
(http://creativecommons.org/licenses/by-nc-nd/4.0/).
Measuring the heat transfer coefficient (HTC) in buildings: A stakeholder ’ s survey
C. Deb
a,*, L.V. Gelder
b, M. Spiekman
c, Guillaume Pandraud
d, R. Jack
e, R. Fitton
faInstitute of Technology in Architecture, ETH Zurich, Zurich, Switzerland
bBuilding Performances, Belgian Construction Certification Association (BCCA), Brussels, Belgium
cTNO, Department of Building Physics and Systems, Delft, the Netherlands
dSaint-Gobain Research Compi`egne, Thourotte, France
eRichard Jack: Build Test Solutions, Lutterworth, UK
fSchool of Science Engineering and Environment, University of Salford, Manchester, UK
A R T I C L E I N F O Keywords:
Building energy performance On-site measurements Survey
Heat transfer coefficient (HTC) Building industry
Performance gap
A B S T R A C T
The heat transfer coefficient (HTC) is a very important factor influencing the energy performance of a building.
Recent studies have shown the importance of on-site measurements of the HTC in reducing the performance gap in buildings. However, its measurement setup and calculation procedures are known to be intense and complex.
Due to this, many stakeholders in the building industry find it impractical and insufficient for their needs. This paper presents the results of an international survey that targets such stakeholders with the aim to get their perspectives on HTC measurements on-site. Several stakeholders from 14 countries in Europe participated in the survey. The survey is categorized into four parts: a) basic data about the participants, b) their interest in methods for measured energy performance, c) their views on the characteristics of such a methodology and d) their concerns and opportunities. The results reveal that the stakeholders are highly interested in measuring the HTC on-site. The results also provide interesting insights on the aspects relevant for them and their customers. In particular, we elaborate on their perspective on the time to conduct the measurement, the cost of the setup, the measurement duration and the acceptable error. The assimilated understanding from the survey will help the building and the construction industry to identify opportunities for a progressive assessment campaign involving on-site measurements. This study is part of the International Energy Agency’s Energy in Buildings and Com- munities Programme (IEA EBC) Annex-71 project titled ‘Building energy performance assessment based on optimized in-situ measurements’.
1. Introduction
1.1. Building energy performance assessment methods
The building stock in the European Union consumes 40% of the final energy consumption and is responsible for 36% of all the CO2 emissions [1]. In view of this, the 2015 Paris Agreement on climate change re- quires consistent attention towards low greenhouse gas emissions and climate-resilient development [2]. This pathway entails focusing on new sustainable developments while upgrading the old building stock. An important aspect in facilitating sustainable and energy-efficient build- ings is to develop accurate thermal models of them. The thermal models provide a platform to assess the current performance of buildings while also enabling to test retrofit options. The conventional processs of model
development relies on simulation engines which are based on thermo- dynamic laws [3,4]. Many such modelling mehods have been imple- mented in evaluating the energy performance of buildings as well as for retrofit analysis [5–7]. A way to improve the model accuracy is to use measured data for calibrating the thermal models [8]. The recent ad- vances in sensor technology has enhanced on-site measurements of relevant building-related data for model calibration and performance assessment [9,10]. These measurements provide accurate, near real-time information of building variables and operating conditions.
Recent research has witnessed a significant development in modelling methods using on-site measured data [10,11]. Another recent develop- ment has been the increased need for better forecasting of the actual building performance. Stakeholders in the building industry are looking for ways to accelerate the energy transition by issuing performance guarantees to persuade buyers, tenants and building owners to buy
* Corresponding author.
E-mail address: deb@arch.ethz.ch (C. Deb).
Contents lists available at ScienceDirect
Renewable and Sustainable Energy Reviews
journal homepage: http://www.elsevier.com/locate/rser
https://doi.org/10.1016/j.rser.2021.111008
Received 26 April 2020; Received in revised form 31 December 2020; Accepted 19 March 2021
highly energy efficient homes or participate in deep renovation projects.
Issuing a guarantee for up to 25 years places high demands on the reliability of the method. An important aspect influencing the perfor- mance of a building is its Heat Transfer Coefficient (HTC). The HTC of a building is defined as the “heat flow rate divided by temperature dif- ference between two environments” as in ISO13789 [12]. This docu- ment fundamentally deals with the modeled value of the HTC, encompassing all mechanisms of heat loss in a building. The HTC value is required in all of the EPBD modelling mechanisms across the EU states in one way or another where it is used to denote the energy efficiency of a building and/or used to calculate predicted annual energy consump- tion. With this metric in place, many researchers and members of the industry carry out experiments to examine completed buildings and compare the modeled values to the actual values. Measurements carried out in this area have frequently found a gap between the modeled value of the HTC and the measured value which is colloquially known as the performance gap [13,14]. These gaps are generally found to be negative (the “real world” figure gives a poorer performance than the model). For example, gaps of more than 100% have been found in studies on new homes in the UK.
1.2. Research objectives
Whilst guidance for on site HTC measurement exists, this is still a niche topic area, carried out more in academic and industrial research and development far more than part of the construction process. As such there is only a limited number of individuals who have the knowledge to set up such tests and to correctly interpret the raw data and analyse this to an accurate HTC figure. This shows that many stakeholders deem current measurement methods and assessment approaches too costly, impractical and insufficient for their needs [15]. Therefore, the objec- tive of the current survey is to understand the stakeholder’s perspective on measuring the on-site HTC in buildings. The next section looks into the existing literature on exisiting HTC measurement procedures. It is followed by a section on the methodology adopted to carry out the survey. The results of the survey are presented in the ‘Result’ section and elaborated under the section on ‘Discussion’. Finally, the main findings of the survey are summarized in the section on ‘Conclusion’.
2. Literature review
2.1. HTC measurement procedures
This section contains a short description of several state-of-the-art methods for measuring significant parameters for the HTC of a build- ing. For each method, a short description, required time and effort, and achievable accuracy are presented along with corresponding literature.
The most popular measurement methods carried out to determine the HTC of a dwelling uses a test known as Co-heating. The name is derived from the original format of the test which was developed to carry out testing on HVAC systems for energy performance and effi- ciency. The creators of the test, Sondregger and Modera developed a system whereby a building was heated with a temporary electrical heating system, then compared with the test that heated only with the installed HVAC system. The two results were then compared [16,17].
The Co-heating test is used in a different way in the current day, how- ever the outcomes are the same; the use the HVAC system in the dwelling has now been removed and only a temporary electrical heating system is used. This is a generally accepted method of measuring the HTC, but is not a formalized standard, although one is being developed [18]. It is usually carried out based on a method published by Leeds Beckett University and is believed by many to be the nearest document to a formal standard [19,20]. The strength of this document is that s has been used many different times and on many different housing types, so a portfolio of evidence exists [21]. This method is simple in its approach but has significant complexities, especially around data analysis. Elec- tric heaters and fans are placed in each room, these are set to reach around 25 ◦C homogenously throughout the building. An air perme- ability test is often carried out before the test commences to assist in separating the heat loss through air infiltration form the losses from conduction and radiation. The amount of energy required to maintain this elevated temperature is recorded, and then a formula which takes into account the external temperature and solar radiation during the test, forms the HTC for the building. It should be noted that usually these types of tests are carried out in dwellings of small to medium size, as the equipment requirements for larger buildings are extensive. This method has also been compared to other method of estimating an HTC and has been found to produce similar results under controlled conditions, with a building going through six stages of retrofit [22]. For these reasons it is seen as the standard to which other HTC methods are validated. The equipment required for a Co-heating test is extensive and requires a significant financial investment. The list of equipment includes, moni- toring systems for internal conditions, heaters, fans, controllers, power measurement equipment and a weather station. Add to this a range of fire protection equipment required for the heaters and a significant cost arises of approximately £5000. Of all the in-situ HTC estimation methods the Co-heating test takes the greatest number of days, usually between 7 and 14 days, dependant on a number of variables including, but not limited to, weather, type of building, moisture content of building materials and thermal performance of the building [23]. These all affect the amount of time that the building takes to reach a quasi-steady state. This must be achieved for the test to be deemed a success High performing buildings however can take much longer measure, Alexander finds that a testing period of up to 6 weeks can be required for a Passivhuas type of building, results were not also found to be valid for buildings constructed to UK regulatory standards between 2010 and 2012 unless a test length of 6 weeks in typical heating period, or a 3 week test period in only a 6 week period in the middle of winter was allowed for [24]. According to Jack, the accuracy of a Co-heating test is between ±8–10% on a series of tests carried out on a tradition- ally constructed building (brick and block) [25]. This is confirmed by other authors such as Alexander who state that the accuracy for highly insulated buildings to be greater than 10% [24].
QUB (acronym for Quick U-value of Buildings) as presented by Alzetto et al. is a methodology aimed at measuring the HTC of a building in 48 h or less [26]. For this purpose, the building’s thermal response to two stages of internal heat input (for practical purposes 0% and 100% of installed power) is measured and the parameters of a single-node RC model are fitted to the recorded temperatures. Preferably, the building should remain in approximately steady state during the first stage and cool down freely during the second. The two stages are applied either in the same or in two consecutive nights. A complementary blower door test (in case of good airtightness) or another technique (such as Nomenclature
EBC Energy in Buildings and Communities EPBD Energy Performance Buildings Directive EU European Union
HTC Heat transfer coefficient IEA International Energy Agency IOT Internet of Things
ISABELE In Situ Assessment of the Building EnveLope pErformances
ISO International Standards Organisation PSTAR Primary and secondary terms analysis and re-
normalisation
QUB Quick U-Value of Buildings UK United Kingdom
tracer-gas method) is needed to quantify the air change rate and how it impacts the building’s HTC. This method requires multiple electric heaters to ensure homogeneous temperature distribution throughout the testing period as well as the equipment for air change rate measurement.
With a similar setup as for a Co-heating test, indoor and outdoor tem- peratures have to be recorded. Given the number of heaters, cables and motoring equipment the building cannot be occupied during the period of testing. The time taken for a QUB test can vary, however it is practical to complete the test in under 48 h and less in some cases [27]. As with other test methods this can vary given the amount of measurement time, a typical measurement was carried out on a series of 6 retrofit scenarios under controlled conditions and were measured against a reference value from a Co-heating test. The average variance between the two values was found to be 13% with a maximum deviation of 15% [22].
ISABELE (In-Situ Assessment of the Building EnveLope pErformance) aims to compare design and as-built performance. An ISABELE test consists of three steps: Initially, the building’s conditions with no heating power applied are measured to assess the initial thermal energy stored. It is then heated to a set point 10 K above the average outdoor temperature (generally between 25 ◦C and 35 ◦C, setpoints above 35 ◦C are not implemented in practice to avoid materials overheating).
Throughout the test, shading devices such as window blinds, are shut, ventilation is turned off and any air outlets are blocked. Temperatures, heating power, air infiltration rate and external climatic conditions are recorded. This method is laid out in an experimental paper which also includes a comparison to the aforementioned QUB method. As with other test methods the building and weather characteristics can have a significant effect on the timescale to produce an acceptable result. In terms of number of test days, 2 is seen as acceptable for buildings insulated from the inside, however a building with substantial thermal mass and insulated from the outside can take longer. When compared to a reference HTC the ISABELE method is between 5% and 20% accurate in most cases, depending on the building, climatic conditions and measurement time.
PSTAR (Primary and Secondary Term Analysis and Renormalisation) is an older method that is seldom seen in published works and was introduced in the USA in the 1970’s by the National Renewable Energy Laboratory (formerly the Solar Energy Research Institute) of the US Department of Energy, with developments continuing throughout the 1990’s [28]. The PSTAR method is similar in many ways to the Co-heating test, in as much as heat equipment is installed alongside fans, and temperatures elevated, the significant difference is that a period of not only heating, but cooling (i.e lack of heating) will be present in the test property. The length of the data collection required for the test method is a lot shorter with the dwelling only being required for 2–4 days, compared with Co-heating which can take 10–15 days. PSTAR is dynamic and it is difficult to draw comparisons, but when compared directly to the Co-heating method, a deviation of 30% was found.
However, it should be noted that the paper around this method by Palmer et al. places caveats on this figure [28].
The Integrated Co-heating testing methodology was developed by researchers from Leeds Beckett University. This method differs from the original one in that it uses the heating appliances already installed in the home, such as a gas central heating system. This has significant ad- vantages, although the house does still need to be empty for a period of time and some equipment needs to be added to the heating apparatus [29]. The equipment needed to carry out this test is limited compared to a standard Co-heating test, but is still obtrusive. The setup for this test is relatively straightforward taking approximately half a day, to install sensors and to setup the heating system, and another half day is required to drain down the heating system and install the heat meters. The length of data collection should be between 14 and 21 days dependant on a number of variables such as building type and weather. According to the paper by Farmer, the accuracy when compared to a Co-heating test is found to be between ±2–8% [29].
The Loughborough In-Use Heat Balance (LIUHB) method was
developed by researchers at the Loughborough University (UK) [30].
The principles are similar to the Integrated Co-heating method in as much as the heating system in the property is used to heat the building rather than supplementary equipment. The significant difference be- tween the two methods is that the building can be occupied and heated to “normal” levels rather than overheating. The setup for the test re- quires addition of accurate temperature sensors to each room of the building and continuous logging of energy supplies to the building. The sensing equipment and energy logging can be added in half a day. The duration of the monitoring is a minimum of three weeks. This test must take place in the heating season and a Delta T of 10 K should be achieved during a significant proportion of the testing period. This is a method has also been tested against a Co-heating test. This was carried out in three homes under simulated occupancy and normal occupancy conditions, and the accuracy was found to be around ±15% when compared to a Co-heating baseline.
CAM(B)BRIDGE (acronym for Calculation and Measurements in Buildings: Bridging the Gap) is a methodology based on experiments presented by Masy et al. and aimed at measuring the HTC of a building façade in collective buildings where the testing of a unit has to be done without accessing the adjoining zones [31]. The measurement process was originally intended to be carried out in 9 days, but experiments showed that a 4 day period is sufficient when the measurement is per- formed during summer in units that are sun exposed and benefit from significant solar heat gains. Statistical confidence intervals within 3%
have been observed on 5 measurement sites but this result should be considered with caution as confidence intervals are obtained from an implicit good fit assumption related to the statistical analysis method.
The average method is an accumulated averaging method for the HTC estimation of in-use buildings. The method has been developed and used to estimate the HTC of an in-use office building before and after its energy rehabilitation [32]. The in-use HTC of the building must be estimated by plotting the accumulated average of the HTC, until the estimate is stabilized within a ±10% band of the final HTC estimate over the last 24 testing hours. As with other test methods, its accuracy can vary given the amount of measurement time and weather conditions.
However, during the IEA Annex-71 common exercise, this method was applied to the Loughborough case study data set and the obtained HTC results were compared against a reference value measured using a Co-heating test. The average variance between the two values was found to be 4% with a maximum deviation of 11.5%.
The Dynamic Integrated method intends to be a kind of generalisa- tion of the Co-heating test to be applicable to any weather conditions of buildings in-use. It is named as such because the analysis is in essence fully dynamic but uses energy balance equations in integral form. This method has been applied to several case studies. Naveros et al. report an exploratory work applying this method to an opaque wall [33]; Castillo et al. describes the application of this method to a room of an in-use office building [34]; Ch´avez et al. report an in depth analysis of the method and its validity based on data from the Round Robin Test Box (RRTB) constructed and tested in the framework of EBC IEA Annex-58 [35]. This method requires measurement of a set of driving variables representing all the relevant contribution to the energy balance in the air volume confined by the building envelope to be characterized. The in- door air temperature must be homogeneous. As the method is dynamic, measurements must guarantee the correct representation of the measured variables with a sampling frequency at least twice the fre- quency of the measured variables. The minimum test period is 20 days, using 10 points for each linear regression, taking into account that the method requires at least one day for each point, and using at least two estimates to check the validity of the results and to calculate the un- certainties. However, larger periods could be necessary. Depending on the weather and test conditions, integration periods larger than one day could be necessary. The identified HTC for the RRTB considering a four-day integration period was 4.08 ±0.6%, while the HTC obtained using the Co-heating test and Siviour analysis reported by Baker is 4.06
±2.5% which indicate a 0.5% deviation between the results applying both methods [36].
The RC Dynamic method uses an electrical analogy with resistors and capacitors (RC) to represent the building as a thermal system. The RC model must incorporate all the relevant contributions to the energy balance in the air volume confined by the building envelope to be characterized [37]. Typically, two parallel branches are necessary to represent the building. One branch is representing the heat transfer through the opaque walls. Different number of nodes connected to thermal capacities depending on the thermal mass of the building en- velope may be necessary in this branch. Another branch without accu- mulation is typically used to represent the fast heat transmission through the building envelope (windows, air leakage, thermal bridges).
LORD software has been used to identify the parameters of the model [38]. The test campaign must be conducted under clearly dynamic conditions. The main driving variables must present a large amplitude regarding the uncertainty in their measurements. The minimum test period depends a lot on the test conditions (weather, heating or cooling schedule, whether the building is empty or in-use, occupancy patterns in case of being in-use, etc.) Typically, one month is enough to estimate the HTC. At least two values of the HTC must be obtained in order to vali- date the results. Consequently, a testing period of two months is typi- cally required in this approach. The identified HTC for the Loughborough buildings applying this method was 300 W/K±2% while the HTC obtained using the Co-heating test reported by Beizaee et al.
was 382 W/K±10%, which indicates a 21% of deviation between both the results [39].
An important note to make here is that the errors for the above mentioned methods are all deduced by comparing them to the Co- heating test because of its prevalence [40]. However, the Co-heating test has been criticised for several issues including repeatability, the way the solar radiation is accounted for in the measurement and analysis.
In addition to these intrusive and semi-intrusive methods, there are also non-intrusive methods that deduce the HTC of a building. One of such examples is the method proposed by Chambers and Oreszcyn [41].
This method is based on a steady-state grey box building model com- bined with a data processing pipeline and a model fitting method. The median heat power loss coefficient derived from analyzing smart meter data from 750 UK dwelings was found to be 0.28 kW/◦C (±15%). Other such methods that look into the electricity consumption and its corre- lation with the outdoor air temperature have been presented for datasets from different regions [42,43].
2.2. Previous stakeholder surveys
Recent literature shows that surveys are a powerful medium for unfolding the perspective of the stakeholders in the building and the construction industry. A survey by Ling-Chin et al. showed that the perspectives of the industrial stakeholders did not fully align with the national policies in most aspects of thermal performance of the built environment [44]. However, the industry had no objection to employing low carbon technology alternatives in the future. The study concluded that consultation with industry should be carried out continuously to assist in the formation of future national policies to significantly improve the thermal performance of the built environment. Zou et al.
conducted an extensive literature review on the stakeholder’s perspec- tives on the building energy performance gap. They recommended the energy performance information integrity, big data collection, stake- holders’ attributions, decision criteria and behavior, modelling and simulation validation and stakeholder interactions as some strategies for further research [45].
Stakeholder acceptance and behavior on implementing national building policies may be a barrier, but this can be reduced, or overcome entirely, if the related stakeholders are informed about such measures and support any measures that are introduced. It is important to
establish a comprehensive understanding of acceptance, behavior, and motivation at different levels of involvement for the relevant stake- holders [46].
A survey report published by the Enerfund project looked into the responses of the Energy Service Companies (ESCO), financial in- stitutions, building owners and property managers regarding the reno- vation of existing buildings. It was found that the ESCOs prefer a short contract duration for payback of energy efficiency investment (around 5 years) and that a comprehensive reconstruction of buildings cannot be financed only from energy savings and additional financial resources are necessary [47]. The survey revealed that the ideal building candidates were large non-residential buildings with simple building services in- stallations and high energy expenses.
Zedan and Miller investigated the stakeholders’ influence on energy efficiency of housing development [48]. They proposed a four-stage methodology that takes into consideration and reinterprets the influ- encing attributes and combines them into a single equation. This helps to identify the reasons behind the negative/positive influences on energy efficiency, and whether these reasons are related to power, interest, time, etc.
Regarding expectations from the stakeholders, a difficulty seems that different stakeholders expect information on different topics and in- dicators [49]. A way to tackle this is to ask the various stakeholders for their preferences and expectations [50]. Research also shows ap- proaches for determining the key stakeholders and extracting vital in- formation for multi-level energy performance analysis [51].
This shows the benefits and strengths of conducting a stakeholder’s survey and we too employ this technique to obtain the stakeholder’s view on the characteristics of a HTC measurement method.
The literature review shows that the on site HTC measurement processes are inclined more towards academic and industrial research and development rather than being part of a wider application in the construction process. As such, there is no existing process of measuring HTC that is widely adopted. As mentioned earlier, it seems that there is only a limited number of individuals who have the knowledge to set up such tests and to correctly interpret the raw data to determine the HTC.
In order to know the stakeholder’s perspective on measuring the on-site HTC in buildings, this work builds upon the survey design and result analysis. The next section looks into the survey design research roadmap of this work.
3. Methods
This work is part of the international research project ‘IEA EBC Annex-71 Building energy performance assessment based on in-situ mea- surements’ that aims to develop methods that can be used to calculate the HTC of buildings using measured or available data from sources such as smart meters, thermostats and IOT devices [52]. The measured HTC can be used to evaluate energy use and savings in a building and to prove the actual energy performance. It can also be used to assess the quality of workmanship to provide a guarantee of quality to the building owner, while providing an innovative certification label, for compliance checks in EPBD regulations. Since one of the goals of the IEA EBC Annex-71 project is to investigate the extent to which the calculated HTC can be used in a quality assessment framework, it is important to know the perspective of the stakeholders that are involved in this domain. One of the identified ways to get their feedback is by conducting a survey.
3.1. Survey design
Surveys are essential for discovering the incidence, distribution and interrelationship of variables within a population [53]. They provide a direct description of the intents of the participants while collating data for futher statistical analysis. There are various methods and forms to conduct a survey, such as via mails or intereviews. For our study, we use the online questionnaire as a survey tool since this allows a large
population to be assessed with relative ease [54]. The target stake- holders are from the building and the construction domain and include professionals such as the architects, building engineers and contractors, energy consultants, policymakers, etc in the 14 participant countries of the IEA EBC Annex-71 project.
With this view, a cross-sectional survey was designed which is categorized into four sections. Since the survey was distributed to varied stakeholders, the questions were kept as direct as possible, without any penetration into the technical details. To make the classification of the questions easier, the survey was divided into four sections. The first section deals with profiling the surveyed stakeholders in order to be able to distinguish the given answers. The second section takes a look at the interests and the opportunities for a method that is able to measure the HTC of a building after delivery, both for the stakeholders and their customers. The questions in this section aim to obtain their opinion on the many factors that influence the calculation of the measured HTC in buildings. The results of this section should tackle the incentive of developing methods for on-site energy performance characterization and place this in a broader perspective of their interests. The third sec- tion tackles the boundary conditions in time, cost, duration, error and results representation for measuring the HTC. The answer to the ques- tions of this section shall provide many valuable and practical insights.
Finally, the last section deals with the concerns and the opportunities that the stakeholders perceive for the application of an on-site HTC calculation method. This will help the IEA EBC Annex-71 project in developing methods that answer the needs of the stakeholders.
3.2. Data acquisition and research roadmap
The questoinnaire was distributed within the network of the Annex- 71 participants in 14 countries and in several languages including Dutch, English, French and German. Between January and December 2019, the questionnaire has been widely disseminated and a total of 243 responses were collected that are complete in all aspects. The survey was prepared using a secured Google forms platform and takes about 20 min to complete. The response rate for the survey was around 20%, after sending two reminders in the gap of 2 weeks. While the exact reasons for this response rate are unknown, the authors feel that this may be due to the lack of communication and penetration into the stakeholders who are deligently equipped with their projects. All the responses are later translated into English in order to prepare the results for the analysis.
Although the country-wise analysis is equally meaningful, it is avoided as the focus of this study is to look into the responses of the various stakeholders and to analyse these differences. The number of responses per country is seen in Fig. 1. In addition, the analysis of the
country-wise responses will require a totally different approach, starting with design of the questions to analysis techniques such as the correla- tion analysis. With these reasons and also to keep the length of the paper to a reasonable limit, we focus on the results and discussion for the stakeholder-wise distribution.
As the survey aims to help the IEA EBC Annex-71 project to obtain valuable and practical information from the stakeholders, the analyses of the results take a direct approach where each question is analyzed as per the different stakeholders. We asked the participants to specify the type of company or organisation they work for and clustered these into 13 major stakeholder categories. Since stakeholders named their pro- fession themselves, without a given categorisation upfront, there might be some overlap among the stakeholder groups. In particular, making the distinction among the various engineering groups was not always clear. The discussion on the results follows the sections of the ques- tionnaire, beginning with an assessment of the types of the stakeholders.
This leads to the analyses of their responses on the various benefits that HTC meausrement offers. Some interesting insights into the type of the sakeholders and their perceived beneifts can be observed. This is fol- lowed by analyses of their responses on quantifying the time, cost and accuracy of the method to measure the HTC. The last section inquires on any further concerns and opportunities that the stakeholders have. Since this is a qualititative response, we provide a summary of their responses without any bias. Further, we select 4 stakeholder-types and tabulate their responses and discuss these with a view to closely look into any inclination of their preferences based on their profession.
4. Result
4.1. Profession of the stakeholders
Stakeholders from a total of 14 countries participated in the survey.
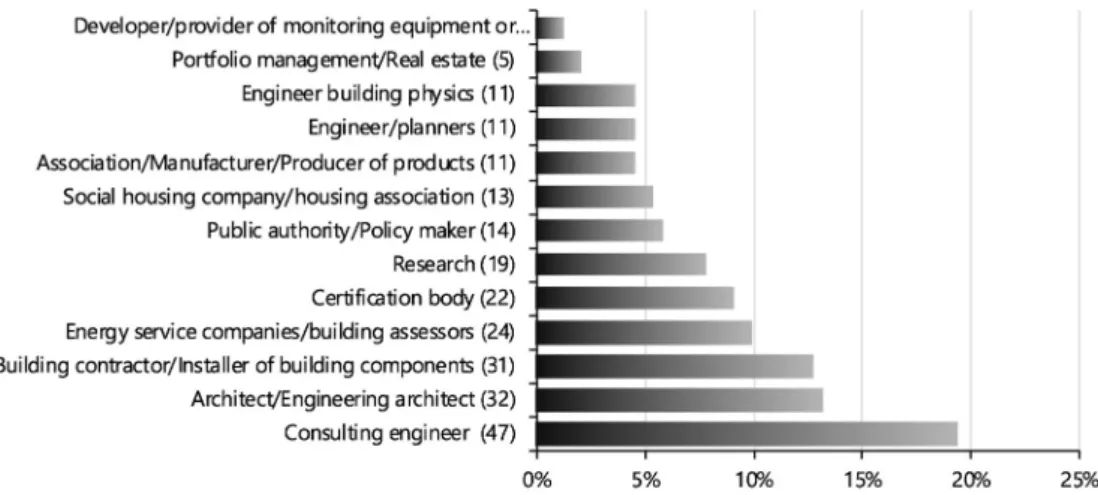
These include Austria, Belgium, Denmark, Estonia, France, Germany, Ireland, Italy, Norway, Spain, Sweden, Switzerland, The Netherlands and the UK. Based on the description the stakeholders gave themselves, we broadly identified 13 stakeholder categories, as seen in Fig. 2. It needs to be said that there might be some overlap among these groups.
The highest participation is by the consulting engineers in the building industry, although in making the classification the distiction between consulting engineer and engineer building physics was not always clear.
It is followed by architects, building contractors and energy service companies. Together with research and certification body, these form more than 70% of the total participation by stakeholder-type. Overall, there is a fair distribution of the stakeholders that participated in the survey. Fig. 3 shows the types of buildings that the company or the organisation of the stakeholders operate on. We see that the majority of the stakeholders are involved in all types of buildings. Therefore, the responses of the survey will reflect the experiences that pertain to a majority of the buildings.
4.2. Stakeholder’s interest in measured HTC
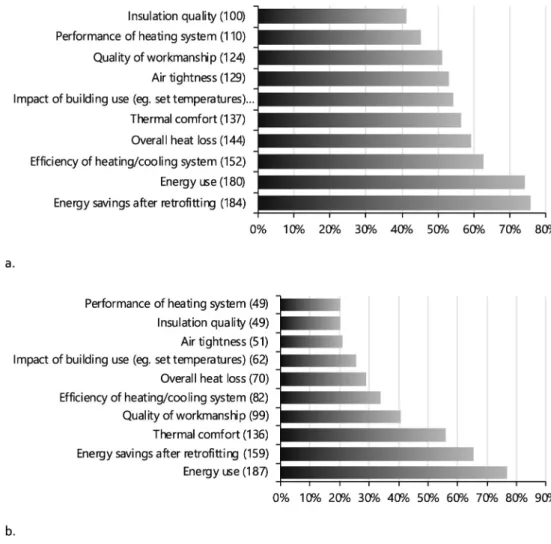
The results of this section show that the stakeholder’s find the existing methods of calculated energy performances quite reliable with over 75% participants supporting this (Fig. 4a). However, it is inter- esting to note that over 90% of the stakeholders are still interested in a method that can measure the actual energy performance using the on- site HTC meausrements (Fig. 4b). This indicates that there is a good opportunity to introduce a reliable method based on measurements. The stakeholder’s also feel that their customers will be interested in such a method with over 85% participants supporting this. Fig. 5a and b shows the aspects in which the stakeholder’s as well as the customers will be interested in. In both cases, we see that ‘Energy use’ and ‘Energy savings after retrofitting’ are the two major aspects. This shows the high importance of the final energy consumption in the current and retro- fitted stages of a building. This is also because the final energy Fig. 1. The plot shows the number of responses per country. Although the
number of responses from each country varies, the focus of this study is to look into the responses of the various stakeholders and to analyse these differences.
consumption is often a criterion to determine the rating on the energy certificate. From the customer’s perspective, the energy savings are directly related to financial savings. These aspects are followed by ‘Ef- ficiency of the heating and cooling system’ and ‘Thermal comfort’ for the stakeholder and the customer respectively. We see that the ‘Insu- lation quality’ is a less popular choice for both categories. This either shows that the current quality of calculating insulation losses and gains is good or that this aspect does not affect the energy performance calculation as much as other aspects in their opinion.
The stakeholders were also asked about the services they could give to their customers based on such on-site measurements. The results show that ‘Design and retrofit guidance’ is the top service that the stake- holders could give to the customers. This is followed by ‘Quality assur- ance’ and ‘Inform changes in building operation’. This also shows that the stakeholders realise the customer’s interests and associated benefits for on-site measurements. It is interesting to see that only 8.19% of the responses show that the customers will be interested in ‘Building energy classification’. This indicates that the customers are rather interested in tangible and not theoretical benefits. In-situ building energy perfor- mance does not yet have legislatory limits, with the exception of airtightness. In the event that these were introduced, this would add another obvious demand for performance measurements which was not covered in this survey.
4.3. Characteristics of an on-site HTC measurement method
This section of the survey deals with responses regarding the attri- butes of the method that will measure the HTC in a building. Firstly, 91.38% of the stakeholders answered affirmative to the question whether they are interested in determining the HTC on-site if tools and methods are available. In relation to the time of conducting the test, there is equal division between before and after the delivery of the
building (Fig. 6a). We will later discuss on the type of the stakeholder and their preferences regarding this aspect. In terms of the cost, we see that the majority prefer a range from €100 to €500, followed by €500 to
€2000 (Fig. 6b). Compared to the existing cost of an on-site measure- ment setup, this is indeed less [57]. A typical cost for a Co-heating rig for an average house is €10000. In terms of the duration of such a test, the majority of the stakeholders prefer a period of no more than a few days (Fig. 6c). In similar terms, the ISO 9869–1:2014 – ‘Thermal performance of buildings - Transmission and ventilation heat transfer coefficients - Calculation method’ standard prescribes the U-value calculations based on measured data where the test duration should exceed 72 h [55]. In order to fulfil this and other prescribed conditions, Deb et al. found that it takes data from several days to fulfil all the measurement conditions prescribed in the ISO standard [9,56]. In comparison, Co-heating tests do not yet have such rigid criteria for measurement completion as defined in ISO9869–1:2014, however, as previously mentioned, Stamp et al. found that Co-heating tests in relatively low performance houses could be completed within 72 h during winter, but that in higher per- forming dwellings tests may take much longer or even be impossible in all but the coolest weather conditions [23]. In terms of the measurement error, about 76.5% of the stakeholders feel that the measurement error should be less than 10% while 18.1% feel that it could be between 10 and 20% (Fig. 6d).
4.4. Concerns and opportunities
The last section of the survey inquires about the complications that could occur for on-site measurements and the stakeholder’s suggestions on these. These two questions were open, and therefore, some inter- pretation of the answers was required, as the words used by the stake- holders differ even while supporting the same argument. Regarding the complications, we aggregated the responses based on their similarity Fig. 2. Professions of the various stakeholders that participated in the survey.
Fig. 3. Scope of the building-types operated by the stakeholders.
and ranked them in accordance to their occurrence. A total of 101 an- swers are received for this question. The main complication as per the stakeholders is the consequenses of bad results. The ‘bad results’ or deviations from estimation can be due to the building construction quality, but may also arise due to other factors, including measurement or calculation errors. In some cases, more work of interpretation is required, and this induces uncertainty in the analyzed answers. For instance, for the first question on ‘complications’, it has been decided by the analyst that “Yes, warranty discussions Tolerances” (sic), “In case of deviations between measured value and calculation, there are discus- sions”, “Yes, the interpretation playroom” or “What do we do if the performance is not there?” were four different ways for the stakeholders to illustrate their concern regarding the interpretation of results not reaching the expected values, leading to complications and an unknown situation. Therefore, they were all counted in the same category called
‘consequences of bad results’. The stakeholders further express that there is no clear action that should take place if this happens, but also that even if there was such a clear action (repair, fine, etc.), these may give room for interpretation and cause issues with responsibility and liability towards the customer. This shows the high significance of an accurate measurement and calculation method. The other major con- cerns of the stakeholders are the influence of the weather on measure- ments, user behavior during measurements, time, complexity, cost and privacy of the customers. As seen, most of the concerns are customer- centric. This emphasizes the need for an easily-deployable measure- ment setup that is as non-intrusive as possible.
The stakeholders also provided suggestions for the application of the method. The suggestions aren’t as comparable as the concerns expressed by them. However, a general trend observed in their suggestions relates to additional services that could be rendered using the HTC
measurement setup. For example, it could be used for assessing the building envelope’s performance while detecting the biggest energy consumers. It could also be used to optimize operations (e.g heating curve) and to build a database of measured values for a group of buildings. For this question, the most common answers tend to be points that have already been widely discussed (e.g. ‘could be used as an input before renovation works’), while the least common answers can be more original. For instance, individual people proposed to use on-site HTC measurements to monitor the use of public subsidies, or to help with preventive maintenance. Finally, answers of different stakeholders are obviously not coordinated and can seem contradictory. For instance, calculation tools are mentioned several times by different participants.
For instance, one of them says that an on-site measurement could help develop a numerical tool, another says that it could help validate it, while another says that it could complement it, and another says that it could replace it. While these uses are not mutually exclusive, they do not lead to a clear conclusion.
5. Discussion
5.1. Four selected stakeholders
To compliment the aggregated view on the results with individual, stakeholder-specific reponses, four individual stakeholders of the most represented stakeholder groups were selected. Their responses are analyzed in order to have a deeper view on their flow of opinions through the questonnaire. The selected stakeholders are (1) a consulting engineer, (2) an architect/engineering architect, (3) a building contractor/installer of building components and (4) an energy service company/building assessor. For ease of interpretation, the questions of Fig. 4. a. Stakeholder’s opinion on calculated energy performance b. Stakeholder’s interest in measured energy performance.
the survey in Table 1 also refer to the Figures in this paper. It is to be noted that these four stakeholders were selected because of their overall interesting inputs and points of view. This does not mean that they are an average stakeholder in their group. Due to the limited amount of participants in each stakeholder group and the fact that the answers in each group are still quite scattered, a stakeholder with an average opinion in its group would not necessarily be the most interesting stakeholder to look into their individual answers. It is seen that their
views on on-site determination of HTC differ because of their experi- ences in design and excecution.
Of these four individuals, the consulting engineer has the most trust in the reliability of calculated energy performances, but might be interested in measurements to even improve these models for future projects. Therefore, he prefers a high quality assessment which may even take longer to perform.
The architect/engineering architect is in favor of HTC Fig. 5. a. Aspects in which stakeholders are interested b. Aspects in which customers will be interested.
Fig. 6. Responses of the stakeholders regarding a. Time of conducting the test b. Cost of the test c. Test duration and d. Acceptable measurement error.
Table 1
A detailed look at the four selected individual stakeholders based on their answers to all the survey questions.
Stakeholder group (
Fig. 1) Consulting engineer Architect/Engineering architect Building contractor/Installer of
building components Energy service companies/building assessors
Building types (
Fig. 2) All types of buildings All types of buildings Residential single-family buildings All types of buildings Reliability of
calculated energy performances ( Fig. 3a)
A lot A little A little A little
Interest in methodology ( Fig. 3b)
Quite a bit Quite a bit A lot A lot
Aspects of this energy performance ( Fig. 4a)
Air tightness; Efficiency of heating/
cooling system; Energy savings after retrofitting; Energy use; Impact of building use (eg. set temperatures);
Overall heat loss; Quality of workmanship; Thermal comfort.
Energy savings after retrofitting;
Energy use; Overall heat loss;
Performance of heating system;
Thermal comfort.
Air tightness; Efficiency of heating/
cooling system; Energy savings after retrofitting; Energy use; Impact of building use (eg. set temperatures);
Insulation quality; Overall heat loss;
Quality of workmanship.
Efficiency of heating/cooling system; energy savings after retrofitting; energy use; Impact of building use (eg. set temperatures);
Insulation quality; Overall heat loss;
Quality of workmanship; Thermal comfort.
Aspects of this energy performance for customers ( Fig. 4b)
Efficiency of heating/cooling system; Energy savings after retrofitting; Energy use; Thermal comfort.
Energy savings after retrofitting;
Energy use; Thermal comfort. Energy savings after retrofitting;
Energy use; Insulation quality; Quality of workmanship.
Efficiency of heating/cooling system; energy savings after retrofitting; energy use; impact of building use (eg. set temperatures);
insulation quality; Quality of workmanship; Thermal comfort.
Services to
customers Inform changes in building
operation; Input to energy model. Quality assurance Quality assurance Retrofit assessment; Design and retrofit guidance; Inform changes in building operation.
Interest in determination of HTC
Yes Yes Yes Yes
Interest in determination of HTC - Why?
Quality control and knowledge
enhancement for other projects. Quality control on the one hand and to show improvement potential on the other.
We’re aware of the performance gap and want to make sure we deliver the best job possible. The quality assurance would be a differentiator from our competitors, we would also like to be able to analyse the performance of our sub-contractors (i.e. workmanship) and different product options.
Crucial for evaluation of buildings and quality of workmanship.
Acceptable time (
Fig. 5a) The latest one year after delivery Before delivery Before delivery The latest one year after delivery Acceptable time -
Why? Only then does the operation
become visible. The human factor leads to
inaccurate measurements. Really important to have a comparison
before and after a retrofit. A provision would be advantageous before handover, but also during use. Particularly in the case of renovation measures, measurement is only possible with parallel use.
Acceptable cost (€) (
Fig. 5b) 2000–5000 500–2000 100–500 2000–5000
Acceptable cost -
Why? Depending on the size of the building, very different costs can be implemented.
The costs must be dependent on the volume, on the capital employed.
Price is extremely important to winning work and our clients do not yet ask for performance measurement, so this would be an additional cost compared to our competitors. The acceptable price would be different if the measurements were for a sample of dwellings or all dwellings.
Depends strongly on building type and size. Costs of 5–10 EUR/sqm (typically well below annual heating energy costs before renovation) should be achievable.
Acceptable duration
(Fig. 5c) Few months One day Few months Depends strongly on the type of
execution Acceptable duration
- Why? Only then qualified statements
possible. It can also be longer. The
question is rather how limited such a test would be. If no large restrictions were to be expected, then the test could last also 5 years.
Time of measurement is not so important if the measurement is not invasive. Our projects are carried out on 10s or 100s of dwellings over an extended period (months or years), so we have lots of time on-site to facilitate measurements.
With minimally invasive measurement parallel to use, measurement over a complete heating period is possible. If the use is impaired, a weekend would still be feasible in many cases, but not more.
Acceptable error (
Fig. 5d) 10–20% Less than 5% 10–20% 5–10%
Acceptable error -
Why? 10–20% accuracy is already difficult
with a dynamic system. A survey only makes sense if it is
also accurate. I appreciate the test cannot be extremely accurate, but the retrofit measures we install may only improve the thermal performance by 25% or so and it’s important that we can detect this level of improvement.
Up to 10% error should still be acceptable, better significantly less.
In the case of larger errors, one is hardly better than an expert appraisal without measurement.
Complications Yes, there may be disputes
between the customer and the executor.
Difficulties with access. Often no access to WiFi if required for sensors. Heat input may be low in social housing.
(continued on next page)
determiniation because he relies less on calculated performances and this could contribute to a quality control before delivery. It also might be useful to show the improvement potential of an existing building.
However, the test should be limited in effort and should have a high accuracy. Therefore, he prefers a measurement on an unoccupied building.
The building contractor/installer of building components wants to prove the quality of their work in comparison with his/her competitors.
The quality assurance is perceived as a differentiator and this could be a tool for controlling the performance of the sub-contractors and different product options. Because of that, the measurements should be done before delivery and should also be limited in costs for being able to be competitive.
The energy service company/building assessor finds the on-site determiniation crucial for the evaluation of buildings and quality of works. The measurements could run over a longer period when there is low nuisance for the building users. The accuracy should be rather high because otherwise an expert appraisal can be used instead. For him, not only the overall HTC would be of interest, but also the heat loss through the various components in a building. The energy service company can then use this information for better assessment of the building and for devising retrofitting measures.
We observe that ‘quality’ and ‘quality control’ is a repeated theme not only amongst these four respondents, but also across the survey. This seems to reflect an awareness of the performance gap and a commercial interest in ensuring in-situ performance measurements as well as satis- fying legislated as-designed thermal performance limits.
5.2. Measurement time, cost, duration and accuracy
The responses from the stakeholders clearly show their interest in a method that can calculate the HTC on-site. In order to derive practical information, this section takes a closer look into their responses regarding the time of the measurement, setup cost, duration and acceptable error. This analysis is done by looking into their reasons for chosing a particular response and by discussing the responses in regards to the different types of stakeholders.
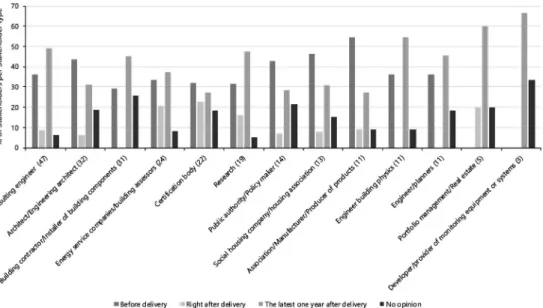
In regards to the time of performing the HTC measurements, the stakeholders feel that it should be measured one year after the delivery.
This will allow assessment of the HTC during regular operation which could be different in the first year when compared to the rest. It will also provide the real, operational values that includes user behavior. As the building system stabilization takes time, it is worthwhile to measure after several months of the delivery. The consulting engineer included in their response that the measurments would be useful as learnings for other projects: ‘feedback learning loops are likely to be important steps in closing the performance gap in general as well as addressing each building individually’. The least number of participants opted for the option ‘Right after delivery’. They express that this will determine the effectiveness of build-quality of a new or retrofitted building and could also be integrated into the payment scheme for the contractor. Those who feel that the HTC should be determined before delivery express that this will help in quality control, and if necessary deficiencies can still be
remedied before the handover. An added benefit is the absence of users which will enable a thorough measurement setup. Those with no opinion on this matter confirm this interpretation and express that the measurements would have different benefits at different stages. For example, before the delivery, it could be part of the verification mech- anism, whereas several years after completion it could be used to test the durability of the materials and quality of the execution. Some partici- pants also suggested that the tests should be done after several years of building operation. This option was not given to them in the survey and could have been interesting if it had been included.
Regarding the setup and measurement cost, most participants expressed that this factor depends strongly on the size and complexity of the building. There is a unanimous opinion by the participants that the costs should be expressed in €/m2. The cost should on the one hand reflect the effort, and match the potential of the energy saving, but on the other hand not be too high to keep the setup affordable. We note that affordability is one of the key factors for upscaling the entire process of measurement and calculation. Practically, costs are likely driven by the expense of the equipment and particularly by the amount of time and expertise required per measurement. Driving down cost, therefore, is likely be driven by automation of HTC calculations and perhaps by integration with measurement systems already installed in houses (e.g.
heating controls and smart meter devices). This provides a large scope for research and development and many studies are already looking into ways to harness the existing data in buildings for performance assessment.
The responses on the duration of measurements could be divided into two major opinions. First, the ones who feel that the duration should be shorter (an hour, a day, and few days) collectively believe that the setup will cause unwanted nuisance to the occupants. Those who say that longer test periods are required express that it is the only way to account for the building’s time constant, weather variables and the variable user behavior. This will lead to a reliable estimate of the HTC. They also feel that a setup of a non-invasive nature should be able to deal with this challenge. This also ties up with the observation that existing data in buildings should be harnessed to a maximum extent.
The responses regarding the accuracy of the measurement show that those who prefer a high accuracy (5%, 5–10%) mention that this is important to remain competitive. The proposed accuracy should be better than the current calculation methods, as also indicated by the energy service company/building assessor in Table 1. Moreover, it is hard to enforce measures based on uncertain values. Those who feel that an accuracy of 10–20% or higher is accepatable mention that it is un- realistic to obtain a better accuracy given the large variability and challenges in in-situ measurements of occupied buildings. Rather, the results could provide only a rough estimate of the HTC and the build- ing’s performance. It is to be noted that only about 20% of the partici- pants feel that the accuracy could be in the range of 10–20% or worse.
We also look into the responses in regards to the different types of the stakeholders. This is done to assess whether a particular stakeholder group has specific preference or if the responses could be generalized. As mentioned in the earlier sections, we divided the stakehodlers in 13 different types as seen in Fig. 1. In regards to the best time to conduct the Table 1 (continued)
Stakeholder group (
Fig. 1) Consulting engineer Architect/Engineering architect Building contractor/Installer of
building components Energy service companies/building assessors
Suggestions It will show very good inputs for
improvement and optimization possibilities.
As well as retrofit we also provide maintenance contracts for local authorities and housing providers, we would like to include this in our asset management products so that we can give better recommendations for retrofit measures and possibly contribute to preventative maintenance.
We see a need to estimate the heat transfer coefficient also for individual components such as roofs, basement ceilings, areas of the external facade.
test, we see that only the energy service companies and the certification bodies are proportionally more inclined towards conducting the test right after the building delivery (Fig. 7). Whereas, the consulting engi- neers, the architects and the building contractors are least interested in conducting the tests immediately after the building delivery. It is interesting to note that the latter three groups are directly related to the building delivery. The building contractor is also the group with the highest percentage of ‘no opinion’. This might indicate that they gain the least with an accurate, on-site measurement setup. The other groups like the researchers and building physics engineer tend to feel that the measurements are best done at the latest one year after the delivery.
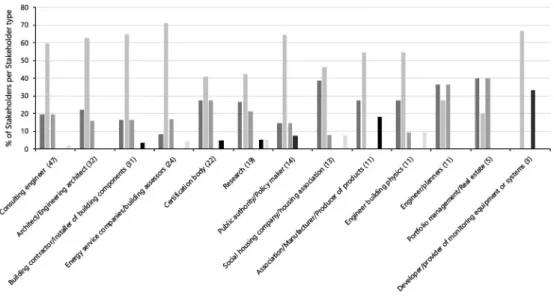
In terms of costs, we see that the building contractors have the highest percentage of reponses for a range between €100 and €500 (Fig. 8). On the other hand, the certification bodies, energy service companies and consulting engineers have the highest percentage of re- sponses for an acceptable cost between €500 and €2000. Very few par- ticipants have opted for a cost below €100 and above €2000. It is perhaps surprising that few respondents selected a low cost test and may reflect that most recognize the difficulty of the measurement and the value of the result.
In terms of the test duration, the consulting engineers, the architects and the building contractors have the highest percentage in favor of conducting the tests for a few days (Fig. 9). The energy service com- panies and the certification bodies favor the tests for an hour and a day.
Looking into the complexities in measurements and building operation, it is unlikely that an hour or a day will provide accurate estimation.
However, it is clear that the majority of the stakeholders are not in favor of longer tests (lasting weeks). It should however be noted that the participants seem to overestimate the nuisance to inhabitants. When inhabitants are not hindered, tests could last longer. In practice, both approaches are likely to be attractive for different purposes. For newly built and retrofitted properties, it is likely that the measurements will need to be quick due to the cost of vacancy to the developer. For assessment of exisiting buildings, the balance could shift the other way, requiring a less invasive test but where the speed of the test is less critical.
In terms of the acceptable error, there is a similar distribution of votes among the stakeholders with the majority believing that an acceptable error should be in the range of 5–10% (Fig. 10). Only the certification body and social housing group have a higher percentage in favor of an acceptable error of less than 5%.
5.3. Country-wise outlook
As the majority of responses are only from a few countries, it is hard to perform a reasonable country-wise analysis. However, we found some interesting differences which are briefly presented in this section. We took only the following countries into account: Austria, Belgium, Estonia, France, Germany, Norway, Spain, Sweden, Switzerland, The Netherlands and the UK. For the rest of the countries, only 2 or less stakeholders participated and therefore, these are omitted.
In terms of their opinions on the reliability of the current methods of the calculated energy performance, stakeholders from Spain, UK, Austria, France and Germany are a bit pessimistic than the ones from Switzerland, Belgium, Norway, Estonia, Sweden and the Netherlands. In these countries, almost half or more of the stakeholders answer that they think calculated energy performances are absolutely not or a little reli- ability, compared to only one third (Estonia) or far less than a third in the other countries. It is interesting to note that among the countries that trust the calculations the least, namely the UK and Austria, around 40%
of the stakeholders do not think that their customers are interested (absolutely not or a bit) in the actual energy performance of the build- ing. However, most stakeholders say that they themselves are very interested in the actual energy performance, including all stakeholders from the UK and Austria (quite a bit or a lot).
When we compare what stakeholders think is an acceptable duration for a HTC measurement, it is interesting to see that in Switzerland and France, a vast majority thinks that the assessment should not take more than a day. In contrast, for other countries, a third or more of the stakeholders think a few days or more are acceptable and in the UK, Germany, Sweden and the Netherlands a third even think that a few weeks or more is acceptable. What stands out is that in Norway and Sweden, almost no stakeholders say that the assessment should not take longer than a day: they almost all find a few days or longer acceptable. In Sweden, we also find that most stakeholders accept higher costs for the assessment, that is, 80% accept €500 or higher and 40% accept €2000 or higher. Also, in France, two thirds of the stakeholders accept costs of
€500 or higher, which seems in coordination with the finding that most stakeholders in France opted for a short assessment duration, whereas in Switzerland, 50% of the stakeholders prefer a lower cost but a speedy measurement.
6. Conclusion
This survey provides many useful insights which can be used for
Fig. 7. Responses of the different stakeholders on the best time to conduct the HTC measurements.