Bornimer Agrartechnische Berichte
Heft 59
Potsdam-Bornim 2007
Mathematical Modelling of Solar Drying System for Production of High Quality
Dried Tomato
Bornimer Agrartechnische Berichte Heft 59
Potsdam-Bornim 2007
Experimental Studies and Mathematical Modelling of
Solar Drying System for Production of High Quality
Dried Tomato
Max-Eyth-Allee 100 14469 Potsdam
℡ 0331 5699-0 Fax 0331 5699-849
E-Mail atb@atb-potsdam.de Internet www.atb-potsdam.de
April 2007
Redaktion/Editors
Dr. Engr. Md. Ayub Hossain*
Prof. Dr.-Ing. Klaus Gottschalk**
*Senior Scientific Officer
Farm machinery and Postharvest Process Engineering Division Bangladesh Agricultural Research Institute
Joydebpur, Gazipur-1701 Bangladesh
**Leibniz-Institut für Agrartechnik Potsdam-Bornim e. V. (ATB)
Technik der Aufbereitung Lagerung und Konservierung Max-Eyth-Allee 100
14469 Potsdam
Typografische Gestaltung/Layout:
Andrea Gabbert
Herausgegeben vom Leibniz-Institut für Agrartechnik Potsdam-Bornim e.V. (ATB) mit Förderung des Bundesministeriums für Ernährung, Landwirtschaft und Verbraucherschutz und des Ministeriums für Ländliche Entwicklung, Umwelt und Verbraucherschutz des Landes Brandenburg.
Für den Inhalt der Beiträge zeichnen die Autoren verantwortlich.
Eine Weiterveröffentlichung von Teilen ist unter Quellenangabe und mit Zustimmung des Leibniz-Instituts für Agrartechnik Potsdam-Bornim e.V. möglich.
Published by the Leibniz-Institute for Agricultural Engineering Potsdam-Bornim e. V. (ATB) with the support of the Federal Ministry of Consumer Protection, Food and Agriculture as well as of the Ministry of Agriculture, Environment Conservation and Regional Policy of the State Brandenburg.
Contents do not necessarily reflect the publisher or editors views in this area.
No part of the material may be reproduced or utilized in any form or by any means without permission from the publisher Leibniz-Institute for Agricultural Engineering Potsdam-Bornim e. V.
ISSN 0947-7314
© Leibniz-Institut für Agrartechnik Potsdam-Bornim e. V., Potsdam-Bornim 2007
ACKNOWLEDGEMENTS
I would like to extend my deepest appreciation to my hosts Professor Dr.-Ing. Klaus Gottschalk, Department of Postharvest Technology and Prof. Dr. agr. habil Reiner Brunsch, Director, Leibniz-Institut für Agrartechnik, Potsdam-Bornim e.V. ATB for their valuable suggestions and timely support throughout the entire period of this research as well as in preparing this report.
Acknowledgement is made to Professor Dr.-Ing. habil Christian Fürll, Head, Department of Postharvest Technology for use of laboratory facility and administering of my fellowship.
Special thanks are due to Mrs. Dr. rer. nat. Christine Idler (Microbiology and Molecular Biology), Mrs. Dipl.-Ing. (FH) G. Rehde (Analytical Chemistry) and Mrs. Dr. rer. nat. Karin Hassenberg (Microbiology) for providing working facility and technical support in chemical and microbiological analyses. Thanks go to the technical staffs of the Postharvest Tech- nology Department, esp. Mr. Burkhardt Röhnke for help of constructing the dryer and Mrs.
Jutta Sujata for their various assistances to assemble electronic equipments. To Mr. Baher Amer is given thanks for allowing me to use his solar collector unit.
The author is obliged to Bangladesh Agricultural Research Institute (BARI) authority for permission to pursue the fellowship and allowing leave on deputation for completing this work. I would like to acknowledge to Alexander von Humboldt Foundation for providing me the Georg Forster Fellowship at Leibniz-Institut für Agrartechnik, Potsdam-Bornim e.V.
ATB, Germany.
I would like to express my sincere appreciation to my beloved wife Nila, sons Kafi and Shafi and daughter Taki for enduring much neglect, and for their encouragement, moral support and constant prayers to almighty Allah for my success.
Dr. Md. Ayub Hossain
Table of contents
PREFACE...9
SUMMARY AND RECOMMENDATION...11
INTRODUCTION ... 13
OBJECTIVES...15
CHAPTER 1 DETERMINATION OF RIPENESS OF TOMATO BY COLOUR AND FIRMNESS ... 16
ABSTRACT... 16
INTRODUCTION ... 17
MATERIALS AND METHODS ...18
Sample Preparation ...18
Determination of Firmness ...18
Determination of Colour ...19
RESULTS AND DISCUSSION...20
Firmness ...20
Colour ...21
CONCLUSIONS ... 26
CHAPTER 2 DETERMINATION OF OPTIMUM CONDITIONS FOR HALF FRUIT DRYING CHARACTERISTICS OF TOMATO... 27
ABSTRACT... 27
INTRODUCTION...28
MATERIALS AND METHODS ...28
Laboratory Dryer...28
Determination of Shrinkage...30
Single Layer Drying Experiment...30
Data Analysis and Model Development...31
Moisture Diffusivity and Activation Energy...32
RESULTS AND DISCUSSION...33
Effect of Temperature ...33
Effect of Air Velocity ...34
Effect of Ripeness ...35
Optimisation of Drying Conditions...36
Air Temperature and Tomato Temperature ...36
Shrinkage ...38
Fitting of Experimental Data to the Models ...40
Development of models...43
Moisture Diffusivity and Activation Energy...45
CONCLUSIONS...46
NOMENCLATURE...47
Chapter 3 DESIGN AND EVALUATION OF AN INDIRECT SOLAR DRIER FOR TOMATO...48
ABSTRACT...48
INTRODUCTION ... 49
MATERIALS AND METHODS ...51
Solar Collector ...51
Heat Storage Unit ...52
Drying Unit ...52
Experimental Procedure...56
Pre-treatment...59
Efficiency Calculation ...59
Chemical Analysis ...60
Statistical analysis ...62
RESULTS AND DISCUSSION...62
Collector Performance...62
Drier Performance ...69
Quality of Fresh and Dried Tomato...80
Effect of Pre-treatments...82
CONCLUSIONS ... 85
NOMENCLATURE...86
Chapter 4
MATHEMATICAL MODELLING FOR SOLAR DRYING OF TOMATO...88
ABSTRACT... 88
INTRODUCTION ... 89
METHODOLOGY ... 90
Analysis of Collector Performance ...90
Efficiency of the Collector ...95
Analysis of Solar Drier Performance...95
Solution Procedure ...101
RESULTS AND DISCUSSION...102
Collector Performance...102
Drier Performance ...109
Sensitivity Analysis ...118
CONCLUSIONS ... 118
NOMENCLATURE...119
Chapter 5 EFFECT OF STORAGE ON QUALITY OF DRIED TOMATO ... 121
ABSTRACT... 121
INTRODUCTION...122
MATERIALS AND METHODS ... 124
Statistical Analysis ...125
RESULTS AND DISCUSSION... 126
Effect of Pre-treatments...126
Effect of Moisture Content and Environment ...133
Effect of Storage Container ... 144
CONCLUSIONS ... 151
NOMENCLATURE...151
REFERENCES ... 152
LIST OF FIGURES...157
LIST OF TABLES ...161
APPENDICES ... 164
In der Reihe Bornimer Agrartechnische Berichte erschienen: ... 170
PREFACE
Dried tomatoes are a well known food in the Mediterranean area and becoming popular also in the northern hemisphere of Europe where there is remarkable increase in the de- mands for that type of food. There, dried tomatoes have got a status of an additional food for snacks or for preparing salsa for pasta or gravy etc. Also, these food products with high quality standard are becoming gradually important in other regions of the world, such as Africa and Asia.
Drying is one of the oldest forms for preservation of food. For the natural method of drying, the fruits are simply placed in the sun, to remove slowly the moisture from the fresh fruit down to the final moisture content which makes the fruit suitable for preservation and long term storage. The moisture content of the fruit should be below 20% (w.b.) for save pres- ervation. But good quality results for natural sun dried fruits can only be achieved under warm and sunny climate with windy and dry air conditions. Thus, the simple method of open air sun drying may be suitable for countries with a stable hot and dry climate to se- cure a high quality of the final dried product.
However, the problem of achieving the desired high quality of dried product make the natural air-drying method unsuitable in the tropical or sub-tropical countries. Risk of infec- tion of pests (insects) and development of mould during drying is a big problem in these countries. In countries of moderate climate as in Middle and Northern Europe the natural sun drying method is not suitable due to unstable weather conditions with fluctuations be- tween warm and cold and, dry and humid days. Besides, natural drying is not the ade- quate method for high level industrial production of dried fruits with desired high uniform quality standard. In both the Mid-European and (sub-) tropical areas, usage of forced con- vection drying systems with external heating is more appropriate but energy consuming and thus impacting the environment.
Natural sun drying is mostly not recommendable for tropical or sub-tropical countries with hot but humid air conditions. For these countries a hybrid solar dryer system will be more appropriate to produce high quality dried products especially from fresh high moisture fruits like tomatoes.
To test the performance of a solar drying system, drying experiments were performed in the summer seasons of 2005/2006 in Potsdam, Germany. Occasionally during these peri- ods, desired weather conditions were found for solar supported drying, because the sum- mer seasons these years had sufficient numbers of consecutive sunny, warm, and dry days to carry out experiments successfully for drying tomato halves. Also, during these experiments, there were noticeable mould developments when drying during night times or cloudy days. To overcome these problems, pre-treatment methods were developed and these are extensively discussed in this report.
The report is divided into five chapters each with a distinct subject and concluding re- marks. In chapter 1, the determination of ripeness, using the colorimeter is described.
Also briefly, the mechanical method for the determination of firmness and its correlation to
the ripeness is discussed. The optimal conditions for drying of tomatoes are elaborated in chapter 2. Half fruit drying is more recommended than drying slices or pieces. The optimal drying conditions are depicted there. Several drying models for thin layer drying of half tomato fruits are applied and analysed for the capability to predict the drying process. The models are compared and discussed in this chapter.
In chapter 3, the hybrid solar drying system is described and its performance discussed.
Such type of dryer is well suited for small-scale farmers in tropical countries, but its per- formance could also be verified even under Mid-European climatic conditions. A specific feature of this dryer is its patent easy-to-use concept with modularity and adaptability, which gives good flexibility.
A mathematical model for the performance of the hybrid solar dryer was developed and is presented in chapter 4. The model was validated for its capability for providing design data of a solar drier.
The effects of storage environments and chemical pre-treatments on the conditions and bio-chemical changes of the final dried products are discussed in chapter 5.
This report finally concludes with a summary and recommendations for indirect drying of tomatoes and appropriate storage of the dried tomato halves derived from the research in Potsdam using the hybrid solar drying system.
The reader will find a concluding work with all relevant aspects about drying of tomato halves. The drying system described here in conjunction with the description of the devel- oped methods for pre-treatment of the fresh fruits and the analysis of the drying process resulted in a model. The model depicts a dryer prototype for many kinds of fruits, herbs, vegetable, and fish which can be afforded and easily operated by small holders and farm- ers in developing countries.
The project was accomplished with support of the Alexander von Humboldt-Stiftung in 2005 and 2006. For funding of this research fellowship, the editors express their deep gratitude.
K. G., Potsdam-Bornim, March 2007.
SUMMARY AND RECOMMENDATION
The following recommendations are made based on the findings of various experiments and mathematical model as described in Chapters 1 to 5.
1. Surface colour and firmness have been identified as two important parameters to de- termine the ripeness of tomato. From red colour value (+a*) +12 to +22 was found the range of optimum ripeness. Below the red colour value +12 may be under ripe and above +22 may be over ripe tomato. The rupture stress of optimum ripe tomato was found to be 12 to 22 N/mm2. Above rupture stress 22 N/mm2 the tomato may be classified as unripe and below the rupture stress 12 N/mm2 the tomato be over ripe.
2. Tomato should be dried at air temperature of 45°C or above. Below the drying tempera- ture of 45°C, tomato may be infected by micro-organisms (mould and fungus) during drying if no pre-treatment is applied. Optimum ripe half fruit tomato may be dried at an air temperature of 55°C and air velocity of 0.75 m/s to increase drying rate, to decrease shrinkage and to preserve better colour and lycopene. MIDILLI et al. (2002) model may be recommended to describe the single layer drying of tomato.
3. Thermal efficiency of solar collector may be increase about 10% using flat plate reflec- tor. If tomato is dried with continuous air temperature of 45°C or above then no pre- treatment is required. If drying air temperature decreases below 45°C, then tomato should be pre-treated with 8 g/l sodium metabisulphite to prevent the microbial growth.
Indirect solar drying produce a better quality of dried products in terms of colour, ascor- bic acid, lycopene, total flavonoids, and rehydration ratio. The proposed solar drier may be recommend to dry fruits and vegetables for small holders in the developing countries after slight modification (for cost reduction).
4. The proposed mathematical model was tested for solar drying of tomato in day time and found good agreements between simulated and experimental data. Night time drying would be included in this model to predict whole drying time temperatures and moisture contents. Then, the model can be used for providing design data of a solar drying of fruits and vegetables.
5. After five months of storage of tomato in room (average temperature 20°C and rela- tive humidity 60%) and cool chamber (average temperature 5°C and relative humidity 80%) colour and nutrients reduced about 50% and it is better than the commercial dried tomato available in European market. No visible micro-organisms (moulds and fungus) were detected in any of the samples during the storage period. It may be recommended to dry tomato halves with sodium metabisulphite pre-treatment (8 g/l) up to the final moisture content of 20% (wb) and store them in cool chamber (5-8°C) in glass container in dark place for better colour and antioxidants retention and main- tenance of product moisture content.
INTRODUCTION
Tomato (Lycopersicon esculentum Mill.) is one of the most important vegetables and cash crop in the world, not only because of the volume of production but also because of its contribution to nutrition. Tomato is used in several forms and is widely used as a food in- gredient. More than 80% of tomatoes are consumed in the form of processed products such as juice, paste, puree, ketchup, sauce etc. (KALOO 1993). In recent years the com- mercial importance of dried tomato has been increasing, since they can be used a com- ponent of several foods such as pizza. Epidemiological studies have shown that the con- sumption of tomato and tomato-based products can help to prevent various forms of can- cers, especially prostate cancer and heart diseases (GIOVANNUCCI 1999, RAO &AGARWAL
2000, GEORGE et al. 2001). Demand for ready-to-use products, which have similar health benefits to the original raw products, has also increased in recent years (DEWANTO et al.
2002). Due to changing life styles especially in developed countries, there is now a great demand for a wide variety of dried food products with emphasis on high quality (NIJHUIS et al. 1996). In the tropical region tomato is a seasonal crop and hence there is surplus in one season and shortage in another. Each year a large quantity of tomato is being spoiled due to lack of proper processing and preservation facilities. These vegetables are highly perishable but have high nutritive value, ripen altogether within a short duration. A large quantity (20-50%) of tomato perishes during the harvesting season when the supply is abundant (DESAI et al. 1999). As a result, price of tomato falls drastically and producers cannot even get a return on their production cost. But the price of dried tomato always re- mains high even at the harvesting season. There is an increasing interest in dried tomato in the international market. The amount of tomato, which is being spoiled, can be mini- mized and value added by proper drying of freshly harvested product.
In Bangladesh small farmers in the rural areas usually produce vegetables. They do not have enough money to buy a modern drier or freezer to preserve the products. Therefore, one approach is to develop a package of solar drying systems for tomatoes as a means to help small producers to preserve their products from spoilage and seasonal low sale price.
This will even out seasonal supply of the product by drying the excess production at har- vest for sale out of season. Thus, they will be economically benefited with a small capital investment. There is also a benefit to be gained by improving the nutritional quality of peo- ples diet out of season. Dried tomato could also form a continuous input to processing in- dustries and this could lead to new packaged products such as sauces and snack foods.
This product can also be sold in the international market to earn foreign currency.
Bangladesh is a tropical country characterized by hot and humid weather. The climatic condition dictates the need of more effective drying of vegetables. Drying of vegetables in Bangladesh is normally carried out by traditional sun drying method. Although sun drying offers a cheap and easy method of drying but the drying rate is very slow and it often results inferior quality due to dependence of weather conditions and vulnerability to the attack and contaminated with insects, pests, micro-organisms, dust, and dirt. Fruits and vegetables are high moisture crops and take long times (5-15 days) for drying. Some
times adverse weather exits and the products are infected by insects and micro-organisms and these infected produced are serious health hazards- not fit for human consumption. If continuous adverse weather exits for a couple of days together then the whole amount of products are spoiled. This creates serious negative economic impact on the farmers or processors to continue their further activities. Therefore, an effective attempt has to be taken to preserve the food losses, especially during the adverse weather conditions.
Fruits and vegetables have special morphological features quite distinct from other agricul- tural materials used as food that greatly influence their behaviour during processing and preservation especially by drying (JAYARAMAN & DAS GUPTA 1992). Over the last few years fresh tomato and tomato products, due to their antioxidant activity, have aroused new sci- entific interest. Tomato components include lycopene, ascorbic acid, flavonoids and other related compounds with an antioxidant activity (GIOVANELLI et al. 2002). Dried tomato, be- ing commonly dried at high temperatures in the presence of oxygen, shows the highest sensitivity of oxidative heat damage. With regard to the nutrition of processed tomato, food processors are very concern about the antioxidant activity of tomato products, with particu- lar attention to the fate of lycopene. Fresh tomato contains high moisture content (about 95%, wb) and is very susceptible to disease and insect attack. Tomato is also very sensi- tive to drying air conditions (temperature, relative humidity etc.). If it is dried at higher air temperature then most of its nutrients (colour, lycopene, ascorbic acid, total flavonoids etc.) deteriorate and also affected by case hardening and if it is dried at a lower tempera- ture then it is infected by micro-organisms. Hence, an optimum drying air temperature range should be selected to prevent nutrient losses as well as the microbial infections.
The technology used in industrialised countries and large industries in developing coun- tries is neither technically or economically feasible for smallholders. In these countries so- lar drying is the most suitable method of preservation of vegetables by small farmers who produce more than 80% of food (ESPER &MÜHLBAUER 1998). Solar energy is a renewable source of energy and environment friendly. All the areas of Bangladesh receive abundant solar radiation almost all round the year. Solar drying of crop is economically viable in the developing countries due to low initial and operating cost. Solar drying is not simply an energy consuming process but a process for producing high quality products. The type of drier used and the way in which it is operated has a significant influence on the quality of the product. Solar drying system must be properly designed in order to meet particular drying requirements of specific crops and to give satisfactory performance with respect to energy requirements. Designers should investigate the basic parameters namely dimen- sions, temperature, relative humidity, airflow rate and quality and the characteristics of the product to be dried. However, full scale experiments for different products, drying season and system configuration is costly, time consuming and sometimes may not be possible.
Simulation model enables the researcher to evaluate the performance of the solar drier before actual production of the prototype and experiment is done. The development of a mathematical model is a powerful tool for prediction of performance of solar drying system at various operating conditions without having to test experimentally at each operating
condition (BALA &WOODS 1994). Again, simulation of solar drying is essential to optimize the dimensions of the solar drying system and optimization technique can be used for op- timal design of solar drier for production of high quality dried products.
This study will also cope with the international concerns of promoting high quality and standards in foods and development of clean and efficient technologies. In order to ensure continuous food supply to the growing population and enable small farmers to produce high quality marketable products, this study will help for the development of efficient drying methods suitable for the rural farmers of developing countries. This study will lead to a significance increase of the value of the dried products; reduce the risk of spoilage, thus resulting in higher income per unit. It will help the establishment of small-scale vegetables drying industry in the developing countries where about 80% people live. This will eventu- ally lead to higher profit and thus will generate one of the income-earning sources of the rural poor and ultimately alleviate the rural poverty through participation of the rural women in solar drying of tomato. Hence such a piece of research has a great economic potential for developing countries in the tropics and subtropics.
A systematic research on the solar drying of tomato with both experimental investigation and mathematical modelling has not been reported in the literature. Therefore, the present study will cover experimental and theoretical aspects of solar drying of tomato including its quality and shelf life that will contribute to the knowledge on quality dried products for local consumption as well as exports to foreign countries. This research will also generate sci- entific information useful for academics, researchers, processors and other users.
OBJECTIVES
The specific objectives of the study are:
1. To study the drying behaviour and properties of tomato
2. To perform single layer drying experiments in a laboratory drier at different air con- ditions and develop single layer drying models
3. To design, construct and test a small-scale solar drier prototype for drying of tomato 4. To develop a mathematical model to simulate forced convection solar drying of to-
mato
5. To investigate the quality of the dried tomato with international standard.
6. To investigate the shelf life of dried tomato
Chapter 1
DETERMINATION OF RIPENESS OF TOMATO BY COLOUR AND FIRMNESS
ABSTRACT
The ripeness of tomato was determined by surface colour and firmness. The selected to- mato was Roma variety of medium size (average diameter 58.7 mm) and weight (average weight 124.6 g) according to the classification of USDA (1991). Colour was measured by chromameter and expressed colours in numerical terms along the L* (from white to black), a* (from red to green) and b* (from blue to yellow) axes within the CIELAB colour sphere which were mathematically combined to calculate the hue angle, chroma, colour index and colour difference. Firmness was determined by penetrometer and rupture stress versus deformation curves were recorded. The rupture stress of optimum ripe tomato was found to be 12 to 22 N/mm2. Above rupture stress, 22 N/mm2 the tomato may be classified as unripe and below the rupture stress 12 N/mm2 the tomato be over ripe. Significant differ- ences were found among under, optimum and over ripe tomatoes for the colour parame- ters a*, b*, a*/b*, (a*/b*)2, hue angle, colour index and colour difference. The colour value a*, a*/b*, (a*/b*)2 and colour index increased with the ripeness but L*, b*, hue angle and colour difference decreased with the ripeness. Good correlations (R2 ≥ 0.90) were found between rupture stress and a*, b*, hue angle, colour index and colour difference. There- fore these parameters may be considered as good colour parameters to measure the col- our of tomato. Firmness or rupture stress decreased linearly as red colour value +a* in- creased. From red colour value (+a*) +12 to +22 was found the range of optimum ripe- ness. Below the red colour value +12 may be under ripe and above +22 may be over ripe tomato.
INTRODUCTION
Tomato (Lycopersicun esculentum Mill.) is one of the most important vegetables and cash crop in the world, not only because of the volume of production but also because of its contribution to nutrition (KALOO 1993). Tomato is used in several forms and is widely used as a food ingredient. It is rich in nutrient compounds including vitamin C, flavonoids and carotenoids, which are beneficial for human health (WOLD et al. 2004). Many nutrients con- tent depend on the ripeness of fruits. For example, lycopene and β-carotine comprises about 78 and 7% respectively of the total carotenoid content, which depends mainly on the red colour of the fruit (RAO et al. 1998). Ripeness is very important factor for harvesting, transportation, marketing, processing, consumption, taste and nutrient content of tomato.
Tomato fruits are harvested in different ripening stages depending on the marketing and consumers requirements. It reflects the consumers’ acceptance as well as market price.
Consumers first test the ripeness of tomato by colour with visual observation and then test the firmness with finger pressing and try to find out the optimum ripe tomato. They do not go for complex scientific measurements. Consumers classify the tomato mainly in three categories optimum ripe, unripe and over ripe.
Tomatoes are classified into six ripeness stages based on external colour reflecting human ability to differentiate ripeness by USDA (1991). These are green (100% green colour), breaker (less than 10% of surface is not green), turning (10 to 30% of surface is not green), pink (30 to 60% of surface is not green), light red (60 to 90% of surface is not green) and red (more than 90% surface is not green or more than 90% of surface is red). The USDA colour classification is widely used for tomato fruits. However, for gen- eral producer or consumer these six stages of classification create complexity during grading or purchasing tomatoes. Some European countries have established 10 or even more colour stages, but an average consumers have trouble in finding differences among them (LOPEZ CAMELO &GOMEZ 2004).
Human identification of colour is quite complex where sensation like brightness, inten- sity, lightness, vividness etc. modifies the perception of the primary colour (red, blue and yellow) and their combinations. Although some colour charts were available, the introduction of the NORM colour system in 1931 by the CIE (Commission Internationale de I’Éclairage) made it possible to express colour in exact quantitative and numerical terms. An improvement of this system was developed in 1976 by CIELAB (colour space system) which defines colour better related to human perception where all conceivable colours can be located within the colour sphere defined by three perpendicular axes: L*
(from white to black), a* (from green to red) and b* (from blue to yellow) (HEIDELBERG
1999). SHEWFELT et al. (1988) stated that human and colorimeter measure colour in dif- ferent ways. Human sees colours in terms of lightness, hue and chroma by integrating complex perceptions. But colorimeter are capable of measuring pure colours of L*, a*
and b* in the absence of the others.
Although colour is a good indicator of fruit maturity but colour parameters do not provide a reliable ripeness determination (DE JAGOR &ROELOFS 1996). In contrast, the ripeness of tomato may be determined in terms of firmness. Firmness is an important character of fruits and vegetables to determine ripeness. Different rapid and non-destructive methods have been developed to describe the firmness characteristics of fruits and vegetables such as initial slope of stress deformation curve, coefficient of elasticity, acoustic stiffness coefficient, impact stiffness coefficient, and rupture stress (FEKETE & FELFÖLDI 2001).
Therefore, this study has been undertaken to determine the ripeness of tomato in terms of colour and firmness and to classify them in limited categories so that average consumers (especially for developing countries) can identify them easily.
MATERIALS AND METHODS Sample Preparation
The fresh tomato of Roma variety (origin: The Netherlands) was selected for this study.
First tomatoes were classified into three ripeness groups testing them by colour with visual observation and by firmness with finger pressing. Before conducting of experiments, total 75 (25 under ripe, 25 optimum ripe and 25 over ripe) uniform size and shape of fresh to- mato were procured from a supermarket at Potsdam, Germany. These tomatoes were washed with normal water, wiped and stored them at 7 to 10°C and used within two weeks of purchase (LANA et al. 2005). The diameter of each tomato was measured with slide cal- liper and mass was weighed with an electronic balance. The average diameter and mass of each tomato were found to be 58.2 mm and 124.6 g respectively. The selected tomato was medium size (diameter; D: 57.2 ≤ D ≤ 64.3 mm) and weight (weight, W: 99.4 ≤ W ≤ 256.0 g) according to the classification of USDA (1991). The initial moisture content of fresh tomato was determined by gravimetric method (AOAC, 1975) and found to be 94 to 95% (wet basis).
Determination of Firmness
Compression tests of tomato were performed using a ‘Zwick’ Universal Testing Machine (type: BZ2.5/TS1S, Germany, Figure 1.8) with a 60 mm width flat plate probe was pressed on the full tomato with a constant speed of 2 mm/min. The force and deformation were recorded during the test. The deformation was calculated for 10 to 30% range of the rupture stress (FEKETE &FELFÖLDI 2001) and the slope of the curve determined by regres- sion analysis. Four readings were taken at four places on the surface of each tomato and then the mean value was calculated. From the results the rupture stress and the slope of the stress/deformation curve were determined. Then the ripeness was estimated from the rupture stress and the slope of the stress/deformation curve for different groups of toma- toes.
Determination of Colour
The colour of fresh and dried tomato surface was measured by a Minolta CR-300 Chro- mameter (Minolta Co., Japan) in L* (from white to black), a* (from green to red) and b*
(from blue to yellow) chromaticity coordinates (Figure 1.1) using a Hunterlab colour differ- ence meter. The colour was measured using CIELAB scale at D65 (Daylight–Neutral) il- luminant. The instrument was standardized each time with a white ceramic plate. Four readings were taken at four places on the surface of each tomato and then the mean val- ues of L*, a* and b* were calculated. The different colour parameters were calculated us- ing the following equations (LOPEZ CAMELO &GOMEZ 2004).
Hue angle = tan-1(b*/a*) (1.1)
Chroma = (a*2+b*2)1/2 (1.2)
Colour index = 2000 a*/{L*(a*2+b*2)1/2} (1.3) Colour difference = {(L*-50)2+ (a*-60)2+b*2}1/2 (1.4)
Figure 1.1: The CIELAB colour space system (LOPEZ CAMELO &GOMEZ 2004)
Also, the values of L*, a*, b*, a*/b* and (a*/b*)2 were calculated and the individual values from equation (1.1-1.4) were plotted and analysis of variance (ANOVA) was performed and compared the means by Duncan’s multiple range test (DMRT) using software SPSS 9.0.
Black
+b* Yellow +a* Red L* White
-b* Blue
-a* Green
Black
+b* Yellow +a* Red L* White
-b* Blue
-a* Green
RESULTS AND DISCUSSION Firmness
The firmness was determined by universal compression testing machine and curves were obtained for rupture stress and deformation as shown in Figure 1.2. For maximum stress, the slope of the curve was estimated. Then the slope versus rupture stress was plotted and a trend of the curve was obtained and a good fit was found at R2 = 0.91 (Figure 1.3). It is observed from the Figure that firmness decreased with the ripeness. It is also observed that three sets of data were bounded to the straight line. Three clusters of data represent three stages of ripeness. FEKETE et al. (2000) found similar sets of data for different ripeness of tomato. The upper bounded data may be classified as un- ripe, middle bounded data as optimum ripe and lower bounded data were over ripe to- matoes. For about 3 mm deformation, the rupture stress of optimum ripe tomato was found to be 12 to 22 N/mm2. Above rupture stress, 22 N/mm2 the tomato may be classi- fied as unripe and below the rupture stress of 12 N/mm2 the tomato be over ripe. There- fore, rupture stress can be accepted as a good characteristic of the firmness as well as the ripeness of tomato. FEKETE & FELFOLDI (2001) reported that the rupture stress and stress/deformation curve is a suitable characteristic for tomato ripeness evaluation.
They also reported that rupture stress could be accepted as the best method for deter- mination of firmness as well as ripeness of tomato.
10.00 15.00 20.00 25.00
2.00 3.00 4.00
Deformation, mm
Rupture stress, N/mm2
Figure 1.2: Rupture stress versus deformation curve
0 2 4 6 8 10
5.00 10.00 15.00 20.00 25.00 30.00
Rupture stress, N/mm2 Slope, N/mm2 -mm
Figure 1.3: Slope versus rupture stress of tomato
Colour
Corresponding to the firmness, the colour L*, a* and b* values were measured with chromameter and plotted the colour values against number of observations as shown in Figure 1.4. Each observation was a mean of four measurements at four places of the surface of a tomato. It is observed from the Figure that three ripeness stages indicated three distinct groups of data. The highest L* and b* but the lowest a* values were ob- served for under ripe tomato. For under ripe tomato groups, some tomato were green in colour that represented negative values of a* (-a*) and some tomatoes were red in col- our with positive but lower a* (+a*) values. Therefore, all tomato with red colours is not essentially ripe. For optimum ripe tomatoes, a* values increased and subsequently L*
and b* decreased. But the reduction of L* values were found to be higher than b* val- ues. The reason might be that when ripeness progress then red colour pigments syn- thesized, L* decreased rapidly to make the red colour darker (deep red). Some re- searchers (LOPEZ CAMELO & GOMEZ 1998 and 2004, ARIAS et al. 2000) showed that b*
values changed little during ripening stages.
This may be related to the fact that ζ-carotenes (pale-yellow colour) reach their highest concentration before full ripening, where lycopene (red colour) and β-carotene (orange colour) achieve their peaks (CHOI et al. 1995). For over ripe stage, the a* values in- creased more and subsequently L* and b* values reduced further. But the degree of reduction of L* and b* values were opposite to optimum ripeness stage. In this case the
degree of reduction of b* values were higher than those of L* values. The reason might be that in over ripe stage all chlorophyll degraded and lycopine synthesized (LOPEZ
CAMELO &GOMEZ 2004). As a result, a* values increased and b* values decreased.
-20 -10 0 10 20 30 40 50 60 70
0 5 10 15 20 25 30 35
Number of observations
Chromaticity scale (L*,a*,b*)
Under L*
Under a*
Under b*
Optimum L*
Optimum a*
Optimum b*
Over L*
Over a*
Over b*
Figure 1.4: L*, a* and b* values at different ripeness stages
The mean values of different colour parameters were calculated for different ripeness stages and presented in Table 1.1. Also the mean values of colour parameters were sta- tistically analysed and compared by Duncan’s multiple range test (DMRT) at different ripe- ness stages. The calculated colour parameters indicated that the differences in a*, b*, a*/b*, (a*/b*)2, hue angle, colour index and colour difference among under, optimum and over ripe tomatoes were significantly differences from each other. For L* value, there was significant difference from under and optimum ripe but the differences between optimum and over ripe were found to be insignificant. There was no significant difference of chroma between under and optimum ripe but for over ripe tomato the chroma was significantly higher than for both under and optimum ripe tomatoes. The colour values of a*, a*/b*, (a*/b*)2 and colour index increased with the ripeness. On the other hand, L*, b*, hue angle and colour difference decreased with the ripeness. This is due to that colour changed dur- ing tomato ripening were the result of L*, a* and b* but a* is the most dominant colour fol- lowed by b*, related to chlorophyll degradation and lycopene synthesis to indicate the pro- gress in ripening of tomato.
Table 1.1: Colour parameters of tomato at different ripeness stages
Ripeness L* a* b* a*/b* (a*/b*)2 Hue
angle Chroma Colour index
Colour difference Under 51.86a -2.96c 20.76a 0.44c 1.31bc 63.71a 26.65b -8.67c 72.37a Optimum 38.72b 19.47b 15.93b 1.28b 1.68b 32.80b 25.50b 40.30b 44.82b Over 32.69b 25.26a 9.86c 2.69a 7.64a 8.70c 27.92a 57.56a 39.62c
Values with the same letter in the same column are not significantly different at 5% level by DMRT.
The coefficient of determination between firmness (rupture stress) and different colour pa- rameters were calculated and are given in Table 1.2. Higher coefficients of determination (R2 ≥ 0.90) were found for a*, b*, hue angle, colour index and colour difference. So, The best fit were found between rupture stress and a*, b*, hue angle, colour index and colour difference. Coefficients of determination for L* and a*/b* was reasonably good (0.80 < R2 < 0.90). Hence, an acceptable fit was found between rupture stress and L* and a*/b*. But for (a*/b*)2 and chroma, the coefficient of determination was insignificant (R2 < 0.80).
Table 1.2: Coefficient of determination (R2) of rupture stress and different colour parameters Ripeness L* a* b* a*/b* (a*/b*)2 Hue
angle Chroma Colour index
Colour difference Under 0.81 0.92 0.90 0.82 0.74 0.97 0.73 0.93 0.93 Optimum 0.83 0.95 0.92 0.80 0.72 0.93 0.79 0.94 0.96
Over 0.79 0.94 0.92 0.83 0.85 0.91 0.78 0.95 0.97
However, most of the tomato literature mainly express colour changes in terms of different mathematical combinations of a* and b* on the chromatic equatorial plane. Some re- searchers (HAHN 2002, SACILIK et al. 2006) have used only a* values while others (YANG &
CHINNAN 1987, MCDONALD et al. 1999, Zanoni et al. 1999) have used a*/b* relationship to represent the ripeness of tomato. This ratio has been also used to develop mathematical models in order to express colour changes at different temperatures. Hue angle is another parameter that has been widely used to express tomato colour changes (THAI et al. 1990, CHOI et al. 1995).
Since, rupture stress is assumed the accepted and best characteristic to measure the firmness as well as the ripeness of tomato (FEKETE & FELFÖLDI 2001), therefore a*, hue angle, colour index and colour difference are the good colour parameters to measure the colour of tomato. Among them hue angle, colour index and colour difference are complex to calculate and not easily understandable by the common people. The colour parameter
a* is directly measurable by colorimeter or chromameter and also easy to understand by the common people. For example, if the value of a* is negative (-a*), the tomato is green or unripe. If the value of a* is positive (+a*), the tomato is red and ripe. But all red toma- toes are not essentially ripe. They may physiologically mature but for consumer’s accep- tance they are not ripe. Then the under ripe, optimum ripe and over ripe tomatoes can be differentiated by the firmness of tomato. Other words, the rupture stress or firmness can be estimated from the red colour value (a*). The following regression equations were de- veloped for under ripe, optimum ripe and over ripe tomatoes in terms of red-green colour (a*) and firmness or rupture stress (F, N/mm2). The regression curves for under ripe, opti- mum ripe and over ripe tomatoes are shown in Figures 1.5, 1.6 and 1.7 respectively. It is observed from the regression equations and regression curves that firmness or rupture stress decreased linearly as colour value a* increased i.e. the firmness of tomato de- creased as ripeness increased.
Funder = 15. 372-0.4473a* (R2= 0.92) (1.5)
Foptimum = 56.331-2.014a* (R2= 0.95) (1.6)
Fover= 93.380-3.0291a* (R2= 0.94) (1.7)
It has been observed from the Figs. (Figs. 1.5, 1.6 and 1.7) that from red colour value (+a*) +12 to +22 were the range of optimum ripeness of tomato. Below the red colour value +12, tomato may be under ripe and above the red colour value +22, tomato may be classified as over ripe.
R2 = 0.9164
0 5 10 15 20 25
-15 -10 -5 0 5 10 15
Colour value (a*) Rupture stess (N/mm2 )
Figure 1.5: Rupture stress versus red chromaticity (a*) for under ripe tomato
R2 = 0.9503
0 5 10 15 20 25 30 35
10 15 20 25
Colour value (a*) Rupture stess (N/mm2 )
Figure 1.6: Rupture stress versus red chromaticity (a*) for optimum ripe tomato
R2 = 0.9387
0 5 10 15 20 25 30 35
20 22 24 26 28 30
Colour value (a*) Rupture stress (N/mm2 )
Figure 1.7: Rupture stress versus red chromaticity (a*) for over ripe tomato
Figure 1.8: Compression tests of tomato using a ‘Zwick’ Universal Testing Machine
CONCLUSIONS
The rupture stress of optimum ripe tomato was found to be 12 to 22 N/mm2. Above rupture stress of 22 N/mm2 the tomato may be classified as unripe and below the rupture stress 12 N/mm2 the tomato be over ripe. Rupture stress can be accepted as a good characteris- tic of the firmness as well as the ripeness of tomato. Significant differences were found among under, optimum and over ripe of tomatoes for the colour parameters of a*, b*, a*/b*, (a*/b*)2, hue angle, colour index and colour difference. The colour values of a*, a*/b*, (a*/b*)2 and colour index increased with the ripeness but L*, b*, hue angle and col- our difference decreased with the ripeness. Good correlations (R2= 0.90) were found be- tween rupture stress and the colour parameters a*, b*, hue angle, colour index and colour difference. Therefore these colour parameters are the good measure of colour for tomato.
Firmness or rupture stress decreased linearly as colour value a* increased i.e. the firm- ness of tomato decreased as ripeness increased. From red colour value (+a*) +12 to +22 was found the range of optimum ripeness. Below the colour value of +12, tomato may be under ripe and above +22, may be classified as over ripe tomato.
CHAPTER 2
DETERMINATION OF OPTIMUM CONDITIONS FOR HALF FRUIT DRY- ING CHARACTERISTICS OF TOMATO
ABSTRACT
Drying kinetics of half fruit tomatoes were investigated in a laboratory scale hot air dryer at an air velocity of 0.13 to 1.00 m/s and temperature range of 45 to 65°C to find out the op- timum drying conditions in terms of drying rate and colour. This experiment was conducted at the Leibniz-Institut für Agrartechnik Potsdam-Bornim, during October to December 2005. Drying rate and shrinkage increased significantly with the increase in air tempera- ture. But the value for green-red chromaticity coordinate colour (a*) decreased significantly for increase in air temperature. Drying rate increased with the increase of air velocity up to 0.75 m/s. Above this air velocity, drying rate became independent of air velocity. Effect of air velocity was found insignificant on colour and shrinkage. The optimum drying air condi- tions was the temperature of 55°C and air velocity of 0.75 m/s, when both drying time and colour were considered. The drying rate of over ripe tomato was found higher than that of optimum ripe and unripe (green) tomato. The effective moisture diffusivity was determined including the shrinkage of tomato during drying and the shape of the half fruit tomato was assumed as slab shape. The effective moisture diffusivity of tomato increased linearly from 9.2×10⁻⁹ to 2.16 ×10⁻⁸ m2/s as drying air temperature increased from 45 to 64°C. The acti- vated energy of tomato was calculated and found to be 37.72 kJ/mol. The experimental data were fitted to six different single layer drying models such as the Lewis, the Page, the Henderson and Pabis, the Two term exponential, the Approximation of Diffusion and MIDILLI et al. (2002) models by nonlinear regression method. Among the selected models the MIDILLI et al. (2002) model was found the best to predict the moisture content of tomato at different drying air conditions. Hence, optimum ripe half fruit tomato may be dried at an air temperature of 55°C and air velocity of 0.75 m/s and MIDILLI et al. (2002) model may be recommended to describe the single layer drying of tomato.
INTRODUCTION
Drying of tomato is carried out by open sun drying, solar drying or mechanical drying.
Therefore, it is important to know the drying characteristics of tomato. The drying rate of tomato is closely associated with the drying air temperature, relative humidity and air velocity. One of the most important criteria of food is colour. Undesirable changes in the colour of food may lead to a decrease in consumers' acceptance as well as market value. It is essential to dry tomato in a suitable environment to produce a good quality dried products. The efficiency of the drying system can be improved by the analysis of the drying process. Analysis of the drying system can be greatly expedited by using computer simulation. A generalized single layer tomato drying equation is therefore, needed for this purpose. The equation must be suitable for use at any temperature, relative humidity and air velocity of the drying air used in tomato drying.
Investigators developed theoretical, semi-theoretical and empirical equations to express and explain the single layer drying of fruits and vegetables. Several thin layer drying models available in the literature for explaining thin layer drying characteristics of fruits and vegetables have been used by AFZAL &ABE (1999) for potato slices; KARATHANOS &
BELESSIOTIS (1999) for fig; YALDIZ et al. (2001) for sultana grape; DANDAMRONGRAK et al.
(2002) for banana; DOYMAZ &PALA (2002) for red paper; TOGRUL &PEHLIVAN (2003) for apricot and LAHSASNI et al. (2004) for prickly pear peel.
GIOVANELLI et al. (2002) studied the water diffusivity of tomato products at higher temperature (70 to 110°C), suitable for industrial drying. They calculated the apparent diffusivity including shrinkage of tomato products during drying. SACILIK et al. (2006) investigated the thin layer drying characteristics of half fruit organic tomato in solar tunnel drier. They fitted the experimental data to ten thin layer drying models and reported Approximation of diffusion equation was the best fitted model.
An understanding of the characteristics of tomato in terms of drying kinetics is essential for designing, modelling and optimisation of drying systems. Little information is available in the literature on half fruit drying characteristics of tomato in single layer at different air temperature and air velocity without significant loss of colour. Therefore this work has been undertaken to study the half fruit drying kinetics of tomato in single layer, to evaluate the suitability of some thin layer drying models and to optimise the drying parameters in terms of temperature, air velocity and colour.
MATERIALS AND METHODS Laboratory Dryer
The experiments of drying of a single layer half fruit drying of tomato at various air tem- perature and air velocity were conducted in a laboratory scale dryer at the Leibniz- Institut für Agrartechnik, Potsdam-Bornim as shown in Figures. 2.1 and 2.2. The dryer
mainly consisted of a blower, heating unit, plenum chamber, drying chamber, sample container, a digital balance and data logger. A thermostat was used to control the tem- perature in the drying chamber. A controller was used to adjust the air velocity in the drying chamber. A series of sensors was inserted in the drying chamber to measure the air temperature and relative humidity. The sensors were connected with a PC via data logger for recording instantaneous data.
Figure 2.1: Schematic view of a laboratory scale single layer dryer
Figure 2.2: Photographic view of a laboratory scale single layer dryer
Determination of Shrinkage
For determination of shrinkage the length, diameter and thickness of half cut tomato were measured by Slide Caliper before and after drying. The diameter and thickness were measured at different places and the average values were calculated. Also the initial and final mass of the tomato half was measured by an electronic balance. Tomato shape is not regular. For our analysis, tomato shape is assumed as elliptical spheroid as shown in Fig- ure 2.3 and the cross-section area and volume of half cut tomato were calculated using the following formula.
Area of cross-section (A) = πcd and volume (V) = 4/3πcd2.
Figure 2.3: Elliptical spheroid shape of tomato
Volume, area and thickness were calculated using following formulas.
i f
s V
V =V (2.1)
i f
s A
A = A (2.2)
i f
s H
H = H (2.3)
Single Layer Drying Experiment
Single layer drying experiments were conducted at 45, 50, 55, 60 and 65°C drying air temperatures and air velocity of 0.13, 0.25, 0.50, 0.75 and 1.00 m/s. Experiments were also conducted on different maturity stages of tomato such as under, optimum and over maturity conditions. Before starting the experiment all equipment was checked very care- fully and was run for the required drying condition until the system had become stable. For each experiment a single half cut fruit with face upward was placed on the sample con- tainer in the drying chamber. Conditioned drying air flowed over and under the surfaces
d
c d
c
and the weights; temperatures and relative humidity were recorded at every ten minutes with a data logger. The data-logging interval was adjusted at 10 minutes. The air off period for data recording was set at 30 seconds. After 9 minutes 30 seconds, the blower was automatically off and the balance became stable and data was recorded in still air in 10 seconds. The initial moisture content of fresh tomato was determined by air oven method (AOAC 1975). Before and after completion of each experiment, the length, width, thick- ness and colour of half fruit tomato were measured. Single layer experimental runs were conducted at 35 and 40°C temperatures. But during drying samples were infected by mi- cro-organisms (mould/fungi). Therefore these data had not been included in this chapter.
Data Analysis and Model Development
Six commonly used thin layer equations (Table 2.1) available in the literature were used to fit the experimental data by the direct least square method using SPSS 9.0 (Statistical Package for Social Science) software. The test of significant was tested by complete ran- domised block design. The static equilibrium moisture content was obtained from the works of HUDA (2003).
Table 2.1: Different models used for experimental data fitting Model
No.
Name of model Model expression
1 Lewis exp( )
0
M kt M
M M
e e
t = −
−
−
2 Henderson and Pabis exp( )
0
kt M a
M M M
e e
t = −
−
−
3 Page exp( )
0
n e
e
t kt
M M
M
M = −
−
−
4 Two term exponential exp( ) (1 )exp( )
0
kat a
kt M a
M M M
e e
t = − + − −
−
−
5 Approximation of diffusion exp( ) (1 )exp( )
0
kbt a
kt M a
M M M
e e
t = − + − −
−
−
6 MIDILLI et al. (2002) a kt bt
M M
M
M n
e e
t = − +
−
− exp( )
0
The equations were evaluated in terms of coefficients of determination (R2) and root mean square errors (RMSE) in the following statistical forms:
( )
∑ ∑ ∑
= 2
pred 2
exp
2 pred 2 exp
M M
M
R M (2.4)
∑
⎟⎟⎠
⎜⎜ ⎞
⎝
⎛ −
= N
1
2 exp pred
df M
RMSE M (2.5)
Residuals of each model were plotted with experimental moisture contents. If residual plots indicate a systematic pattern, the model should not be accepted (CHEN & MOREY 1989, KALEEMULLAH &KAILAPPAN 2004). A model was considered best when the residual plots indicated uniformly scattered points, RMSE at a minimum value and R2 at a maxi- mum value.
Moisture Diffusivity and Activation Energy
Fick’s second law of the unsteady state diffusion, neglecting the effects of temperature and total pressure gradient, can be used to describe the drying behavior of fruits and vegetables
(
DgradM)
t Div M =
∂
∂ (2.6)
This equation can be solved for slab shape of the drying material as follows.
⎟⎟⎠
⎜⎜ ⎞
⎝
⎛ π
−
− −
=π
−
−
∑
∞= 2
e 2 2 1
n 2
2 e o
e t
z t ) D 1 n 2 ( ) exp 1 n 2 (
1 8
M M
M
M (2.7)
Where n is number of order (1, 2, 3,…). For n =1, the Eqn (2.7) becomes
⎟⎠
⎜ ⎞
⎝⎛ π−
=π
−
−
2 e 2 2
e o
e t
z t exp D
8 M M
M
M (2.8)
HAWLADER et al. (1991) proposed that z in Eqn (2.8) should be replaced with a modified thickness z´, related to the mass of sample by the following equation
u
0 t
W W z
z ⎟⎟⎠
⎜⎜ ⎞
⎝
=⎛
′ (2.9)
Where, W0 and Wt are the mass of sample at time zero and t respectively, u is an index is obtained by optimising experimental data from ln((Mt –Me)/(M0–Me)) as a function of t/z’2. Then the Eqn (2.8) for modified thickness was fitted to the experimental data of the half fruit of tomato and the diffusivity can be determined minimizing sum of squares of the de- viations between the predicted and experimental data.
The effective moisture diffusivity can be expressed by simple Arrhenius equation as a function of temperature as follows (LOPEZ et al. 2000).
⎟⎟⎠
⎜⎜ ⎞
⎝
⎛−
=
a a 0
e RT
exp E D
D (2.10)
From Eqn (2.10), activation energy was calculated by non-linear regression analysis.
RESULTS AND DISCUSSION Effect of Temperature
The effect of air temperature on single layer drying of tomato is shown in Figure 2.4. Mois- ture loss increased with an increase in drying air temperature. There is no constant rate period of drying and drying took place only in the falling rate period. Differences of drying time between two consecutive drying temperatures were higher in lower temperature than those of in higher temperature. Time required for drying of tomato sample at 44.91, 51.13, 55.01, 61.06 and 64.30°C temperature were about 101.67, 77.00, 61.00, 56.67 and 45.17 hours respectively.
0 5 10 15 20 25
0 1000 2000 3000 4000 5000 6000 7000
Drying time, min.
Moisture content,kg/kg(db)
T=44.91, RH=14.52 T=51.13, RH=13.42 T=55.01, RH=11.09 T=61.06, RH=9.41 T=64.30, RH=8.92
Figure 2.4: Single layer drying of tomato at different air temperatures (v = 0.50 m/s)
The increase in air temperature to accelerate the drying process was limited by the heat sensitivity of tomato. The effect of drying air temperature on colour of tomato is shown in
Table 2.2. It is observed from the Table that due to drying, the red colour of tomato de- creased significantly from the fresh tomato. This reduction was significant for the air tem- perature of 44.91 and 51.13 and highly significant for the temperature of 55.01, 61.06 and 64.30°C. There was significantly difference of colour after drying among the temperatures but for the temperatures of 51.13 and 55.01°C the colour of dried tomato was statistically alike.
Table 2.2: Variation of colour of dried tomato at different air temperatures
Temperature (°C) Before drying (a*) After drying (a*) Significance level
44.91 23.01 21.51a 5%
51.13 22.14 19.11b 5%
55.01 22.51 17.98b 1%
61.06 22.53 12.87c 1%
64.30 22.11 9.11d 1%
Significance level Not significant 1%
Effect of Air Velocity
The effect of air velocity on the single layer drying of red tomato is given in Figure 2.5. The moisture loss of tomato was faster at the higher air velocity and increased with air velocity.
For an increase of air velocity from 0.12 to 0.75 m/s, the moisture loss of tomato increased but for an increase of air velocity from 0.75 to 1.00 m/s, the drying rate of tomato was al- most constant. Time required for drying of tomato sample at 0.13, 0.25, 0.50, 0.75 and 1.00 m/s air velocity were about 89.83, 84.67, 81.5, 79.5 and 79.00 hours respectively.
Hence, drying rate became independent of air velocities for the air velocity above 0.75 m/s. Air velocity above this value should be avoided to save energy. The effect of air velocity on colour of dried tomato is given in Table 2.3. There is no significant effect of air velocity on the red colour of tomato.
0 2 4 6 8 10 12 14 16 18
0 1000 2000 3000 4000 5000 6000
Drying time (min)
Moisture content, kg/kg (db) v=0.13
v=0.25 v=0.50 v=0.75 v=1.00
Figure 2.5: Single layer drying of tomato at different air velocity (T=50°C, RH=10%)
Table 2.3: Variation of colour of dried tomato at different air velocities
Air velocity (m/s) Before drying (a*) After drying (a*) Significance level
0.13 19.65 18.35 1%
0.25 23.07 17.63 1%
0.50 21.05 18.32 1%
0.75 19.03 18.31 1%
1.00 19.39 17.43 1%
Significance level Not significant Not significant
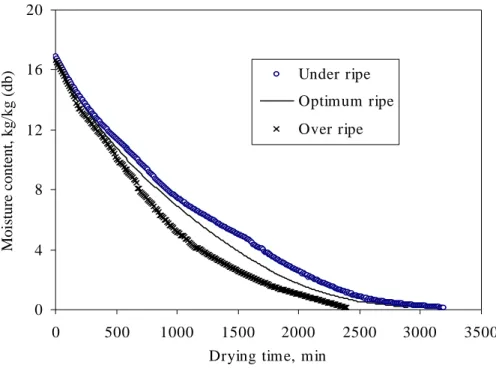
Effect of Ripeness
Effect of ripeness on moisture loss of tomato is given in Figure 2.6. It is observed from the Figure that the over-ripe sample dried faster than the optimum-ripe and under-ripe sam- ples. This may due to that the cell walls and tissues of over-ripe tomato become softer than optimum-ripe and under-ripe samples and hence the moisture diffusivity as well as drying rate became higher. The time required to reach final moisture content (about 15%, db) of over, optimum and under ripe samples were 39.83, 48.17 and 53.16 hours respec- tively.