Azaspiracid Shellfish Poisoning in Irish waters and related bio-optics and oceanographic data
Cruise No. HE 516
17.07.2028 – 15.08.2018, Bremerhaven – Bremerhaven
AZAHAB
AUTHORS
Bernd Krock, Urban Tillmann, Stephan Wietkamp, Daniela Voß, Jochen Wollschläger
Chief Scientist Bernd Krock
Institution AWI
2018
Table of Contents
1 Cruise Summary ... 2
1.1 Summary in English ... 3
1.2 Zusammenfassung ... 3
2 Participants ... 3
2.1 Principal Investigators ... 3
2.2 Scientific Party ... 4
2.3 Participating Institutions ... 4
3 Research Program ... 4
3.1 Description of the Work Area ... 4
3.2 Aims of the Cruise ... 4
3.2 Agenda of the Cruise ... 4
4 Narrative of the Cruise ... 6
5 Preliminary Results ... 8
5.1 Oceanographic and bio-optical parameters ... 8
5.2 Plankton Sampling ... 13
5.3. CTD Measurements and Sampling for Stable Isotopes ... 14
5.4. Molecular Genetics ... 16
6 Station List HE516 ... 21
7 Data and Sample Storage and Availability ... 22
8 Acknowledgements ... 22
9 References ... 22
1 Cruise Summary
1.1 Summary in English
The AZAHAB HE516 survey aboard the R/V Heincke (Helgoland) was conducted during summer 2018 to study the coastal oceanographic processes and mechanisms underlying the dynamics of Amphidomatacean species and the biogeographical distribution of their toxins in the water column. The survey transects were from Bremerhaven, Germany across the southern North Sea and the British Channel with detailed sampling initiated in the Celtic Sea and West Irish coastal waters. From Irish waters the transects continued along the Outer Hebrides and the northern Scottish coast to the North Sea, which again was sampled in more detail. In addition to the primary transect, five transects perpendicular to the coast were performed in along the Irish coast. Standard physical oceanographic parameters (temperature: ˚C, salinity: psu, σt ) plus current velocity were supplemented with bio-optical measurements with multiple profiling fluorometers and various passive optical profilers (for turbidity and diffuse attenuation), including hyperspectral radiometers and microscopic plankton analyses, on-board phycotoxin measurements, and real time polymerase chain reaction (PCR).
Zusammenfassung
Die AZAHAB HE516-Fahrt an Bord der R/V Heincke (Helgoland) wurde im Sommer 2018 durchgeführt, um die ozeanographischen Küstenprozesse und Mechanismen zu untersuchen, die der Dynamik von Amphidomataceen-Arten und der biogeographischen Verteilung ihrer Toxine in der Wassersäule zugrunde liegen. Die Untersuchungstransekte führten von Bremerhaven über die südliche Nordsee und den Ärmelkanal, wobei detaillierte Probenahmen in der Keltischen See und den westirischen Küstengewässern durchgeführt wurden. Von den irischen Gewässern aus wurden die Transekte entlang der Äußeren Hebriden und der nördlichen schottischen Küste bis in die Nordsee fortgesetzt, die ebenfalls detaillierter beprobt wurde. Zusätzlich zum
Haupttransekt wurden fünf Transekte senkrecht zur Küste entlang der irischen Küste
durchgeführt. Physikalische ozeanographische Standardparameter (Temperatur: ˚C, Salzgehalt:
psu, σt ) sowie die Strömungsgeschwindigkeit wurden ergänzt durch biooptische Messungen mit mehreren profilierenden Fluorometern und verschiedenen passiven optischen Profilern (für Trübung und diffuse Dämpfung), einschließlich hyperspektraler Radiometer und
mikroskopischer Planktonanalysen, Phycotoxinmessungen an Bord und Polymerase- Kettenreaktion (PCR) in Echtzeit.
2 Participants
2.1 Principal Investigators
Name Institution
Krock, Bernd, Dr. AWI
Tillmann, Urban, Dr. AWI
Wollschläger, Jochen Dr. ICBM
Voß, Daniela, MSc. ICBM
Kilcoyne, Jane, PhD MI
2.2 Scientific Party
Name Discipline Institution
Krock, Bernd, Dr. Toxinology / Chief Scientist AWI
Tillmann, Urban, Dr. Planktology AWI
Wietkamp, Stephan Molecular Biology AWI
Hintze, Luisa Sample Processing AWI
Krapf, Karina Sample Processing AWI
Wollschläger, Jochen, Dr. Biooptics ICBM
Voß, Daniela Oceanography ICBM
Henkel, Rohan Biooptics ICBM
Schwalfenberg, Kai Oceanography ICBM
Silke, Joe (leg I) Planktology MI
Caroline Cusack (leg I) Biooptics MI
Rafael Gallardo-Salas (leg I) Planktology MI
Kilcoyne, Jane (leg II) Toxinology MI
Hynes, Paula (leg II) Planktology MI
Clarke, Dave (leg II) Molecular Biology MI
2.3 Participating Institutions
AWI Alfred Wegener Institut-Helmholtz-Zentrum für Polar- und Meeresforschung Bremerhaven
ICBM Institut für Chemie und Biologie des Meeres, Oldenburg MI Marine Institute, Galway, Ireland
3 Research Program
3.1 Description of the Work Area
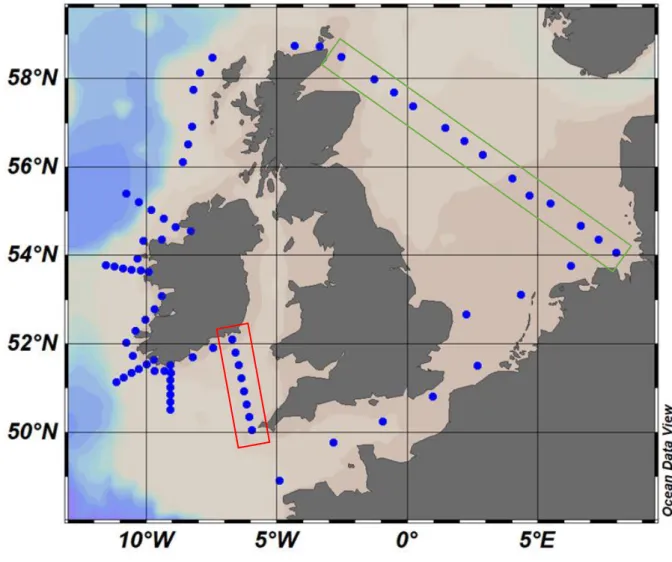
The working area of the cruise comprises the entire cruise transect. This includes the Central and Southern North Sea, the British Channel, the Celtic Sea, the coastal area of the Irish West coast including perpendicular transects, the Northward Eastern and Northern Scottish coasts (Fig. 3.1).
3.2 Aims of the Cruise
In 1995 a new shellfish poisoning syndrome was recorded after eight people in the Netherlands became ill after consumption of mussels from the Irish west coast (McMahon and Silke 1996). A few years a novel group of marine biotoxins designated as “azaspiracid” (AZA) was isolated from shellfish and characterized as lipophilic polyether toxins. Satake et al. (1998) first published the complete structure of AZA-1 and in the subsequent years more AZA were structurally elucidated, but the origin of AZA remained unknown until the marine Ecological Chemistry group of AWI identified a previously undescribed small thecate photoautotrophic dinoflagellate in the plankton by a combination of chemical analysis by on board LC-MS and molecular genomic methods (Krock et al. 2009). In the following years it became evident that the species diversity and toxin
vaiability in this and related genera is very high and they are not only restricted to the North East Atlantic, but have a rather global distribution. (Krock et al. 2012; Tillmann et al. 2012; Krock et al. 2014; Tillmann et al. 2014; Krock et al. 2015; Tillmann et al. 2015; Tillmann et al. 2016).
In addition, it is evident that understanding of plankton dynamics is critically dependent upon knowledge of oceanographic and hydrographic conditions – the so-called “bottom up” processes.
In addition to profiling standard oceanographic parameters (temperature, salinity, current velocity), we have deployed advanced bio-optical sensing systems based upon both passive (absorbance, turbidity, etc.) and active (fluorescence) optical principles to gain insights into the temporal and spatial distribution of biomass, pigments, particulates and coloured dissolved organic matter (CDOM) and its fluorescent component (FDOM). Integration of species abundance and distributional data with oceanographic features combined with optics will assist in the development of models for bloom dynamics of harmful algal species (Krock et al. 2013, Wollschläger et al. 2016, Frank et al. 2016). As light availability in the coastal ocean is closely coupled to its physical, biological and chemical processes and is experiencing changes on all spatial and temporal scales (e.g. Holinde & Zielinski 2016), light is a key parameter for the understanding of associated dynamics, processes and biogeochemical and physical variables. It introduces heat in the upper ocean layer and drives primary production and light changes dissolved components. Respectively light in the water is controlled by sediments, plankton or colored dissolved organic matter in the water as well as other oceanographic parameters and its availability is changing on different spatial-temporal scales, from local millisecond light flashes to regional and global (century) trends (see common textbooks like Kirk 2010 or Watson and Zielinski 2013).
For example, Dupont and Aksnes (2013) presented a decrease in water clarity of the North Sea during the 20th century. The aim of the HE516 survey was to address the following main scientific objectives:
1) to define the specific hydrographic and/or meteorological conditions responsible for recurrent AZP along Irish coasts
2) to quantitatively determine the spatial distribution of species of Amphidomataceae and the corresponding toxins in the plankton. Pattern and potential gradients in distribution will provide evidence for or against the hypothesis that that toxigenic Amphidomataceae are adverted from the open sea to coastal areas of Ireland.
3) to characterize the plankton communities accompanying Amphidomatacean species. Together with toxin analysis of size fractionated samples and manually sorted grazers species, and using existing plankton data of the Marine Institute it is aimed to identify heterotrophic dinoflagellates, ciliates, or other small zooplankton as not yet recognized toxin vectors
4) to assess the distribution of Amphidomatacean resting stages along the Irish coastline to evaluate the hypothesis that extended cyst beds are responsible for recurrent Azadinium blooms in Irish coastal area.
5) to link hyperspectral light availability and bio-optical environment with local phytoplankton distribution incorporating the topography and hydrodynamic conditions in an attempt to explain patchiness and bloom favoring conditions.
6) to investigate the light climate to address changes in light availability (coastal ocean darkening) with consequences for primary producers, biodiversity and marine and coastal ecosystems. A comparison with earlier studies around Ireland is possible (e.g. HE302).
7) to complete data sets from the Southern and (North-) Western North Sea obtained during earlier expeditions for site comparison over the years.
The primary focus for the cruise was on species of toxigenic dinoflagellates with special emphasis on species of the family Amphidomataceae and heterotrophic plankton as potential predators together with data on the physical oceanography of the study area. In addition to polyether toxins and those associated with PSP, we also performed on-board measurements of other toxins, such as domoic acid and DSP toxins. Plankton samples were size-fractionated from Rosette bottle casts and net tows and/or pumped and concentrated from discrete depths. From several locations, algal cultures of potential toxin producing species will be established from planktonic samples by single cell isolation and later used to clarify the taxonomic identity, the phylogenetic status, and the toxin production potential. For a quantitative determination of the spatial distribution of Amphidomataceae we used real-time PCR with previously developed species-specific probes for the species Az. spinosum, Az. obesum, Az. poporum and Amphidoma languida; and a probe generally positive for all Amphidomataceae). For the first time this allowed for the specific determination of abundance and distribution of these AZA producing species in the area. These molecular based distribution data were supplemented by conventional microscopic analysis of fixed plankton samples. qPCR was also used to determine the abundance of Amphidomataceae in sediment samples which were be taken by a Van Veen sampler at selected stations. As cysts from all these small species have not been identified and characterized, a direct microscopical quantification is currently not possible. In addition, sediment subsamples will be incubated later in the laboratory for cyst germination in order to establish cultures for a thorough characterization of species present in this sediment samples.
4 Narrative of the Cruise
The survey started on the 17th July, 20.00 h eight hours late because the luggage of the Irish colleagues, who had arrived at Bremerhaven the day before, was delivered at Bremen Airport with a delay of 24 hours. R/V departed Heincke from the AWI pier in Handelshafen, where all scientific equipment had been taken on board previously and the first station was successfully completed the next morning at Borkum Riff in order to test all equipment and to conduct limited instrument trials.
Bio-optical measurements were performed without any difficulties, whereas phytoplankton sample work-up and aliquotation proved to be difficult due to high biomass and sediment concentrations. However, these problems ceased with the following stations. followed by another station in the southern North Sea on the same day. In continuation, two stations per day were sampled in the British Channel until the western tip of Cornwall, form where a denser sampling regime through the Celtic Sea with three stations per day towards the southern Irish coast was applied. Here began the first transect perpendicular to the Irish coast. The further course went along the Irish coast first to the west and later to the north including two more perpendicular transects, one to the south and another in southwest direction from Bantry Bay. Weather became stormier towards the end of the month and the Captain Diecks decided to shelter one day in the bay of Galway on the 31st July due to bad weather conditions. In the morning of 1st August the port of Galway was reached and the Irish crew was exchanged. In calmer weather, the
expeditioncontinued 2nd August along the Irish coast including two further perpendicular transects to the west north of Galway and to the northwest from Donegal Bay. The survey continued further north passing the Outer Hebrides in the west and further along the north coast of Scotland through the Pentland Firth into the North Sea. Unexpectedly the sea was extraordinarily calm throughout the complete second leg of the survey, which permitted to maintain the sampling regime of three
Fig. 3.1 Track chart of R/V HEINCKE Cruise HE516.
stations per day. The North Sea was sampled in a straight line from Pentland Firth to Helgoland and continued further to Bremerhaven, which was reached on the morning of 15th of August, one day earlier than initially scheduled on request of Captain Diecks in order to allow some repairs of ship instrumentation. Scientists and equipment left the ship on the same day, effectively terminating the scientific aspects of the survey. The survey was extremely successful and 75 stations could be sampled. The special feature of this trip was that many of the parameters normally determined in laboratories could be measured in almost real time on board. These include algal toxins via tandem mass spectrometry, genetic analyses via qPCR and in situ microscopy. Thus, some scientific objectives have already been achieved directly during the cruise, such as the determination of hydrographic conditions that correlate with the occurrence of Amphidomataceae as well as the determination of the spatial distribution of Amphidomataceae and their toxins in the study area.
5 Preliminary Results
5.1 Oceanographic and bio-optical parameters
(D. Voß, J. Wollschläger, R. Henkel, K. Schwalfenberg, K. Krapf)
Measurements of standard physical oceanographic parameters (temperature, salinity, oxygen, fluorescence, and turbidity) were obtained by CTD casts at each station performed with a Seabird 'sbe911+' CTD probe with sampling rosette (onboard device), as an initial activity at the station to determine further key discrete sampling depths, e.g. to locate chlorophyll maxima. Before each measurement, the CTD was adapted to the ambient water temperature at 10 m water depth for 10 minutes. Temperature was calculated according to the ITS-90 temperature standard (potential T in
°C). All data were recorded and stored using the standard software Seasave V 7.23.2. Water samples were collected at each station from defined depths to measure total suspended material (TSM), particulate absorption (PA), in situ absorption (fractionized for phytoplankton size classes), CDOM/FDOM, toxins and chlorophyll-a concentration (chl-a). In total, 75 CTD profiles were conducted (see Fig 3.1).
Furthermore, a FerryBox was installed to provide basic hydrographic data at high spatial and temporal resolution for various parameters, e.g. salinity, temperature, chl-a fluorescence, pH, turbidity, and dissolved oxygen. The FerryBox was supplied with seawater from the moon pool of the ship. Measurements were done in a 1 min interval along the whole cruise track.
For two selected transects the CTD profiles are shown below. One transect is the first transect at the Irish coast, the second transect shows the way back from the Orkney Islands to Bremerhaven, Germany (see station map, Fig 3.1).
The bio-optics part of the cruise determined and correlated the underwater light field with the inherent optical properties and optically active substances of the water. The data were combined with transparency measurements and ship-borne ocean colour sensing.
Hyperspectral und multispectral light field measurements: A HyperPro II profiling system (Satlantic, Halifax, Canada) was used to acquire bio-optical data for different parameters. The profiler consists of one hyperspectral irradiance and one hyperspectral radiance sensor, as well as fluorescence and backscatter sensors and an integrated CTD. A second hyperspectral irradiance sensor was mounted on the research vessel for reference measurements. On the profiler, the irradiance sensor measures downwelling and the radiance sensor upwelling light. Profiler measurements were conducted at almost every CTD station if sea state and light conditions allowed a deployment. Normally, three casts from the back of the ship were performed in free- falling mode. At each cast, the profiler was lowered until the downwelling light values were of the same order of magnitude as the background noise level of the sensor. First data processing was done onboard; further modeling will be performed after the cruise.
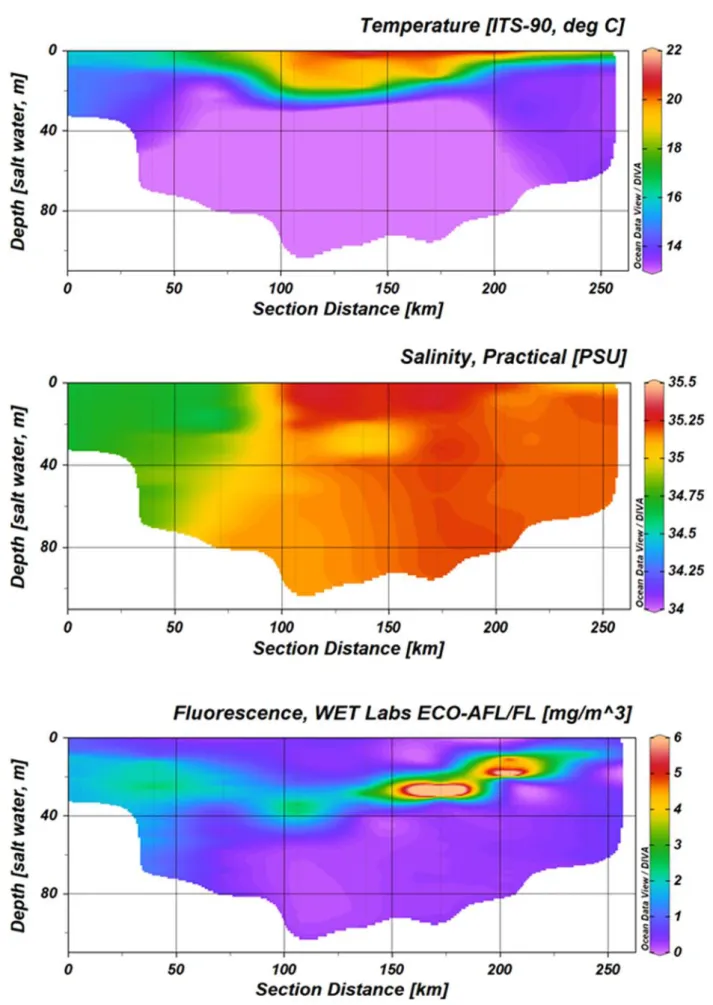
Fig. 5.1.1 Temperature, salinity and fluorescence profiles from the first transect at the Irish coast (highlighted in red, Fig. 3.1). The section is shown from the coast to offshore stations, left to right
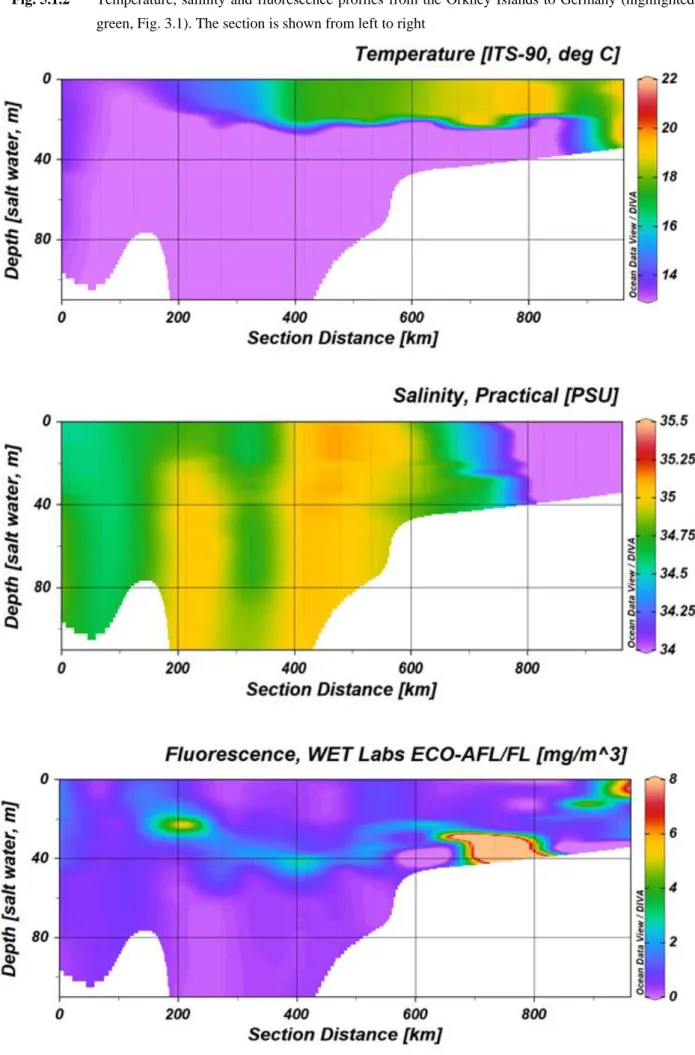
Fig. 5.1.2 Temperature, salinity and fluorescence profiles from the Orkney Islands to Germany (highlighted in green, Fig. 3.1). The section is shown from left to right
Bio-optical sensor package (BOP): The bio-optical sensor package (BOP) was used for multi- parameter sensing to acquire bio-optical data. The BOP consists of an AC-S (Wetlabs), a bb9 (Wetlabs), a FL2NTU and an integrated CTD (SeaBird) for measuring in situ beam absorption and attenuation as well as optical backscattering. Additionally, the frame in which the components of the BOP were mounted was also equipped with an LISST-200x (Sequoia) to determine particle size distribution. Beam absorption and attenuation measurements cover the wavelength spectrum of 400 –730 nm. The backscatter sensor BB9 measures at 9 wavelengths i.e. at 412, 440, 488, 510, 532, 595, 650, 676, and 715 nm. The BOP deployments depended on sea state, but could be conducted at almost each CTD station. At these stations, the BOP was adapted to the ambient water temperature at 10 m water depth for 5 minutes. Afterwards, one profile was performed at ships starboard from surface to the maximum depth reached by the CTD. During the cast, the BOP was lowered with 0.2 m/s by the winch system. Data processing of the BOP-sensors as well as of the LISST-200x is still ongoing, modeling will be performed afterwards.
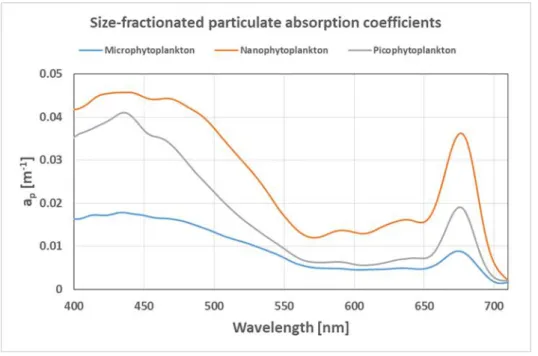
Fig. 5.1.3 Absorption coefficient spectra from different particle size fractions as data examples from the PSICAM
Ocean Color Sensing: Water transparency measurements were performed with a 0.3 m diameter Secchi disk at almost each station depending on sea state and weather conditions. The Forel-Ule (FU) color scale is composed of 21 colors, from ‘indigo blue’ to ‘cola brown’, and represents the range of colors that can be found in the open sea, coastal, and continental waters. Based upon a historical background, this provides an estimation of the present water constituents influencing the water color. The color of the water is determined over a Secchi disc at half the disc’s depth (where the disc disappears from sight) at almost each station. Furthermore, above-water hyperspectral radiometric observations were conducted during the whole cruise. A radiometer setup with one RAMSES-ACC hyperspectral cosine irradiance meter to measure ES (𝜆) (downwelling solar irradiance), and four RAMSES-ARC hyperspectral radiance meters to measure Lsfc (θsfc, Φ, 𝜆) (upwelling water-leaving radiance) and Lsky (θsky, Φ, 𝜆) (sky-leaving radiance) were installed in the foremast of the ship's bow (TriOS GmbH, Germany). Hyperspectral measurements were
Fig. 5.1.4 Estimated distribution of Karenia sp. along the west coast of Ireland based on continuous absorption coefficient measurements
collected at 5 min intervals over a spectral range of 𝜆 = 320 – 950 nm. Data processing will be done according to Garaba & Zielinski (2013). Furthermore, newly developed processing algorithms will be tested with the collected data set. Processing is still ongoing.
Hyperspectral in situ absorption coefficient measurements: In addition to the measurements with the bio-optical package, the absorption properties of the water were also determined using a point- source integrating cavity absorption meter (PSICAM). This instrument has the advantage that it measures the absorption coefficients of the water constituents without interference by scattering of the particles present in the sample. It consists of an integrating cavity made of a highly reflective material in which the water sample is filled. A light source in the center of the cavity provides the light that is measured by a spectrometer in a range of 400 to 710 nm. From the ratio of light intensity measured when the sample is filled with purified water and when it is filled with the sample the absorption coefficients can be calculated. Samples were taken at each station from the surface (from the FerryBox) and from the respective chlorophyll maximum (from the water sampler). Besides measuring total absorption from the native sample, the water was also size fractionated by filtration (through filters with a pore size of 20, 2, and 0.2 µm, respectively). This allows the calculation of the absorption coefficients attributable to the different phytoplankton size classes (micro-, nano-, and picophytoplankton). Furthermore, a flow-through version of the PSICAM, the hyperspectral absorption sensor (HyAbS, developed by the Helmholtz-Zentrum
Geesthacht) was operated to measure total absorption of surface water continuously during the cruise and to further test the system. The HyAbS was attached to a bypass to the FerryBox, thus measured the same water. Processing of the data of both instruments is ongoing, but figure 5.1.3 shows an example of the PSICAM data. Furthermore, preliminary analyses have been made regarding the evaluation of the shape of the absorption coefficient spectra of the HyAbS with respect to phytoplankton taxonomy. It allowed the estimation of the distribution of Karenia sp., which was in accordance with microscopic analyses.
5.2 Plankton Sampling
(U. Tillmann, R. Gallardo-Salas, J. Silke, P. Hynes)
At each station, vertical net tows of the upper water column (depth depending on the vertical chlorophyll profile of the CTD) with two different phytoplankton nets (20 µm and 10 µm mesh size) were taken for a qualitative characterization of the plankton community. Samples taken with the 20 µm mesh size net were used for subsequent analysis of toxin content. At each station, lugol fixed subsamples of rosette water samples were taken and stored for later quantitative cell counts.
The 10 µm net material was divided in two 50ml samples kept in centrifuge tubes. One of them was preserved with lugol’s iodine and kept in the fridge to be used for molecular analysis and microscopy. The second one was used for light microscopy and single cell isolation using an inverted microscope Olympus IX53. 5 ml of this sample was also preserved with lugol’s in a 10 ml brown glass vial and sealed for further microscopic analysis and for long term storage as a repository material.
In order to identify and isolate potentially AZA-producing species of the Family Amphidomataceae, rosette water samples were screened by 20 µm gauze, concentrated on 3 µm polycarbonate filters and inspected under the microscope. In addition, various pre-cultures were started by either isolating single cells or diluting water of different stations. After a few weeks of growth, these cultures will be inspected for the growth of algal species of interest, especially for cultures of toxigenic species of Azadinium, Amphidoma and Pseudo-nitzschia.
Over the whole survey plankton communities were very different ranging from dense diatom blooms in the English Channel to more dinoflagellate dominated communities is most of the Atlantic and North Sea stations. The English Channel stations were characterised by abundant sediments in the samples, especially at stations 3 to 5. Diversity of microplankton during the cruise was quite high: a detailed species list is in preparation but will include records of more than 120 different plankton species. For diatoms, typical summer species, such as various species of Guinardia and Rhizosolenia, were dominating, and species of the potentially toxic domoic acid producer Pseudo-nitzschia were present at a large number of stations. A quite diverse community of heterotrophic dinoflagellates of the genus Protoperidinium and Gyrodinium was present at almost all stations. Also, Polykrikos was abundant in the English Channel stations (5-8) first, then again from station 14 onwards towards the Irish coast, most likely feeding on Scrippsiella cells.
Photosynthetic dinoflagellates in most areas were dominated by species of the genus Tripos, Prorocentrum, Scrippsiella, and Gonyaulax. The potentially toxic dinoflagellates Dinophysis spp.
were regularly present, whereas Alexandrium spp. and Protoceratium reticulatum were only rarely seen in the samples. Akashiwo sanguinea was also recorded from station 14 and at most stations in the South and West of Ireland. The strange looking Ceratium peridinium was recorded at various
stations but clearly abundant in stations 25-27. From the Bantry transect towards Galway (stations 28 to 36) Azadinium/Amphidoma were noticeably found in abundance in the samples. At a number of stations along the Irish coast a dense bloom of the ichthyotoxic naked dinoflagellate Karenia mikimotoi was observed including a large patch at station 17 and 18 just outside Cork Harbour and then later at station 36 off the Shannon estuary. Some stations of the “Crease line” (19-22) were dominated by copepods and there were quite sparse in terms of microplankton. During the second leg high numbers of the Pseudo-nitzschia seriata group were present at stations 39 and 59.
Ceratium lineatum was abundant at stations 61 and 62 and a bloom of Amphidoma languida was observed at station 71 in the central North Sea. Species of interest were isolated and worked up to mono cultures for culture library and stored in the Marine Institute, mainly Pseudo-nitzschia seriata group, Pseudo-nitzschia delicatissima group and Azadinium spp. were isolated. PCR and SEM work is going to be carried out on these isolates this year to make a definite identification of species collected.
Intense on board inspection of concentrated water samples of all stations at high magnification (630 x) at the microscope indicated the presence of Azadinium and/or Amphidoma spp. at many stations. Species designation of Amphidomataceae with light microscopy is very difficult, but based on extensive experience with light microscopy of the cultured strains of various species, cells fitting in terms of size, shape, presence/absence of a spine and/or pyrenoid(s) were detected and identified as Az. dalianense, Az. obesum, and Az. spinosum. Moreover, a number of cells did not conform with these species and likely indicate the presence of other species of the family as well. This finding later on needs to be confirmed by molecular data and/or available strains from the culture exercises. At all stations a semiquantitative analysis of live samples with respect to presence/absence and abundance of Amphidomataceae was performed and will be used for a detailed method comparison together with LC-MS azaspiracid analysis and molecular quantification using qPCR. Microscopy indicated a large range of abundance of Amphidomataceae ranging from not detected to a maximum of > 200.000 cells per litre in the central North Sea. At this station, the dense population of Amphidomataceae was mainly composed of the toxigenic species Amphidoma languida, but significant numbers of the toxigenic Azadinium spinosum were also present.
5.3 Analysis of phycotoxins in plankton (B. Krock, L. Hintze, C. Cusack, J. Kilcoyne)
A large array of lipophilic toxins (gymnodimines (GYM), spirolides (SPX), pinnatoxins (PnTx), okadaic acid (OA) and dinophysistoxins (DTX), pectenotoxins (PTX), yessotoxins (YTX), goniodomins (GD) and azaspiracids (AZA) and hydrophilic domoic acid (DA) were measured directly onboard ship by LC-MS/MS in size fractionated plankton net tows with a cutoff of 20 µm.
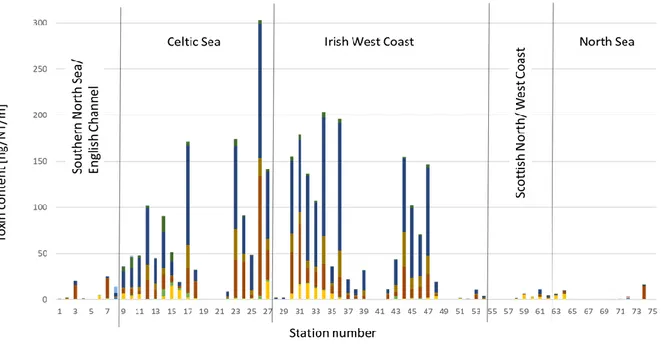
In addition, AZA were measured in the 3-20 µm size fractions in water samples from discrete depths (surface, 10 m and chlorophyll maximum). As net hauls were not taken from the same depths throughout the entire survey, net haul values were normalized to net haul per meter (NT/m) in order to compensate for different sampling depths and make results comparable across stations (Fig. 5..3.1). In general, highest toxin levels were detected in the Celtic Sea and along the Irish west coast. Low toxin levels not exceeding 30 ng/NT/m were found in the English Channel, along
the western and northern Scottish coast and in the North Sea. The most abundant toxins found were OA, DTX-2 and PTX-2, all three known to be produced by the genus Dinophysis and well documented for Irish waters.
An also relative wide distribution across all water bodies sampled during HE516 was found for DA, which is produced by several species of the diatom genus Pseudo-nitzschia. In contrast, other phycotoxins such as GYM A, SPX-1 and 20-methyl G and YTX were only found sporadically and at low levels. DTY-1 and GDA were exclusively found in the North Sea and also at very low levels. PnTX E, F and G were not detected at all.
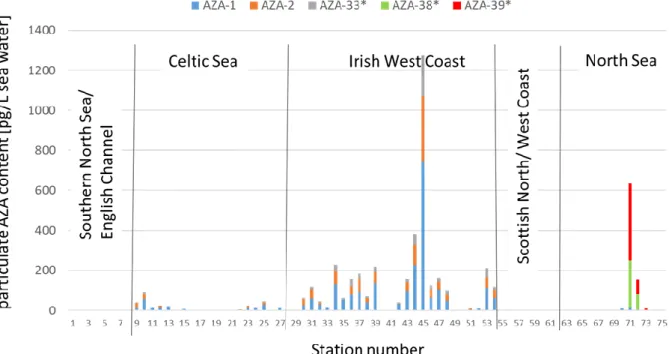
In addition to net haul samples, also sea water from discrete depths was sampled for Amphidomataceae, which are smaller than 20 µm and therefore cannot be sampled by 20 µm mesh plankton nets, and associated AZA. Samples of all depths per station were pooled and AZA determined onboard by LC-MS/MS for all currently known AZA. Five AZA were detected throughout the entire survey (Fig. 5.3.2): AZA-1, AZA-2 and AZA-33 as toxins known to be produced by Azadinium spinosum and AZA-38 and AZA-39, which are produced by Amphidoma languida. AZA-38 and AZA-39 were found only found in the North Sea.
Fig. 5.3.1 Lipophilic phycotoxin and domoic acid levels in plankton net tows expressed as ng toxin/NT/m.
Abbreviations: NT = net tow, AZA = azaspiracid, DA = domoic acid, SPX-1 = 13-desmethyl spirolide C, 20-Me G = 20-methyl spirolide G, GYM = gymnodimine A, OA = okadaic acid, DTX = dinophysistoxin, PTX = pectenotoxin, PTX-2sa = pectenotoxin-2 seco acid, YTX = yessotoxin, GDA
= goniodomin A
AZA were absent in the English Channel and along the Scottish west and north coast (Fig. 5.3.2) and low levels of AZA-1, AZA-2 and an AZA-33 (up to 100 pg total AZA/L) were detected in the Celtic Sea. Highest AZA levels were detected along the Irish west coast. AZA-38 and AZA-39
Fig. 5.3.2 mean AZA levels water samples from 3 m, 10 m and chl-a maximum depth expressed as pg AZA/L sea water. * values of these AZA are expressed as AZA-1 equivalents.
were only found in the North Sea. In all cases occurrence of AZA during the survey coincided with the detection of DNA marker of the corresponding producing species (see chapter 5.4).
In general, detected phycotoxins were consistent with toxigenic species found by microscopy and molecular probes in the case of Amphidomataceae.
5.4 Molecular Genetics (S. Wietkamp, D. Clarke) Amphidoma languida
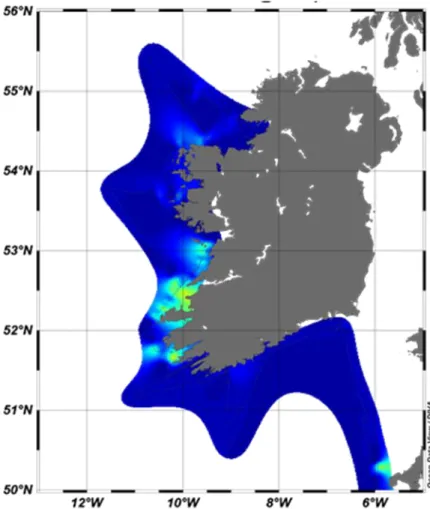
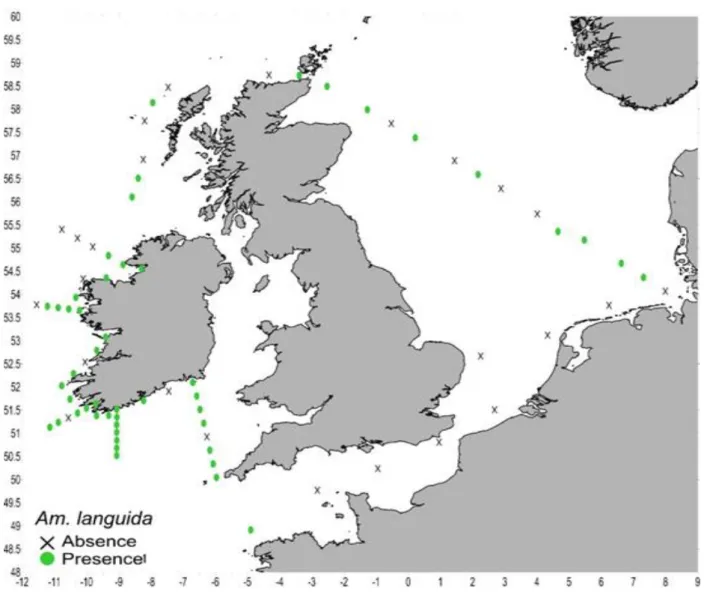
Based on the qPCR results on board, Amphidoma languida was present at 50 stations and mainly detected in samples of the Irish and Scottish coast and at the stations of the North Sea transect (Fig. 5.4.1). A large population of this species was observed at station 71, North Sea.
It was absent in stations close to the German and Dutch coast, as well as within the English Channel.
Fig. 5.4.1 Detection of Amphidoma languida using the qPCR. Sampling locations with a successful detection are marked with green dots
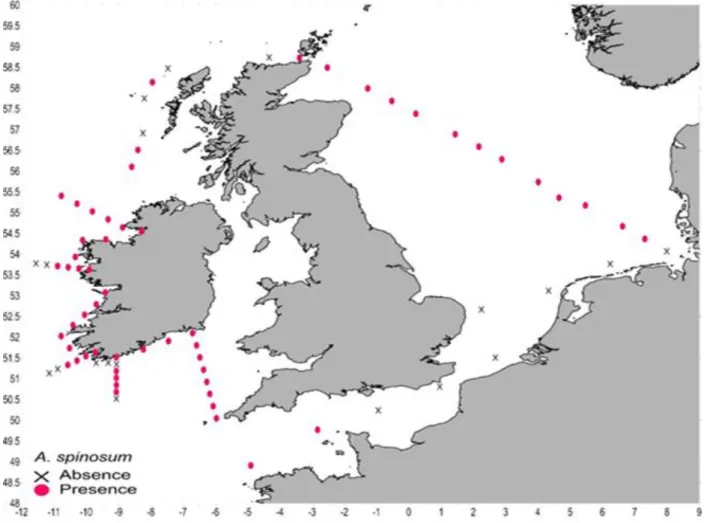
Azadinium spinosum
DNA of Azadinium spinosum was found to be present in samples of almost all stations (56 out of 75), except for a few stations in the English Channel and off the Irish coast (Fig. 5.4.2). All in all, A. spinosum was found most frequently during the survey compared to the other two target species A. obesum & A. poporum.
Fig. 5.4.2 Detection of Azadinium spinosum using the qPCR. Sampling locations with successful detection are marked with pink dots
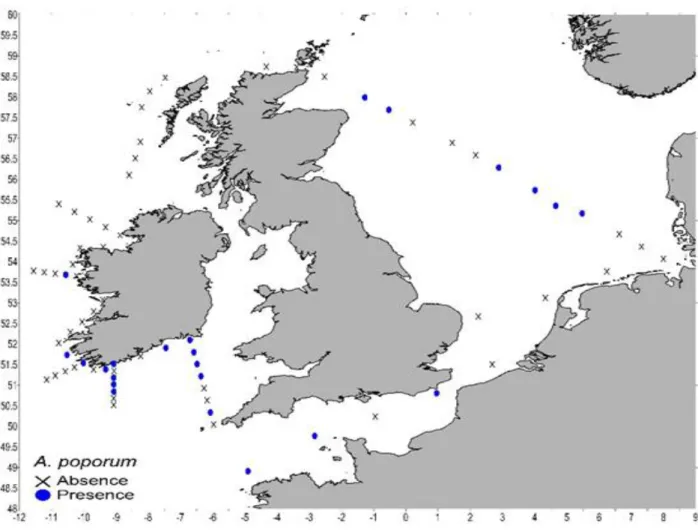
Azadinium poporum
Azadinium poporum was found in within the least number of samples during the survey (23), compared to the other AZA-producing species (Fig. 5.4.3). However, DNA of A. poporum was mainly detected in southern coastal waters of Ireland and a few occurrences were recorded in the North Sea and within the English Channel. It was completely absent in the German Bight, at stations around the northern Irish coast and at stations around the coast of Scotland.
Fig. 5.4.3 Detection of Azadinium poporum using the qPCR. Sampling locations with successful detection are marked with blue dots
Azadinium obesum
Like A. poporum, Azadinium obesum was present in less stations (25) compared to A. spinosum and Am. languida (Fig. 5.4.4). A. obesum was mainly observed in samples of the North Sea, but not in the German Bight. Additionally, it was present in a couple of samples from the southern Irish coast. No target DNA was observed in the English Channel, the northern Irish coast and stations around the Scottish coast.
Fig. 5.4.4 Detection of Azadinium poporum using the qPCR. Sampling locations with successful detection are marked with blue dots
A SYBR Green qPCR assay, targeting all members of the Amphidomataceae family (Smith et al., 2016), was performed on those 15 station samples, which did not show positive amplification for the species-specific TaqMan assays. The SYBR Green assay revealed Amphidomatacean DNA in all the field samples, except for the stations St.3, -4 and -65.
6 Station List HE516
Station No. Date Gear Time Latitude Longitude Water
Depth Remarks/Recovery
HEINCKE 2018 [UTC] [°N] [°E/W] [m]
HE516-1 18.7. standard 6.14 53°45,982' 6°14,661'E 24 HE516-2 18.7. standard 15.36 53°07,074' 4°19,928'E 30 HE516-3 19.7. standard 6.07 52°39,666' 2°14,950'E 40 HE516-4 19.7. standard 14.14 51°30,491' 2°40,908'E 33 HE516-5 20.7. standard 6.08 50°48,434' 0°07,123'E 35 HE516-6 20.7. standard 14.57 50°14,406' 0°57,445'W 59 HE516-7 21.7. standard 6.02 49°46,494' 2°49,801'W 67 HE516-8 21.7. standard 16.11 48°54,864' 4°53,985'W 102 HE516-9 22.7. standard 7.08 50°02,960' 5°58,103'W 63 HE516-10 22.7. standard 10.41 50°20,510' 5°64,132'W 80 HE516-11 22.7. standard 14.21 50°20,510' 6°10,131'W 93 HE516-12 22.7. standard 17.35 50°55,880' 6°16,177'W 93 HE516-13 23.7. standard 7.03 51°13,459' 6°22,267'W 98 HE516-14 23.7. standard 11.07 51°31,023' 6°28,511'W 79 HE516-15 23.7. standard 14.41 51°48,596' 6°34,919'W 69 HE516-16 24.7. standard 7.06 52°06,076' 6°42,524'W 30 HE516-17 24.7. standard 11.05 51°54,592' 7°27,514'W 57 HE516-18 24.7. standard 15.27 51°42,580' 8°13,965'W 27 HE516-19 25.7. standard 7.07 50°31,267' 9°04,430'W 121 HE516-20 25.7. standard 11.08 50°41,063' 9°04,397'W 116 HE516-21 25.7. standard 15.09 50°51,078' 9°04,106'W 114 HE516-22 26.7. standard 7.08 51°01,316' 9°04,212'W 114 HE516-23 26.7. standard 11.10 51°11,123' 9°04,371'W 98 HE516-24 26.7. standard 15.07 51°21,111' 9°04,138'W 94 HE516-25 27.7. standard 7.04 51°31,052' 9°04,339'W 38 HE516-26 27.7. standard 11.04 51°23,377' 9°19,209'W 68 HE516-27 27.7. standard 15.01 51°23,102' 9°41,863'W 68 HE516-28 28.7. standard 7.06 51°08,235' 11°08,681'W 185 HE516-29 28.7. standard 11.08 51°14,138' 10°52,455'W 169 HE516-30 28.7. standard 15.06 51°20,515' 10°34,339'W 149 HE516-31 29.7. standard 7.03 51°38,250' 9°42,660'W 44 HE516-32 29.7. standard 11.04 51°32,60' 10°00,31'W 62 HE516-33 29.7. standard 15.04 51°26,346' 10°17,167'W 109 HE516-34 30.7. standard 7.03 51°44,017' 10°31,294'W 47 HE516-35 30.7. standard 11.06 52°01,873' 10°46,236'W 66 HE516-36 30.7. standard 14.10 52°17,440' 10°24,415'W 82 HE516-37 2.8. standard 9.03 53°04,818' 9°24,968'W 50 HE516-38 2.8. standard 13.04 52°47,610' 9°41,339'W 60 HE516-39 2.8. standard 16.54 52°32,511' 10°03,086'W 61 HE516-40 3.8. standard 7.06 53°46,617' 11°33,392'W 271 HE516-41 3.8. standard 11.14 53°44,823' 11°13,105'W 192 HE516-42 3.8. standard 15.06 53°42,952' 10°53,412'W 149 HE516-43 4.8. standard 7.04 53°41,097' 10°33,387'W 120 HE516-44 4.8. standard 11.03 53°39,424' 10°13,212'W 65 HE516-45 4.8. standard 14.54 53°37,734' 9°54,425'W 20 HE516-46 5.8. standard 7.00 53°56,266' 10°20,749'W 84 HE516-47 5.8. standard 11.23 54°20,252' 10°06,685'W 88 HE516-48 5.8. standard 15.11 54°21,464' 9°23,911'W 53 HE516-49 6.8. standard 7.04 55°24,417' 10°46,442'W 203 HE516-50 6.8. standard 11.04 55°13,001' 10°17,098'W 200 HE516-51 6.8. standard 15.01 55°01,823' 9°48,467'W 121 HE516-52 7.8. standard 6.58 54°33,490' 8°18,110'W 23 HE516-53 7.8. standard 11.02 54°38,942' 8°52,175'W 82 HE516-54 7.8. standard 15.05 54°50,438' 9°19,588'W 90 HE516-55 8.8. standard 6.59 56°06,524' 8°35,707'W 119 HE516-56 8.8. standard 11.05 56°30,747' 8°23,671'W 79 HE516-57 8.8. standard 15.03 56°55,095' 8°14,425'W 133 HE516-58 9.8. standard 7.02 57°45,049' 8°12,112'W 99
HE516-59 9.8. standard 11.03 58°08,571' 7°56,625'W 107 HE516-60 9.8. standard 15.01 58°28,548' 7°28,254'W 116 HE516-61 10.8. standard 6.51 58°44,311' 4°20,206'W 79 HE516-62 10.8. standard 10.58 58°43,585' 3°22,774'W 88 HE516-63 10.8. standard 17.03 58°29,724' 2°31,802'W 65 HE516-64 11.8. standard 5.51 57°59,522' 1°16,486'W 100 HE516-65 11.8. standard 10.05 57°41,366' 0°31,437'W 109 HE516-66 11.8. standard 14.22 57°23,174' 0°12,880'E 76 HE516-67 12.8. standard 5.57 56°53,284' 1°26,197'E 94 HE516-68 12.8. standard 10.46 56°35,322' 2°09,795'E 78 HE516-69 12.8. standard 15.58 56°17,187' 2°52,793'E 71 HE516-70 13.8. standard 5.52 55°44,334' 4°00,592'E 34 HE516-71 13.8. standard 9.58 55°21,652' 4°39,117'E 42 HE516-72 13.8. standard 14.14 55°10,566' 5°28,116'E 39 HE516-73 14.8. standard 5.52 54°40,475' 6°37,368'E 37 HE516-74 14.8. standard 10.00 54°22,158' 7°18,700'E 32 HE516-75 14.8. standard 13.50 54°04,166' 7°59,414'E 30
Standard station operation include CTD/Rosette, Plankton net haul from 20 m depth to surface, and Santlantic Profiler.
7 Data and Sample Storage and Availability
Data of this cruise are deposited and openly accessible in the PANGAEA data repository as detailed in table 7.1.
Table 7.1 Overview of data availability
Type Database Available Free Access Contact
Cruise track PANGAEA yes yes bernd.krock@awi.de
Continous thermo- halinograph
PANGAEA yes yes gerd.rohardt@awi.de
CTD PANGAEA yes yes andreas.wisotzki@awi.de
Upwelling radiance PANGAEA yes yes oliver.zielinski@uni- oldenburg.de Downwelling
radiance
PANGAEA yes yes oliver.zielinski@uni-
oldenburg.de Hyperspectral
underwater light field
PANGAEA yes yes oliver.zielinski@uni-
oldenburg.de Above water
irradiance
PANGAEA yes yes oliver.zielinski@uni-
oldenburg.de Phycotoxins in
plankton
PANGAEA yes yes bernd.krock@awi.de
Phycotoxins in water samples
PANGAEA yes yes bernd.krock@awi.de
8 Acknowledgements
We thank Captain Diecks and the entire FS Heincke crew for their technical support and excellent collaboration throughout the entire expedition.
9 References
Dupont, N.; Aksnes, D.L. (2013) Centennial changes in the water clarity of the Baltic Sea and the North Sea. Estuarine, Coastal and Shelf Science, 131, 282-289.
Frank, C., Meier, D., Voss, D., Zielinski, O. (2014) Computation of nitrate concentrations in coastal waters using an in situ ultraviolet spectrophotometer: Behavior of different computation methods in a case study a steep salinity gradient in the Southern North Sea. Methods in Oceanography, 9, 34-43.
Holinde L.; Zielinski O. (2016) Bio-optical characterization and light availability parameterization in Uummannaq Fjord and Vaigat-Disko Bay (West Greenland). Ocean Science, 12: 117-128;
DOI 10.5194/os-12-117-2016.
Kirk, J. T. O. (2011) Light and photosynthesis in aquatic ecosystems. 3rd Edition, Cambridge Univ.
Press, p 662.
Krock, B.; Tillmann, U.; John, U.; Cembella, A. D., (2009) Characterization of azaspiracids in plankton size-fractions and isolation of an azaspiracid-producing dinoflagellate from the North Sea. Harmful Algae 8 (2), 254-263.
Krock, B.; Tillmann, U.; Voß, D.; Koch, B. P.; Salas, R.; Witt, M.; Potvin, É.; Jeong, H. J., (2012) New azaspiracids in Amphidomataceae (Dinophyceae). Toxicon 60 (5), 830-839.
Krock, B.; Tillmann, U.; Alpermann, T. J.; Voß, D.; Zielinski, O.; Cembella, A. D., (2013) Phycotoxin composition and distribution in plankton fractions from the German Bight and western Danish coast. J. Plankton Res. 35 (5), 1093-1108.
Krock, B.; Tillmann, U.; Witt, M.; Gu, H., (2014) Azaspiracid variability of Azadinium poporum (Dinophyceae) from the China Sea. Harmful Algae 36, 22-28.
Krock, B.; Tillmann, U.; Potvin, É.; Jeong, H.-J.; Drebing, W.; Kilcoyne, J.; Al-Jorani, A.; Twiner, M.; Göthel, Q.; Köck, M., (2015) Structure Elucidation and in Vitro Toxicity of New Azaspiracids Isolated from the Marine Dinoflagellate Azadinium poporum. Mar. Drugs 13 (11), 6687-6702.
McMahon, T.; Silke, J., (1996) West coast of Ireland; winter toxicity of unknown aetiology in mussels. Harmful Algae News 14 (1), 2.
Satake, M.; Ofuji, K.; Naoki, H.; James, K. J.; Furey, A.; McMahon, T.; Silke, J.; Yasumoto, T., (1998) Azaspiracid, a New Marine Toxin Having Unique Spiro Ring Assemblies, Isolated from Irish Mussels, Mytilus edulis. J. Am. Chem. Soc. 120 (38), 9967-9968.
Tillmann, U.; Salas, R.; Gottschling, M.; Krock, B.; O'Driscoll, D.; Elbrächter, M., (2012) Amphidoma languida sp. nov. (Dinophyceae) reveals a close relationship between Amphidoma and Azadinium. Protist 163 (5), 701-719.
Tillmann, U.; Gottschling, M.; Nézan, E.; Krock, B.; Bilien, G., (2014) Morphological and molecular characterization of three new Azadinium species (Amphidomataceae, Dinophyceae) from the Irminger Sea. Protist 165 (4), 417-444.
Tillmann, U.; Gottschling, M.; Nézan, E.; Krock, B., (2015) First records of Amphidoma languida and Azadinium dexteroporum (Amphidomataceae, Dinophyceae) from the Irminger Sea off Iceland. Marine Biodiversity Records 8, doi:10.1017/S1755267215001128.
Tillmann, U.; Borel, C. M.; Barrera, F.; Lara, R.; Krock, B.; Almandoz, G. O.; Witt, M.; Trefault, N., (2016) Azadinium poporum from the Argentine Continental Shelf, Southwestern Atlantic, produces azaspiracid-2 and azaspiracid-2 phosphate. Harmful Algae 51, 40-55.
Watson, J.; Zielinski, O. (2013) Subsea Optics and Imaging, 1st Edition, Woodhead Publishing, p 596.
Wollschläger, J.; Voß, D.; Zielinski, O.; Petersen, W., (2016) In Situ Observations of Biological and Environmental Parameters by Means of Optics—Development of Next-Generation Ocean
Sensors With Special Focus on an Integrating Cavity Approach. IEEE Journal of Oceanic Engineering 99: 1-10. doi: 10.1109/JOE.2016.2557466.