OXFAM BRIEFING PAPER JANUARY 2017
Members of the Shining Mothers group, a community-based women's group helping to teach business skills and raise awareness of their rights. The Shining Mothers discuss issues which affect them in their community and raise these at public meetings to ensure their voice is being heard by local government. Kawangware, Nairobi, Kenya. 2016. Photo: Allan Gichigi/Oxfam
AN ECONOMY FOR THE 99%
It‟s time to build a human economy that benefits everyone, not just the privileged few
EMBARGOED UNTIL 00:01 HRS GMT 16 January 2017
New estimates show that just eight men own the same wealth as the poorest half of the world. As growth benefits the richest, the rest of society – especially the poorest – suffers. The very design of our economies and the principles of our economics have taken us to this extreme, unsustainable and unjust point. Our economy must stop excessively rewarding those at the top and start working for all people. Accountable and visionary governments, businesses that work in the interests of workers and producers, a valued environment, women’s rights and a strong system of fair taxation, are central to this more human economy.
AN ECONOMY FOR THE 99%
It is four years since the World Economic Forum identified rising economic inequality as a major threat to social stability,1 and three years since the World Bank twinned its goal for ending poverty with the need for shared prosperity.2 Since then, and despite world leaders signing up to a global goal to reduce inequality, the gap between the rich and the rest has widened. This cannot continue. As President Obama told the UN General Assembly in his departing speech in September 2016: „A world where 1% of humanity controls as much wealth as the bottom 99% will never be stable.‟
Yet the global inequality crisis continues unabated:
• Since 2015, the richest 1% has owned more wealth than the rest of the planet.3
• Eight men now own the same amount of wealth as the poorest half of the world.4
• Over the next 20 years, 500 people will hand over $2.1 trillion to their heirs – a sum larger than the GDP of India, a country of 1.3 billion people.5
• The incomes of the poorest 10% of people increased by less than $3 a year between 1988 and 2011, while the incomes of the richest 1% increased 182 times as much.6
• A FTSE-100 CEO earns as much in a year as 10,000 people in working in garment factories in Bangladesh.7
• In the US, new research by economist Thomas Piketty shows that over the last 30 years the growth in the incomes of the bottom 50% has been zero, whereas incomes of the top 1%
have grown 300%.8
• In Vietnam, the country‟s richest man earns more in a day than the poorest person earns in 10 years.9
Left unchecked, growing inequality threatens to pull our societies apart. It increases crime and insecurity, and undermines the fight to end poverty.10 It leaves more people living in fear and fewer in hope.
From Brexit to the success of Donald Trump‟s presidential campaign, a worrying rise in racism and the widespread disillusionment with mainstream politics, there are increasing signs that more and more people in rich countries are no longer willing to tolerate the status quo. Why would they, when experience suggests that what it delivers is wage stagnation, insecure jobs and a widening gap between the haves and the have-nots? The challenge is to build a positive alternative – not one that increases divisions.
The picture in poor countries is equally complex and no less concerning. Hundreds of millions of people have been lifted out of poverty in recent decades, an achievement of which the world should be proud. Yet one in nine people still go to bed hungry.11 Had growth been pro-poor between 1990 and 2010, 700 million more people, most of them women, would not be living in poverty today.12 Research finds that three-quarters of extreme poverty could in fact be
eliminated now using existing resources, by increasing taxation and cutting down on military and other regressive spending.13 The World Bank is clear that without redoubling their efforts to tackle inequality, world leaders will miss their goal of ending extreme poverty by 2030.14 It doesn‟t have to be this way. The popular responses to inequality do not have to increase divisions. An Economy for the 99% looks at how large corporations and the super-rich are driving the inequality crisis and what can be done to change this. It considers the false assumptions that have led us down this path, and shows how we can create a fairer world
„The gap between poor and rich people in Kenya is sometimes very humiliating. To see that it is just a wall that defines these rich people from the lower class.
You find that some of their children drive cars and when you are passing around the roads you get covered in dust, or if it is raining you are splashed with water.‟
Jane Muthoni, member of Shining Mothers, an Oxfam-supported community group
based on a more human economy – one in which people, not profit, are the bottom line and which prioritizes the most vulnerable.
THE CAUSES OF INEQUALITY
There is no getting away from the fact that the biggest winners in our global economy are those at the top. Oxfam‟s research has revealed that over the last 25 years, the top 1% have gained more income than the bottom 50% put together.15 Far from trickling down, income and wealth are being sucked upwards at an alarming rate. What is causing this? Corporations and super-rich individuals both play a key role.
Corporations, working for those at the top
Big businesses did well in 2015/16: profits are high and the world‟s 10 biggest corporations together have revenue greater than that of the government revenue of 180 countries combined.16
Businesses are the lifeblood of a market economy, and when they work to the benefit of everyone they are vital to building fair and prosperous societies. But when corporations increasingly work for the rich, the benefits of economic growth are denied to those who need them most. In pursuit of delivering high returns to those at the top, corporations are driven to squeeze their workers and producers ever harder – and to avoid paying taxes which would benefit everyone, and the poorest people in particular.
Squeezing workers and producers
While many chief executives, who are often paid in shares, have seen their incomes skyrocket, wages for ordinary workers and producers have barely increased, and in some cases have got worse. The CEO of India‟s top information firm earns 416 times the salary of a typical
employee in his company.17 In the 1980s, cocoa farmers received 18% of the value of a chocolate bar – today they get just 6%.18 In extreme cases, forced labour or slavery can be used to keep corporate costs down. The International Labour Organization estimates that 21 million people are forced labourers, generating an estimated $150bn in profits each year.19 The world‟s largest garment companies have all been linked to cotton-spinning mills in India, which routinely use the forced labour of girls.20 The lowest-paid workers in the most precarious conditions are predominantly women and girls.21 Across the world, corporations are
relentlessly squeezing down the costs of labour – and ensuring that workers and producers in their supply chains get less and less of the economic pie. This increases inequality and suppresses demand.
Dodging tax
Corporations maximize profit in part by paying as little tax as possible. They do this by using tax havens or by making countries compete to provide tax breaks, exemptions and lower rates.
Corporate tax rates are falling all over the world, and this – together with widespread tax dodging – ensures that many corporations are paying minimal tax. Apple allegedly paid 0.005% of tax on its European profits in 2014.22 Developing countries lose $100bn every year to tax dodging.23 Countries lose billions more through providing tax holidays and exemptions. It is the poorest people who lose out the most, as they are most reliant on the public services that these forgone billions could have provided. Kenya is losing $1.1bn every year in tax exemptions for
corporations, nearly twice its budget for health – this in a country where women have a 1 in 40 chance of dying in childbirth.24 What is driving this behaviour by corporates? Two things: the
focus on short-term returns to shareholders and the increase in „crony capitalism‟.
Super-charged shareholder capitalism
In many parts of the world, corporations are increasingly driven by a single goal: to maximize returns to their shareholders. This means not only maximizing short-term profits, but paying out an ever-greater share of these profits to the people who own them. In the UK, 10% of profits were returned to shareholders in 1970; this figure is now 70%.26 In India, the figure is lower but is growing rapidly, and for many corporations it is now higher than 50%.27 This has been criticized by many, including Larry Fink, CEO of Blackrock (the world‟s largest asset
manager)28 and Andrew Haldane, Chief Economist at the Bank of England.29 The increased return to shareholders works for the rich, because the majority of shareholders are among the richest in society, increasing inequality. Institutional investors, like pension funds, own ever- smaller shares in corporations. Thirty years ago, pension funds owned 30% of shares in the UK; now they own only 3%.30 Every dollar of profit given to the shareholders of corporations is a dollar that could have been spent paying producers or workers more, paying more tax, or investing in infrastructure or innovation.
Crony capitalism
As documented by Oxfam in An Economy for the 1%,31 corporations from many sectors – finance, extractives, garment manufacturers, pharmaceuticals and others – use their huge power and influence to ensure that regulations and national and international policies are shaped in ways that enable continued profitability. For example, oil corporations in Nigeria have managed to secure generous tax breaks.32
Even the technology sector, once seen as a sector that is relatively above board, is increasingly linked to charges of cronyism. Alphabet, the parent company of Google, has become one of the biggest lobbyists in Washington and is in constant negotiations in Europe over anti-trust rules and tax.33 Crony capitalism benefits the rich, the people who own and run these corporations, at the expense of the common good and of poverty reduction. It means that smaller businesses struggle to compete and ordinary people end up paying more for goods and services as they face cartels and monopoly power of corporations and those with close connections with government. The world‟s third richest man, Carlos Slim, controls approximately 70% of all mobile phone services and 65% of fixed lines in Mexico, costing 2%
of GDP.34
The role of the super-rich in the inequality crisis
By any measure, we are living in the age of the super-rich, a second „gilded age‟ in which a glittering surface masks social problems and corruption. Oxfam‟s analysis of the super-rich includes all those individuals with a net worth of at least $1bn. The 1,810 dollar billionaires on the 2016 Forbes list, 89% of whom are men, own $6.5 trillion – as much wealth as the bottom 70% of humanity.35 While some billionaires owe their fortunes predominantly to hard work and talent, Oxfam‟s analysis of this group finds that one-third of the world‟s billionaire wealth is derived from inherited wealth, while 43% can be linked to cronyism.36
„[M]ore and more corporate leaders have responded with actions that can deliver immediate returns to shareholders, such as buybacks or dividend increases, while under-investing in innovation, skilled workforces or essential capital expenditures necessary to sustain long-term growth.‟25
Larry Fink, CEO of Blackrock
Once a fortune is accumulated or acquired it develops a momentum of its own. The super-rich have the money to spend on the best investment advice, and the wealth held by the super-rich since 2009 has increased by an average of 11% per year. This is a rate of accumulation far higher than ordinary savers are able to obtain. Whether via hedge funds or warehouses full of fine art and vintage cars,38 the highly secretive industry of wealth management has been hugely successful in increasing the prosperity of the super-rich. The fortune of Bill Gates has risen 50% or $25bn since he left Microsoft in 2006, despite his commendable efforts to give much of it away.39 If billionaires continue to secure these returns, we could see the world‟s first trillionaire in 25 years. In such an environment, if you are already rich you have to try hard not to keep getting a lot richer.
The huge fortunes we see at the very top of the wealth and income spectrum are clear evidence of the inequality crisis and are hindering the fight to end extreme poverty. But the super-rich are not just benign recipients of the increasing concentration of wealth. They are actively perpetuating it.
One way this happens is through their investments. As some of the biggest shareholders (particularly in private equity and hedge funds), the wealthiest members of society are huge beneficiaries of the shareholder worship that is warping the behaviour of corporations.
Avoiding tax, buying politics
Paying as little tax as possible is a key strategy for many of the super-rich.41 To do this they make active use of the secretive global network of tax havens, as revealed by the Panama Papers and other exposés. Countries compete to attract the super-rich, selling their sovereignty. Super-rich tax exiles have a wide choice of destinations worldwide. For an investment of at least £2m, you can buy the right to live, work and buy property in the UK and benefit from generous tax breaks. In Malta, a major tax haven, you can buy full citizenship for
$650,000. Gabriel Zucman has estimated that $7.6 trillion of wealth is hidden offshore.42 Africa alone loses $14bn in tax revenues due to the super-rich using tax havens – Oxfam has calculated this would be enough to pay for the healthcare that could save the lives of four million children and to employ enough teachers to get every African child into school. Tax rates on wealth and on top incomes have continued to fall across the rich world. In the US, the top rate of income tax was 70% as recently as 1980; it is now 40%.43 In the developing world, taxation on the rich is lower still: Oxfam‟s research shows that the average top rate is 30% on incomes, and the majority is never collected.44
Many of the super-rich also use their power, influence and connections to capture politics and ensure that the rules are written for them. Billionaires in Brazil lobby to reduce taxes,45 and in São Paulo would prefer to use helicopters to get to work, flying over the traffic jams and broken infrastructure below.46 Some of the super-rich also use their fortunes to help buy the political outcomes they want, seeking to influence elections and public policy. The Koch brothers, two of the richest men in the world, have had a huge influence over conservative politics in the US, supporting many influential think tanks and the Tea Party movement47 and contributing heavily to discrediting the case for action on climate change. This active political influencing by the super-rich and their representatives directly drives greater inequality by constructing
„reinforcing feedback loops‟ in which the winners of the game get yet more resources to win even bigger next time.48
„No matter how justified inequalities of wealth may be initially, fortunes can grow and perpetuate themselves beyond any rational justification in terms of social utility.‟37 Thomas Piketty, economist and author of Capital in the 21st Century
„No society can sustain this kind of rising inequality. In fact, there is no example in human history where wealth
accumulated like this and the pitchforks didn‟t eventually come out.‟
Nick Hanauer, US billionaire and entrepreneur40
THE FALSE ASSUMPTIONS DRIVING THE ECONOMY OF THE 1%
The current economy of the 1% is built on a set of false assumptions which lie behind many of the policies, investments and activities of governments, business and wealthy individuals, and which fail people living in poverty and society more broadly. Some of these assumptions are about economics itself. Some are more about the dominant view of economics described by its creators as „neoliberalism‟, which wrongly assumes that wealth created at the top will „trickle down‟ to everyone else. The IMF has identified neoliberalism as a key cause of growing inequality.50 Unless we tackle these false assumptions, we will be unable to turn the situation around.
1. False assumption #1: The market is always right, and the role of governments should be minimized. In reality, the market has failed to prove itself the best way of organizing and valuing much of our common life or designing our common future. We have seen how corruption and cronyism distort markets at the expense of ordinary people and how the excessive growth of the financial sector exacerbates inequality. Privatization of public services such as health, education or water has been shown to exclude the poor, and especially women.
2. False assumption #2: Corporations need to maximize profits and returns to
shareholders at all costs. Maximizing profits disproportionately boosts the incomes of the already rich while putting unnecessary pressure on workers, farmers, consumers, suppliers, communities and the environment. Instead, there are many more constructive ways to organize businesses that contribute to greater prosperity for all, and plenty of existing examples of how to do this.
3. False assumption #3: Extreme individual wealth is benign and a sign of success, and inequality is not relevant. Instead, the emergence of a new gilded age, with vast amounts of wealth concentrated in too few hands – the majority male – is economically inefficient, politically corrosive, and undermines our collective progress. A more equal distribution of wealth is necessary.
4. False assumption #4: GDP growth should be the primary goal of policy making. Yet as Robert Kennedy said in 1968: „GDP measures everything except that which makes life worthwhile.‟ GDP fails to count the huge amount of unpaid work done by women across the world. It fails to take into account inequality, meaning that a country like Zambia can have high GDP growth at a time when the number of poor people actually increased.
5. False assumption #5: Our economic model is gender-neutral. In fact, cuts in public services, job security and labour rights hurt women most. Women are disproportionately in the least secure and lowest-paid jobs and they also do most of the unpaid care work – which is not counted in GDP, but without which our economies would not function.
6. False assumption #6: Our planet’s resources are limitless. This is not only a false assumption, but one which could lead to catastrophic consequences for our planet. Our economic model is based on exploiting our environment and ignoring the limits of what our planet can bear. It is an economic system that is a major driver of runaway climate change.
These six assumptions need to be overturned, and fast. They are outdated, backward-looking, and have failed to deliver both shared prosperity and stability. They are driving us off a cliff. An alternative way of running our economy – a human economy – is needed urgently.
„Instead of delivering growth, some neoliberal policies have increased inequality, in turn jeopardizing durable expansion.‟
IMF49
„[GDP] measures everything except that which makes life worthwhile.‟51 Robert Kennedy, 1968
„You cannot lift the world at all, while half of it is kept so small.‟ 52
Charlotte Perkins Gillman, socialist and suffragist
A HUMAN ECONOMY, DESIGNED FOR THE 99%
Together we need to create a new common sense, and turn things on their head to design an economy whose primary purpose is to benefit the 99%, not the 1%. The group that should benefit disproportionately from our economies are people in poverty, regardless of whether they are in Uganda or the United States. Humanity has incredible talent, huge wealth and infinite imagination. We need to put this to work to create a more human economy that benefits everyone, not just the privileged few.
A human economy would create fairer, better societies. It would ensure secure jobs paying decent wages. It would treat women and men equally. No one would live in fear of the cost of falling sick. Every child would have the chance to fulfil their potential. Our economy would thrive within the limits of our planet, and hand a better, more sustainable world to every new generation.
Markets are a vital engine for growth and prosperity, but we cannot continue to accept the pretence that it is the engine that steers the car or decides on the best direction to take.
Markets need careful management in the interests of everyone so that the proceeds of growth are distributed fairly, and to ensure an adequate response to climate change or to deliver healthcare and education to many – particularly, but not exclusively, in the poorest countries.
A human economy would have a number of core ingredients aimed at tackling the problems that have contributed to today‟s inequality crisis. This paper only begins to sketch these out, but provides a foundation on which to build.
In a human economy:
1. Governments will work for the 99%. Accountable government is the greatest weapon against extreme inequality and the key to a human economy. Governments must listen to all, not a wealthy minority and their lobbyists. We need to see a reinvigoration of civic space, especially for the voices of women and marginalized groups. The more accountable our governments are, the fairer our societies will be.
2. Governments will cooperate, not just compete. Globalization cannot continue to mean a relentless race to the bottom on tax and labour rights which benefits no one but those at the top. We must end the era of tax havens once and for all. Countries must cooperate, on an equal basis, to build a new global consensus and a virtuous cycle to ensure corporations and rich people pay fair taxes, the environment is protected, and workers are paid well.
3. Companies will work for the benefit of everyone. Governments should support business models that clearly drive the kind of capitalism that benefits all and underpins a sustainable future. The proceeds of business activity should go to those who enabled and created them – society, workers, and local communities. Lobbying by corporates and the purchase of democracy should be brought to an end. Governments must ensure corporations pay fair wages and fair taxes and take responsibility for their impact on the planet.
4. Ending the extreme concentration of wealth to end extreme poverty. Today‟s gilded age is undermining our future, and needs to be ended. The richest should be made to contribute to society fairly and not be allowed to get away with unfair privileges. To do this we need to see the rich pay their fair share of tax: we must increase taxes on both wealth and high incomes to ensure a more level playing field, and clamp down on tax dodging by the super-rich.
5. A human economy will work equally for men and women. Gender equality will be at the heart of the human economy, ensuring that both halves of humanity have an equal
chance in life and are able to live fulfilled lives. Barriers to women‟s progress, which include access to education and healthcare, will end for good. Social norms will no longer
determine a woman‟s role in society and, in particular, unpaid care work will be recognized, reduced and redistributed.
6. Technology will be harnessed for the interests of the 99%. New technology has huge potential to transform our lives for the better. This will only happen with active government intervention, especially in the control of technology. Government research is already behind some of the greatest innovations in recent times, including the smart phone. Governments must intervene to ensure that technology contributes to reducing inequality, not increases it.
7. A human economy will be powered by sustainable renewable energy. Fossil fuels have driven economic growth since the era of industrialization, but they are incompatible with an economy that puts the needs of the many first. Air pollution from burning coal leads to millions of premature deaths worldwide, while the devastation caused by climate change hits the poorest and most vulnerable hardest. Sustainable renewable energy can deliver universal energy access and power growth that respects our planetary boundaries.
8. Valuing and measuring what really matters. Moving beyond GDP, we need to measure human progress using the many alternative measures available. These new measures should fully account for the unpaid work of women worldwide. They must reflect not just the scale of economic activity, but how income and wealth are distributed. They must be closely linked to sustainability, helping to build a better world today and for future generations. This will enable us to measure the true progress of our societies.
We can and must build a more human economy before it is too late.
1 AN ERA OF ECONOMIC GROWTH DEFINED BY INEQUALITY AND EXCLUSIVITY
A WORLD IN WHICH 1% OF HUMANITY CONTROLS AS MUCH WEALTH AS THE OTHER 99% WILL NEVER BE STABLE
In September 2016 in his departing speech to the UN General Assembly, President Obama stated: „A world in which 1% of humanity controls as much wealth as the other 99% will never be stable.‟53 Later that month, the World Bank‟s inaugural report on poverty and shared
prosperity found that inequality within countries is higher than it was 25 years ago, and advised that „reductions in inequality will be key to reaching the poverty [Sustainable Development]
goal by 2030‟.54 IMF researchers have warned that inequality hurts growth55 and exacerbates the barriers and injustices faced by people because of their gender, ethnicity or geography.56 The list of social and political consequences of extreme inequality is long.57 People‟s
experience of being left behind and excluded from the prosperity enjoyed by the few was cited by many commentators as the reason behind the majority of UK voters choosing to reject membership of the EU in June 201658 and the success of Donald Trump‟s campaign in the US.59
World leaders have now signed up to the Sustainable Development Goals, which apply to all countries regardless of their stage of development. They include Goal 10: to „reduce
inequalities between and within countries‟. This commitment, together with widespread recognition of the problem of inequality, is welcome, but the responses so far have been woefully inadequate. The narrow pursuit of GDP growth and private profits above all else continues to determine global, national and many corporate agendas, with some warning against any attempts to distract from these goals with concerns about inequality.60 As a result, we continue to see policies rooted in flawed and misguided objectives which have become ends in themselves – pursued in ways which can entrench inequality – rather than a means to ensure sustainable human development and well-being.
This report challenges both the overarching objectives and the received wisdom on which economic decisions are based – and presents a more just and sustainable alternative for our societies.
The scale of the inequality crisis requires more than a few policy tweaks or a tokenistic
response. It is imperative that we take this opportunity to ensure widespread recognition of the problem and take meaningful action to address it.
THE CONCENTRATION OF WEALTH DEEPENS
Total global wealth61 has reached a staggering $255 trillion. Since 2015, more than half of this wealth has been in the hands of the richest 1% of people. At the very top, this year‟s data finds that collectively the richest eight individuals have a net wealth of $426bn, which is the same as the net wealth of the bottom half of humanity.62
Wealth continues to accumulate for the wealthy. Capital owners have consistently seen their returns outstrip economic growth over the past three decades.63 Oxfam‟s previous reports have shown how this extreme and growing wealth in the hands of a few translates to power and undue influence over policies and institutions.64
Meanwhile the accumulation of modest assets, especially agricultural assets such as land and livestock, is one of the most important means by which to escape poverty.65 Wealth is critical for people living in poverty to be able to respond to financial shocks like a medical bill.
However, estimates from Credit Suisse find that collectively the poorest 50% of people have less than a quarter of 1% of global net wealth.66 Nine percent of the people in this group have negative wealth, and most of these people live in richer countries where student debt and other credit facilities are available. But even if we discount the debts of people living in Europe and North America, the total wealth of the bottom 50% is still less than 1%.
Unlike extreme wealth at the top, which can be observed and documented through various rich lists, we have much less information about the wealth of those at the bottom of the distribution.
We do know however, that many people experiencing poverty around the world are seeing an erosion of their main source of wealth67 – namely land, natural resources and homes – as a consequence of insecure land rights, land grabbing, land fragmentation and erosion, climate change, urban eviction and forced displacement. While total farmland has increased globally,68 small family farms operate a declining share of this land. Ownership of land among the poorest wealth quintile fell by 7.3% between the 1990s and 2000s.69 Change in land ownership in developing countries is commonly driven by large-scale acquisitions, which see the transfer of land from small-scale farmers to large investors and the conversion of land from subsistence to commercial use.70 Up to 59% of land deals cover communal lands claimed by indigenous peoples and small communities, which translates to the potential displacement of millions of people.71 Yet only 14% of deals have involved a proper process to obtain „free prior and informed consent‟ (FPIC).72 Distribution of land is most unequal in Latin America, where 64%
of the total wealth is related to non-financial assets like land and housing73 and 1% of „super farms‟ in Latin America now control more productive land than the other 99%.74
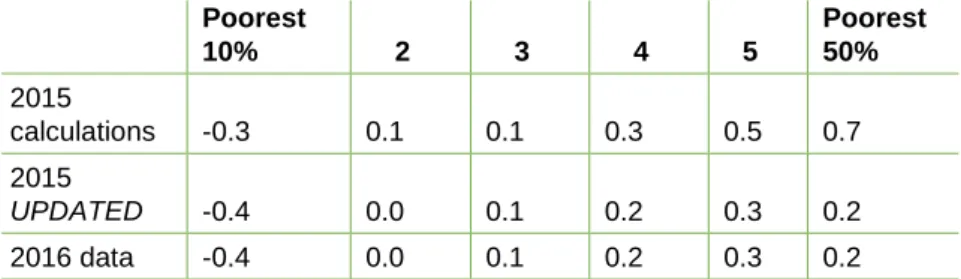
Box 1: Oxfam’s wealth inequality calculations
In January 2014, Oxfam calculated that just 85 people had the same amount of wealth as the bottom half of humanity. This was based on data on the net wealth of the richest individuals from Forbes and data on the global wealth distribution from Credit Suisse. For the past three years, we have been tracking these data sources to understand how the global wealth distribution is evolving. In the Credit Suisse report of October 2015, the richest 1% had the same amount of wealth as the other 99%.75
This year we find that the wealth of the bottom 50% of the global population was lower than previously estimated, and it takes just eight individuals to equal their total wealth holdings. Every year, Credit Suisse acquires new and better data sources with which to estimate the global wealth distribution: its latest report shows both that there is more debt in the very poorest group and fewer assets in the 30–50% percentiles of the global population. Last year it was estimated that the cumulative share of wealth of the poorest 50% was 0.7%; this year it is 0.2%.
Table 1: Share of wealth across the poorest 50% of the global population
The inequality of wealth that these calculations illustrate has attracted a lot of attention, both to the obscene level of inequality they expose and to the underlying data and the calculations themselves. Two common challenges are heard. First, that the poorest people are in net debt, but these people may be income-rich thanks to well-functioning credit markets (think of the indebted Harvard graduate). However, in terms of population, this group is insignificant at the aggregate global level, where 70% of people in the bottom 50% live in low-income countries. The total net debt of the bottom 50% of the global population is also just 0.4% of overall global wealth, or $1.1 trillion. If you ignore the net debt, the wealth of the bottom 50% is $1.5 trillion. It still takes just 56 of the wealthiest individuals to equal the wealth of this group.
The second challenge is that changes over time of net wealth can be due to exchange- rate fluctuations, which matter little to people who want to use their wealth domestically.
As the Credit Suisse reports in US$, it is of course true that wealth held in other currencies must be converted to US$. Indeed, wealth in the UK declined by $1.5 trillion over the past year due to the decline in the value of Sterling. However, exchange-rate fluctuations cannot explain the long-run persistent wealth inequality which Credit Suisse shows (using current exchange rates): the bottom 50% have never had more than 1.5%
of total wealth since 2000, and the richest 1% have never had less than 46%. Given the importance of globally traded capital in total wealth stocks, exchange rates remain an appropriate way to convert between currencies.
Ultimately, Oxfam believes it is important to analyse the wealth distribution, particularly the wealth of the most vulnerable people – and there needs to be systematic collection of good quality and easily comparable survey data measuring total wealth owned by and within poor households.
Poorest
10% 2 3 4 5
Poorest 50%
2015
calculations -0.3 0.1 0.1 0.3 0.5 0.7
2015
UPDATED -0.4 0.0 0.1 0.2 0.3 0.2
2016 data -0.4 0.0 0.1 0.2 0.3 0.2
ENDING EXTREME INCOME POVERTY NEEDS MORE INCLUSIVE GROWTH
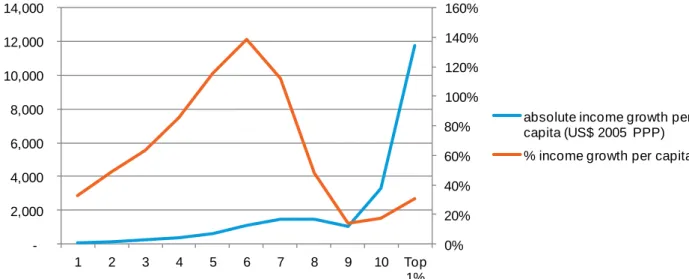
Hundreds of millions of people have been lifted out of poverty in recent decades, an achievement of which the world should be proud. Yet one in nine people still go to bed hungry.77 Had growth been pro-poor between 1990 and 2010, 700 million more people, most of them women, would have escaped poverty over this period.78 The global economy has more than doubled in GDP terms in the last 30 years, with all income levels seeing an increase, resulting in a corresponding decline in extreme poverty rates around the world. As the orange line on Figure 1 below shows, all income groups have seen a positive growth in their real income between 1988 and 2011, particularly in the middle of the global income distribution.
The lowest rate of growth was experienced by those with higher incomes: this is a direct result of the 2008–2011 period, when the effects of the global financial crisis hit high-income
countries in particular. Because of this 2008–2011 effect, the shape of the chart is a moderated version of the famous „elephant chart‟79 which has received much attention for highlighting those income groups that have gained most in the last three decades – those in the middle and at the very top.
The difference between the absolute growth in income of the different deciles is, however, highly unequal – far more than the simple rates of growth would suggest – even after taking into account the economic shock to incomes post-2008, as shown by the blue line on Figure 1.
The incomes of the poorest 10% of people increased by $65 between 1988 and 2011, equivalent to less than $3 extra a year, while the incomes of the richest 1% increased 182 times as much, by $11,800. Oxfam‟s research has revealed that over the last 25 years, the top 1% has gained more income than the bottom 50% put together, and almost half (46%) of total income growth went to the richest 10%.80 This is important because the poorest 10% of the global population still live below the extreme poverty line of $1.90 a day,81 and the World Bank has projected that with the current income distribution we will fail to meet the global target to eradicate poverty by 2030. Even this is a modest ambition, as the national poverty lines of countries themselves is in fact above $1.90 a day. Closer to three billion people, or half the global population, live below the „ethical poverty line‟, calculated as the amount per day that would enable people to achieve a normal life expectancy of just over 70 years.82
Figure 1: Growth of global incomes by decile, 1988–2011
Source: Author calculations, using data from Lakner and Milanovic (2013). All incomes are 2005 PPP dollars, which represent real incomes at 2005.
0%
20%
40%
60%
80%
100%
120%
140%
160%
- 2,000 4,000 6,000 8,000 10,000 12,000 14,000
1 2 3 4 5 6 7 8 9 10 Top
1%
absolute income growth per capita (US$ 2005 PPP)
% income growth per capita
„No society can sustain this kind of rising inequality. In fact, there is no example in human history where wealth accumulated like this and the pitchforks didn‟t eventually come out.‟
Nick Hanauer, US billionaire and entrepreneur76
Skewed income growth (and with it rising income inequality) has been the result of trends in labour markets in many countries, rich and poor. Total income is made up of labour income which is earned by workers, and returns to capital enjoyed by capital owners. All over the world we find that workers have been getting a smaller slice of the pie, while the owners of capital have been prospering.83 Even in China, a country where wages roughly tripled over the last decade, total income, fuelled by high returns to capital, increased even faster. An increasing capital share is almost exclusively a bounty enjoyed by people at the top of the distribution, as the richest disproportionately hold capital.84 In the US, new research by economist Thomas Piketty shows that over the last 30 years the growth in the incomes of the bottom 50% has been zero, whereas incomes of the top 1% have grown 300%.85 It is clear that global growth has been exclusive; something predominately enjoyed by the privileged few.
The growing wage gap
Within the labour share, wage disparities have been growing. Wages in low-skill sectors in particular have been falling behind productivity in emerging economies and stagnating in many rich countries, while wages at the top continue to grow.86 A FTSE 100 CEO earns as much in a year as 10,000 people in working in garment factories in Bangladesh.87 The CEO of India‟s top information firm earns 416 times the salary of a typical employee.88 In developed economies, greater wage inequality has been the single most important driver of income inequality,89 90 while among countries where inequality has fallen, the trend was frequently driven by strong growth in real wages at the bottom. In the case of Brazil, between 2001 and 2012 real wages of the bottom 10% increased more than those of the top 10%,91 thanks to progressive minimum-wage policies.92 In many developing countries where wage disparities are growing, the pay gap between workers with different skills and education levels is a key driver of inequality. Highly skilled workers with more education see their incomes rise, while low-skilled workers see their wages reduced. This gap accounts for 25–35% of income inequality in Asia.93
The squeeze on employment and wages for the lowest-paid workers results in people working for poverty wages in precarious employment. Wage workers in Nepal earned just $73 per month in 2008, followed by $119 in Pakistan (2013) and $121 in Cambodia (2012). Due to the low wage levels, the latter two countries are also among those with the highest incidence of working poverty worldwide.94 In many countries, even the legal minimum wage fails to meet the wage required for a decent standard of living. The minimum wage for banana workers in the Dominican Republic is just 40% of a living wage; in Bangladesh it is nearer 20% of that required to live a decent life.95 Women and young people are particularly vulnerable to precarious work: the jobs of two in three young workers in most low-income countries are either in vulnerable self-employment or unpaid family labour.96 In the OECD, almost 40% of young workers are in non-standard work, such as contract or temporary work, or involuntary part-time employment.97
The decline of workers’ collective bargaining power
The changing structure of the jobs market and associated decline of collective bargaining makes things worse. Various factors have led to the decline in the proportion of workers who are members of unions, and the IMF has found a relationship in advanced economies between this decline and the increasing share of incomes of the top 10%.98 99 In Denmark, an employee flipping burgers for Burger King earns $20 an hour, based on a collective bargaining agreement;
a US employee in the same company, but denied the bargaining opportunity enjoyed by her Danish colleague, gets just $8.90.100 In developed countries, the increase in self-employed workers in the „gig‟ economy, where they are contracted for defined outputs rather than being
employees, puts workers in more precarious financial positions. The landmark ruling against Uber in the UK in October 2016, which insisted that drivers are paid the living wage and entitled to holiday pay, goes some way towards recognizing the rights of workers in this expanding sector.101 Critically, the informal sector continues to be one of the most important sources of income for people, especially women, in low-income countries,102 where workers are not entitled to minimum wages or workers‟ rights and are therefore vulnerable to abuse.
Box 2: Legal protection for Brazil’s domestic workers
The majority of domestic workers in Brazil are women. In 2015, Brazil sanctioned a law that aimed to give equal rights to domestic workers, as for the other occupations.
Research shows that during the process to implement the new legislation, around 1.4 million domestic workers have registered with the eSocial,a labour, welfare and fiscal obligations system.103
„This eSocial was very important, because today we have a way to know how many are regulated, with their rights protected by law. I believe that the trend will gradually increase, people will be more aware, will register, and what needs to be done, will be done. After the law, the number of young domestic workers dropped. For us, this is positive. My great-grandmother was a slave; my grandmother, my mother and I were domestic workers. I was in domestic work at the age of 10 and had no opportunity to study. Today, knowing you have young people attending college, that the number of young people in domestic work dropped, for me, this is a very important victory. We need generations who are also trying to succeed in other areas of the job market. [A girl] can be a maid if she wants, but that cannot be the only gateway or her fate. In 2008, when President Lula signed a decree that banned domestic child labour below 18 years, there were people who criticized, who found it absurd. [...] We do not want [this child] to be on the street or working. We want her to be studying, so that tomorrow she can be a doctor or an engineer. So she can do what she wants, not just the housework.‟
Source: From an interview with Creuza Oliveira, President of the National Federation of Domestic Workers (FENATRAD) of Brazil.
Women remain worse off
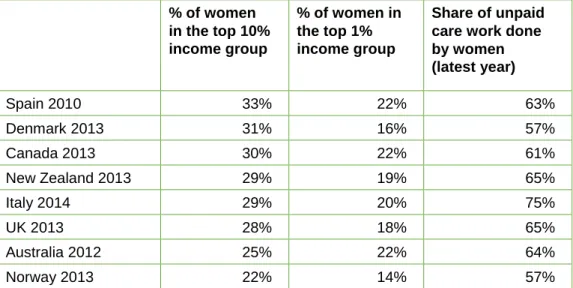
There are significant gender differences when it comes to the winners and losers of the growing income gap, with women more likely to find themselves in the bottom half of the income distribution. Worldwide, the chances for women to participate in the labour market remain almost 27 percentage points lower than those for men.104 In the Middle East and North Africa, just one-quarter of women participate in the labour force, and in South Asia one-third do, compared with three-quarters of men in these regions.105 Once in the labour market, women are more likely than men to be in jobs not protected by labour legislation.106 In formal jobs, women consistently earn less than men. The 2016 edition of World Economic Forum‟s annual report on the gender gap finds that the gap in economic participation has in fact got wider in the last year, and estimates that it will take 170 years for women to be paid the same as men.107 This is due in part to outright discrimination, where women receive lower pay for equal work of equal value; but it is also because women are concentrated in lower paid and part-time jobs. Women earn 31 to 75% less than men due to the pay gap and other economic inequalities such as access to social protection, accumulating to leave them much worse off over their lifetime.108 As Table 2 shows, even in advanced economies where education attainment disparities have been largely eliminated, men continue to dominate high-income groups while women remain disproportionately responsible for carrying out unpaid work in the home.
Table 2: The gender divide in the labour market in advanced economies
% of women in the top 10%
income group
% of women in the top 1%
income group
Share of unpaid care work done by women (latest year)
Spain 2010 33% 22% 63%
Denmark 2013 31% 16% 57%
Canada 2013 30% 22% 61%
New Zealand 2013 29% 19% 65%
Italy 2014 29% 20% 75%
UK 2013 28% 18% 65%
Australia 2012 25% 22% 64%
Norway 2013 22% 14% 57%
Source: http://www.lse.ac.uk/InternationalInequalities/pdf/III-Working-Paper-5---Atkinson.pdf and OECD stat Employment: Time spent in paid and unpaid work, by sex
These trends towards greater inequalities of wealth and income are increasingly hardwired into our economies. Corporations and super-rich individuals both play a key role in driving these disparities.
„The gap between poor and rich people in Kenya is
sometimes very humiliating. To see that it is just a wall that defines these rich people from the lower class. You find that some of their children drive cars and when you are passing around the roads you get covered in dust, or if it is raining you are splashed with water.‟
Jane Muthoni, member of Shining Mothers, an Oxfam-supported community group
2 THE ENGINES DRIVING EXCLUSIVE GROWTH
THE ROLE OF CORPORATIONS IN DRIVING THE INEQUALITY CRISIS
Businesses are bigger than ever. In terms of revenue, 69 of the 100 biggest entities are now corporations, not countries.109 The world‟s 10 biggest corporations – a list that includes Wal- Mart, Shell and Apple – have a combined revenue greater than the government revenue of 180 „poorest‟ countries combined, in a list which includes Ireland, Indonesia, Israel, Colombia, Greece, South Africa, Iraq and Vietnam.110 Revenue, or turnover, gives an idea of the scale of operations behind these giants, but corporations have been eye-wateringly successful at turning this into profit. The 10 most profitable corporations in the US made a collective $226bn in profit in 2015, or $30 for every person on the planet.111
Businesses are key players in a market economy, and when they work to the benefit of all, they can be vital to building fair and thriving societies. But the bounty corporations have generated is not shared; rather it increasingly works predominantly for the rich. The ever- increasing pressure to squeeze costs and deliver proceeds to the people who own and run these corporations, and the rise of „crony capitalism‟, are driving a wedge between the rich and the rest.
Squeezing wages at the bottom
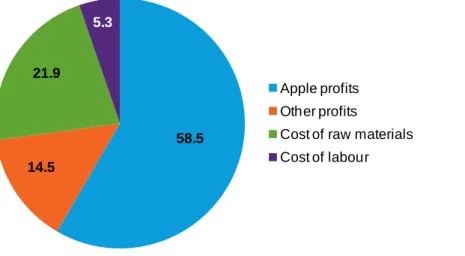
In the short term, corporate profits are generated by keeping margins high, which means minimizing the cost of inputs like labour. Apple has been particularly successful at this, as shown in Figure 2, where in 2010 almost three-quarters of revenue from its iPhone went to profits.
Figure 2: Apple minimizes material and labour costs to maximize its profits (Apple iPhone 2010)112
Source: Breakdown of the estimated value for the wholesale price of the iPhone 4 in 2010, calculated by Kenneth L. Kraemer, Greg Linden and Jason Dedrick (2011).
58.5 14.5
21.9
5.3
Apple profits Other profits
Cost of raw materials Cost of labour
Squeezing wages drives inequality and has a major human cost. Apple is plagued by reports of exhausted workers in China working 12-hour shifts in punitive conditions to produce iPhones and iPads.113 Workers on low incomes across the world continue to see their wages squeezed, particularly through global supply chains where suppliers compete to provide consumers with the lowest prices. Women are the hardest hit, as they are the most likely to work in precarious and low-paid employment. Cocoa farmers in the 1980s received 18% of value of a chocolate bar; today they get 6%.114 Recent Oxfam research found poverty wages being paid in Malawi, Vietnam and Kenya by businesses that were supplying some of the UK‟s most profitable corporations. We calculated that Kenyan flower workers‟ wages could be doubled if just 5 pence were added to a £4 bunch of roses.115 In extreme cases, forced labour, also known as modern slavery, can be used to keep corporate costs down while inflicting immeasurable human cost. The ILO estimates that 21 million people are victims of forced labour, which generates an estimated $150bn of profits every year.116 There is evidence of forced labour from the cotton industry in Uzbekistan117 to the shrimp farms in Thailand. The world‟s largest garment companies have all been linked to cotton-spinning mills in India, which routinely use the forced labour of girls.118 Meanwhile, the gap between the lowest-paid workers and senior executives grows ever wider.119 Annual share dividends from Zara‟s parent company to
Amancio Ortega – the world‟s second richest man – are worth €1,108m which is 800,000 times the annual wage of a worker employed by a supplier garment factory in India.120
Avoiding tax
Tax revenues are critical for funding the policies and services that can fight inequality, and progressive taxes directly shrink the gap between rich and poor. Tax revenues also provide the services that the corporations benefit from, including infrastructure and healthy, educated citizens. However, tax is largely something that corporations seek to minimize. This can be achieved in two ways: through making use of accounting tricks using tax havens and loopholes in the law; or by securing preferential tax agreements and „holidays‟ offered by various countries.
It is estimated that Nigeria loses $2.9bn a year in tax revenues due to tax incentives.121 One tax policy, for example, states that any individual or corporate investment in publicly owned
infrastructure is entitled to claim tax breaks;122 which last year provided a company owned by Aliko Dangote – the richest man in Africa123 – with a 30% tax break on a road project.124 This follows a long history of tax incentives offered to the cement magnate.125 Some of the largest corporations are paying virtually no tax: Apple was alleged to have paid a tax rate of 0.005% on its European profits in 2014.126
Multinational corporations can shop around for the best deals offered by different countries by playing one country‟s tax system against another‟s. This has led to a trend of declining corporate income tax rates in the last couple of decades, over and above the decline in other tax rates. Eight of the world‟s top industrialized nations lowered their corporation tax rates last year or announced plans to do so.127 In 1990, the G20 average statutory corporate tax rate was 40%; in 2015, it was 28.7%.128 Beyond the headline rates, there is an increasing number of special giveaways and sweetheart deals between governments and individual corporations.
In 2014, for example, in competition for Samsung‟s investment, Indonesia offered a corporate income tax exemption for 10 years, while Vietnam offered 15 years.129
Multinational corporations can also be well placed to take advantage of international tax rules and tax havens to avoid tax. This often involves the manipulation of trading activity between different subsidiaries of the corporation in an effort to reduce or eliminate profits in the country where they should be paying tax, and instead booking their profits in low-tax jurisdictions. A company in Uganda used shell companies in tax havens to try to avoid paying $400m in tax.
That is more than the Ugandan government spends on healthcare each year. Fortunately, the practice was stopped by the government.130
Estimates of total tax avoidance by corporations vary. The IMF estimates that as much as 1%
of GDP is lost in revenue from OECD countries, and the United Nations Conference on Trade and Development (UNCTAD) estimates that developing countries are losing at least $100bn each year.131 That is more than enough to ensure that all of the 124 million children currently out of school get an education.132
Supercharged shareholder capitalism
Squeezing labour and production costs and minimizing taxes allow corporations to hand an ever-growing proportion of these profits to their owners. In publicly listed companies, this drive for ever-greater profit has delivered rich rewards for shareholders. For corporations in the UK, the proportion of profits going to shareholders as dividend payments rather than being
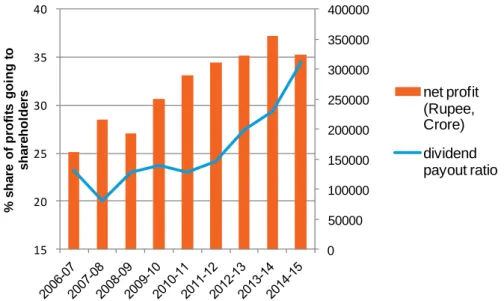
reinvested in the business, has risen from 10% of profits in the 1970s to 70% today.133 In 2015, the proportion was 86% and 84% for Australia and New Zealand respectively, thanks in part to a tax credit that investors receive on their dividend payouts.134 In India, as profits have been rising for the 100 largest listed corporations, the share of net profits going to dividends has also increased steadily over the last decade, reaching 34% in 2014/15, with around 12 private corporations paying more than 50% of their profits as dividends (see Figure 3). Corporations have also been hoarding cash: according to rating agency Moody‟s, US (non-financial) corporations held a total of $1.7 trillion on their balance sheets at the end of 2015135 and have been buying back their own shares to further increase the value for shareholders. In the US, the 500 largest listed corporations spent on average 64% of their profit on buying back shares between September 2014 and September 2016.136
Figure 3: Profits and dividend payouts of the 100 largest listed corporations in India137
Source: Mint analysis of the largest 100 firms listed on the Bombay Stock Exchange, based on Capitaline data. This would not be so troubling if we were all shareholders, jointly sharing the returns from thriving enterprises. To own shares, however, one must have capital to invest in the first place, and hence the majority of shares are owned by wealthy individuals and institutional investors.
Even in countries where pension funds are significant institutional investors, in effect sharing the returns with pensioners, their share of these lucrative assets has been declining. In the UK, pension funds 30 years ago owned about 30% of total shares, but this had fallen to just 3% by 2014.138 Financial intermediaries such as private equity and hedge funds, as well as foreign investors, are far bigger shareholders..139 In the US, businesses are increasingly owned by such entities, and these entities are heavily used by the top 1%. The US Treasury calculated that this has led to $100bn less revenue.140
0 50000 100000 150000 200000 250000 300000 350000 400000
15 20 25 30 35 40
% share of profits going to shareholders net profit (Rupee, Crore) dividend payout ratio
Working for the investors
The interests of shareholders have decisive influence over corporate decisions. This is increasingly the case over ever-shorter time horizons. The practice of rewarding managers with stock options as part of their remuneration package directly links business decision making to short-term profits, and compels managers to act in the interests of shareholders (including themselves) as opposed to prioritizing production, sales and longer-term interests.141 Meanwhile, the rest of the shareholders in modern public equity markets are anonymous traders, not concerned investors looking after long-term best interests.142 This short-term thinking, known as „quarterly capitalism‟, undermines investments in sustainability, both for the corporations themselves but also for employees, consumers and the environment. According to Larry Fink, CEO of Blackrock, the world‟s largest asset manager: „[M]ore and more corporate leaders have responded with actions that can deliver immediate returns to shareholders, such as buybacks or dividend increases, while under-investing in innovation, skilled workforces or essential capital expenditures necessary to sustain long-term growth.‟143 Corporations run on the principle of making a quick buck are not creating inclusive growth.
Crony capitalism
Since 1990, there has been a big increase in billionaire wealth that has been derived from industries with very close relationships to governments, such as construction and mining. This is particularly true in the developing world, but is also an important factor in the rich world.144 This has been described by The Economist magazine as „crony capitalism‟.
As Oxfam has documented in previous papers,145 corporations from all sectors – finance, extractives, garment manufacturers, pharmaceuticals and others – use their huge power and influence to ensure that regulations and national and international policies are shaped in a way which will ensure continued profitability. Pharmaceutical companies, for example, spent more than $240m lobbying in Washington in 2015.146 The world‟s third richest man, Carlos Slim, controls approximately 70% of all mobile phones and 65% of fixed lines in Mexico. The OECD calculates that the dysfunctional Mexican telecommunications sector generated a loss in welfare provision of $129.2bn between 2005 and 2009, equivalent to 1.8% of GDP per year.147 Oil corporations in Nigeria have managed to secure generous tax breaks.148 In the EU, a 2014 report examining the influence of the financial sector found that the financial industry spends more than €120m per year on lobbying in Brussels and employs more than 1,700 lobbyists.149 Even the technology sector, once seen as a sector that is relatively above board, is
increasingly linked to charges of cronyism. Alphabet, the parent company of Google, is now one of the biggest lobbyists in Washington and Brussels on anti-trust rules and tax systems.150 Such crony capitalism benefits the rich at the expense of the common good. It means that ordinary people end up paying more for goods and services, as prices are influenced by cartels and the monopoly power of corporations and their links to government. In crony capitalism, corporations use their connections to secure lax regulations and lower taxes, depriving governments of revenue.
THE ROLE OF THE SUPER-RICH IN THE INEQUALITY CRISIS
The super-rich, defined here as the world‟s billionaires, have seen their wealth expand hugely in the last 30 years. The 1,810 dollar billionaires on the 2016 Forbes list, 89% of whom are men, own $6.5 trillion – as much wealth as the bottom 70% of humanity. Billionaires are the human face of the rapid increase in the concentration of wealth and increasing returns from capital.
Richly rewarded
Once a fortune – or capital – is accumulated, it can grow quickly. The super-rich can achieve returns that are not available to the ordinary saver, helping the gap to grow between the wealthy and everyone else. Whether it is via hedge funds or warehouses full of fine art and vintage cars,152 the highly secretive industry of wealth management has been hugely
successful in increasing the prosperity of the super-rich. The bigger the initial investment, the higher returns one can make as the initial costs of sophisticated advice and high-risk
investments can be justified with the potential for super-lucrative returns. In 2009, there were 793 billionaires with a total net wealth of $2.4 trillion. By 2016, the richest 793 individuals had a total wealth of $5.0 trillion, an increase of 11% per year for the wealth of this super-rich group.
When Bill Gates left Microsoft in 2006 he had net wealth of $50bn. A decade later this had increased to $75bn, despite his commendable attempts to give it away through his Foundation.
Global financial services company UBS has estimated that in the next 20 years, 500 people will hand over $2.1 trillion to their heirs – a sum larger than the GDP of India, a country of 1.3 billion people.153 If these returns continue, it is quite possible that we could see the world‟s first trillionaire within 25 years.
A wealth of influence
Oxfam‟s analysis finds that one-third of the world‟s billionaire wealth is derived from inherited wealth, while 43% has some presumption of links to cronyism.154 These findings are echoed by similar exercises carried out by The Economist and others,155 undermining the idea that the majority of the super-rich owe their fortunes to hard work and merit.
The super-rich have an interest in shaping policies that support the accumulation of their wealth, over and above policies that have a more progressive impact on society; research has found that they do well from a more unequal distribution and will try to use their influence accordingly.156 Donella Meadows describes this as the rich constructing „reinforcing feedback loops‟ in which the winners of the game get yet more resources to win even bigger next time.157 For example, they use their wealth to back political candidates, to finance lobbying and – more indirectly – to bankroll think tanks and universities to shift political and economic narratives towards the false assumptions that favour the rich. Billionaires in Brazil lobby to reduce taxes,158 and in São Paulo would prefer to use helicopters to get to work, flying over the traffic jams and broken infrastructure below.159 In the US, the Koch brothers are two of the world‟s richest billionaires who have had huge influence over conservative politics, funding a series of very influential think tanks such as the Cato Institute, supporting the Tea Party movement and contributing heavily to those making the case against climate change.160 The Indian-born Gupta brothers are two businessmen alleged to have too close a relationship with and to wield undue influence over South African President Jacob Zuma.161
As some of the biggest shareholders, it is also the super-rich who are major beneficiaries of the relentless focus on dividends above all else, described at the beginning of this section, which drives down wages and seeks to minimize corporate tax payments. They are the individuals investing in private equity and hedge funds.
Tax is for everyone else
One of the main ways that the super-rich contribute to broader society is through taxes incurred on their income, wealth and capital gains, which can pay for essential public services and redistributes wealth from the richest to the most vulnerable people. However, the IMF has found that tax systems around the world have become steadily less progressive since the early
„No matter how justified inequalities of wealth may be initially, fortunes can grow and perpetuate themselves beyond any rational
justification in terms of social utility.‟151 Thomas Piketty, economist and author of Capital in the Twenty-First Century
reductions in inheritance and wealth taxes.162 Data gathered for Oxfam‟s forthcoming
„Commitment to Reducing Inequality Index‟ has found that the average top rate of income tax for developing countries is less than 30%, and that the majority of this is not collected.163 In the US, where 30% of the world‟s dollar billionaires are from, the top rate of tax was 70% as recently as 1980; now it is 40%, with capital gains tax even lower at 20%.164
Countries are falling over themselves to attract the super-rich and allow them to avoid tax.
Super-rich tax exiles can buy the right to live and work in the UK (but avoid tax) for £2m. They can buy full citizenship of Malta for just $650,000. Furthermore, there is evidence that the super-rich make active use of the global network of tax havens and tax secrecy to avoid paying tax. One conservative estimate has put the amount of individual wealth held offshore at $7.6 trillion.165 In Africa alone, the amount held offshore by rich Africans is estimated to be $500bn, denying African nations a total of $14bn each year in lost revenues.166 This elaborate network of secrecy has been highlighted by the revelations contained in the Panama Papers leak in 2016. While the media focus was of course on the high-profile names involved, what the leak also showed was just how common it is for wealthy individuals to use tax havens to avoid paying tax at home, and how a sophisticated network of lawyers, accountants and banks has been established to facilitate this.167