Analysis of Lipids in Kidney Tissue Using High Resolution MALDI Mass Spectrometry Imaging
Dissertation
zur Erlangung des akademischen Grades
doctor rerum naturalium (Dr. rer. nat.)
im Fach Chemie eingereicht an der
Mathematisch-Naturwissenschaftliche Fakultät der Humboldt-Universität zu Berlin
von
Sarah Ahmed Aboulmagd Khodier, M.Sc. Pharmazeutischewissenschaften
Präsidentin der Humboldt-Universität zu Berlin Prof. Dr.-Ing. Dr. Sabine Kunst
Dekan der Mathematisch-Naturwissenschaftlichen Fakultät Prof. Dr. Elmar Kulke
Gutachter: 1. PD Dr. Michael G. Weller 2. Prof. Dr. Michael W. Linscheid Tag der mündlichen Prüfung: 18.06.2018
Berlin
Eidesstattliche Erklärung
Hiermit erkläre ich an Eides statt, dass die vorliegende Arbeit selbstständig und nur unter Nutzung der angegebenen Hilfsmittel angefertigt wurde.
Berlin, den 18.06.2018 Sarah Aboulmagd
Acknowledgments
There are many people whom I would like to thank for the encouragement and support they have given me throughout the course of my PhD.
First, I would like to express my sincere gratitude to my supervisor, Prof. Dr. Michael W. Linscheid for giving me the chance to perform my doctoral studies in his research group. I am very thankful for his encouragement, valuable guidance, and continuous support.
I am also very grateful to Dr. Petra Esperling for her continuous friendly support and great assistance.
I dedicate my deepest appreciation to Dr. Diego Esteban-Fernández for his guidance and all his support to overcome the difficulties throughout my whole PhD. I am also deeply indebted to Dr. Estefanía Moreno-Gordaliza for her competent support and useful suggestions. I am very thankful to Boris Neumann for his expert support, valuable advices, and constructive discussions.
I would like to express my gratitude to Dr. Sebastian Beck for the constructive discussions and useful advices. Also, I would like to express my appreciations to Dr.
Violette Frochaux, Dr. Ulrike Hochkirch, Dr. Kathrin Brückner, Dr. Georg Kubsch, Dr.
David Benda, Yeliz Akyürek, Dr. Rajko Winkler, Dr. Lena Ruhe, René Becker, Dr.
Sabrina Trog, Angelika Woyda, Pablo Loreo Lares, Dr. Kathleen Schwarz, Dr. Gunnar Schwarz, Sandra Walter, Stefanie Ickert and the whole former and current group members for their assistance and helpful discussions.
I would like to specially thank my colleagues, whom their support made this journey enjoyable and memorable. I am grateful to Dr. Ahmed Hussein El-Khatib for his constructive advices and support in the lab work. My special appreciation to my dear friend, Dr. Oleksandra Kuzmich for her advices and our long discussions throughout my PhD. Many thanks to Dr. Yide David He for his advices, especially at the beginning of my PhD. I would also like to deeply thank Dr. Essa M. Saied and Kevin Prause for their help with translating the thesis summary.
I would also like to express my sincere gratitude to the Yousef Jameel Academic Program for the scholarship and continuous support. Special thanks are directed to Dr.
Uta Hoffmann for her valuable advices and continuous support throughout my PhD.
Last but not least, I would like to thank my dear husband and best friend, Sameh, for his unconditional love, patience, and constant support. I would like to thank my lovely children, Nadine and Adam, for allowing me to grow into the person who I became today. My heartfelt thanks are due to my wonderful family in Cairo, especially my parents, for their continuous care, and all the help and support which contributed greatly to the fulfillment of this work.
Abstract
Mass Spectrometry Imaging (MSI) has become an indispensable tool for studying the spatial distribution of molecules within a diverse range of complex biological samples.
It exploits the advantages of modern mass spectrometers including enhanced sensitivity, mass accuracy, and resolving power to produce images that visually represent tissue biology. This contributes to the understanding of complex biochemical processes by revealing the identity of molecular entities and their tissue distribution.
Since the introduction of MSI, Matrix-Assisted Laser Desorption Ionization (MALDI) has become a dominant imaging method of MS, which proved its usefulness to sort out the complexity of lipid structures in biological tissues. Lipids are particularly suitable for MALDI MSI because they are abundant components of biological tissues, they ionize easily due to their polar head groups, and their molecular weights are generally below 1000 Da, which is optimal for sensitive and high resolution mass analysis.
The mapping of tissue lipids by MSI contributed to the understanding of pathophysiological changes associated with different therapeutic treatments or disease evolution. One example where this aspect could be particularly useful is the toxicity mechanisms of platinum-based therapeutics including the antitumor drug, cisplatin. The role of cisplatin in the treatment of several human malignancies is well-established.
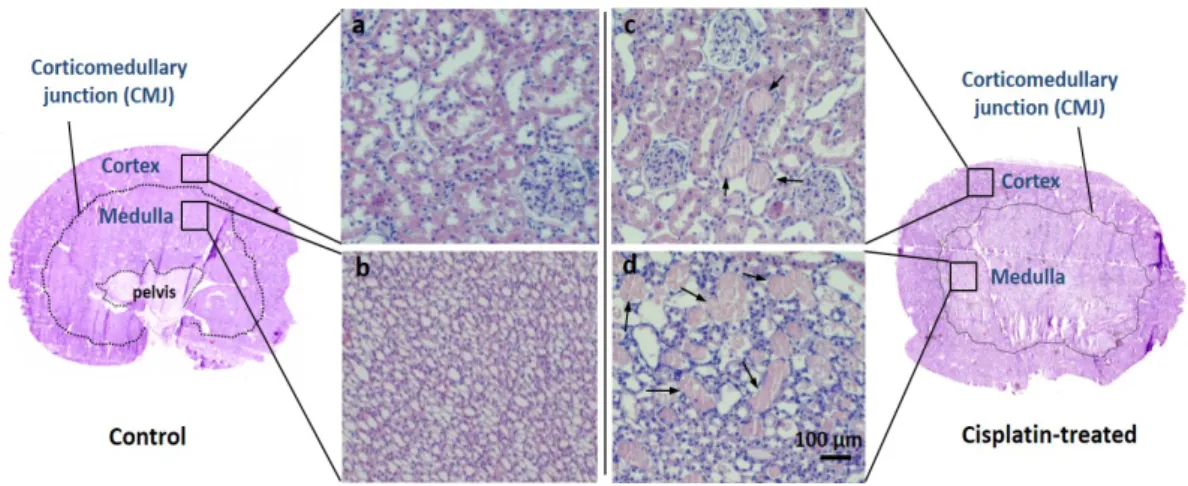
However, nephrotoxicity is a limiting side effect that hinders the use of higher doses to maximize its antineoplastic effects. Cisplatin-induced nephrotoxicity involves an acute injury of the proximal tubule, where renal accumulation of cisplatin was found. Also increased lipid peroxidation and impaired cell membrane integrity with altered lipid profile of the kidney were reported.
Previous works have shown that lipid imaging in kidney helped distinguish specific lipids within the kidney substructures and identify alterations occurring during kidney diseases. This evolved the motivation to map the lipid composition of the kidney tissue in cisplatin-treated rats to shed light on the lipid alterations occurring in cisplatin- induced nephrotoxicity and the biochemical and pathophysiological processes involved.
In the first part of this work, a robust method for imaging of lipids in rat kidney sections using MALDI-LTQ-Orbitrap was developed. To enhance the method sensitivity,
evaluating the matrix compound of choice and optimizing the deposition of the matrix solution were considered. Following the developed method, imaging measurements of kidney sections of healthy control and cisplatin-treated rats were performed utilizing the high performance of the Orbitrap mass analyzer. Its high mass resolution and accuracy enabled database assignment of the lipid species based on their exact mass.
The identification of lipids was confirmed by on-tissue MS/MS followed by fragment ion imaging. The distribution comparison of renal lipids in control and cisplatin-treated tissues revealed clear differences, which could be correlated to the proximal tubule injury. The findings highlight the usefulness of MALDI MSI as potential complementary tool for clinical diagnostics, which might contribute to the understanding of lipid signaling pathways and mechanisms involved in cisplatin- associated nephrotoxicity.
However, the demonstrated differences in the distribution of kidney lipids in control and cisplatin-treated groups have mainly considered qualitative aspects. The use of ion images for reliable intersample comparison on relative quantitative basis was limited by the variable influence of experimental and instrumental conditions. In addition, sample-originated matrix effects including tissue surface microenvironment, result in inhomogeneous matrix-analyte crystal formation. Consequently, non-linear variability in extraction, desorption and ionization of analytes across the tissue could be found.
Accordingly, the challenge to develop a method for normalization of lipid signals in kidney tissues, arose. The work strategy was designed with the aim to allow relative quantitative comparison of lipid intensity in MALDI imaging measurements of different kidney samples. It utilized a mixture of the MALDI matrix and dual lipid- metal internal standards. To ensure homogenous and reproducible deposition, the mixture was automatically applied by means of a commercially available inkjet printer, avoiding expensive matrix deposition devices. The lipid internal standard was used to normalize the signal intensity of tissue lipids, whereas the metal internal standard allowed to confirm the consistency of the matrix and internal standards application. The latter being monitored by total metal content determination using inductively-coupled plasma mass spectrometry (ICP-MS). Normalization of lipids signals demonstrated excellent image correction with respect to variability of laser energy deposition observed in MALDI tissue imaging measurements. Applying the method to normalize
ion intensities of kidney lipids in control and cisplatin-treated rats successfully enabled the comparison of lipid images in both groups on relative quantitative basis.
The results conclude the ICP-MS-controlled application of matrix and internal standards as crucial, when relative quantitative comparison of MALDI MSI data is intended. They also foresee the use of multimolecular internal standards extended to a wider range of lipid classes to be of great potential for MALDI imaging of tissue lipids, enabling improved pixel-based normalization of different lipid species simultaneously.
Zusammenfassung
Massenspektrometrie Imaging (MSI) hat sich zu einem unverzichtbaren Werkzeug für die Untersuchung der räumlichen Verteilung von Molekülen in einer Vielzahl von komplexen biologischen Proben entwickelt. Es nutzt die Vorteile moderner Massenspektrometer einschließlich verbesserter Empfindlichkeit, Massengenauigkeit und Auflösungsvermögen, um Bilder zu erzeugen, die Gewebebiologie visuell darstellen. Dies trägt zum Verständnis komplexer biochemischer Prozesse bei, indem es die Identität von molekularen Einheiten und deren Gewebeverteilung aufdeckt.
Seit der Einführung von MSI ist die Matrix-unterstützte Laser-Desorption Ionisation (MALDI) zu einer dominierenden Bildgebungsmethode der MS geworden, die sich als nützlich erwiesen hat, um die Komplexität von Lipidstrukturen in biologischen Geweben zu bestimmen. Lipide sind besonders für MALDI-MSI geeignet, da sie Bestandteile von vielen biologischen Geweben sind, sie aufgrund ihrer polaren Kopfgruppen leicht zu ionisieren sind und ihr Molekulargewicht im Allgemeinen unter 1000 Da liegt, was für eine empfindliche und hochauflösende Massenanalyse optimal ist.
Die Kartierung von Gewebslipiden durch MSI trägt zum Verständnis von pathophysiologischen Veränderungen bei, die mit verschiedenen therapeutischen Behandlungen oder der Krankheitsentwicklung zusammenhängen. Ein Beispiel, bei dem dieser Aspekt besonders nützlich sein könnte, sind die Toxizitätsmechanismen von Therapeutika auf Platinbasis einschließlich des Antitumorwirkstoffs Cisplatin. Die Rolle von Cisplatin bei der Behandlung von mehreren malignen Erkrankungen beim Menschen ist gut etabliert. Die Nephrotoxizität ist jedoch ein begrenzender Nebeneffekt, der die Verwendung höherer Dosen zur Maximierung ihrer antineoplastischen Wirkungen verhindert. Cisplatin-induzierte Nephrotoxizität beinhaltet eine akute Verletzung des proximalen Tubulus, wo Nierenakkumulation von Cisplatin gefunden wurde. Auch erhöhte Lipidperoxidation und gestörte Zellmembranintegrität mit verändertem Lipidprofil der Niere wurden berichtet.
Frühere Arbeiten haben gezeigt, dass Lipid-Bildgebung in der Niere dabei hilft, bestimmte Lipide innerhalb der Nierensubstrukturen zu unterscheiden und Veränderungen zu identifizieren, die während der Nierenerkrankungen auftreten. Dies
entwickelte die Motivation, die Lipidzusammensetzung des Nierengewebes in Cisplatin-behandelten Ratten zu kartieren, um Licht auf die Lipidveränderungen zu werfen, die in Cisplatin-induzierter Nephrotoxizität und den beteiligten biochemischen und pathophysiologischen Prozessen auftreten.
Im ersten Teil dieser Arbeit wurde eine robuste Methode zur Darstellung von Lipiden in Rattennierenschnitten mit MALDI-LTQ-Orbitrap entwickelt. Um die Sensitivität der Methode zu verbessern, wurde die Matrixverbindung der Wahl untersucht und die Abscheidung der Matrixlösung optimiert. Nach dem entwickelten Verfahren wurden bildgebende Messungen von Nierenschnitten gesunder Kontroll- und Cisplatin- behandelter Ratten unter Verwendung der hohen Leistung des Orbitrap- Massenanalysators durchgeführt. Dessen hohe Massenauflösung und Genauigkeit ermöglichte die Datenbankzuordnung der Lipidspezies basierend auf ihrer genauen Masse. Die Identifizierung von Lipiden wurde durch MS / MS im Gewebe, gefolgt von Fragment-Ionen-Bildgebung, bestätigt. Der Verteilungsvergleich der Nierenlipide in Kontroll- und Cisplatin-behandelten Geweben zeigte deutliche Unterschiede, die mit der proximalen Tubulusverletzung korreliert werden konnten. Die Ergebnisse unterstreichen die Nützlichkeit von MALDI MSI als potentielles komplementäres Werkzeug für die klinische Diagnostik, das zum Verständnis von Lipid-Signalwegen und Mechanismen, die an Cisplatin-assoziierter Nephrotoxizität beteiligt sind, beitragen könnte.
Die nachgewiesenen Unterschiede in der Verteilung von Nierenlipiden in Kontroll- und Cisplatin-behandelten Gruppen haben jedoch hauptsächlich qualitative Aspekte berücksichtigt. Die Verwendung von Ionenbildern für einen zuverlässigen Vergleich zwischen Proben auf relativer quantitativer Basis wurde durch den variablen Einfluss von experimentellen und instrumentellen Bedingungen begrenzt. Darüber hinaus führen aus den Proben stammende Matrixeffekte, einschließlich der Mikroumgebung der Gewebeoberfläche, zu einer inhomogenen Matrix-Analyt-Kristallbildung. Folglich konnte eine nichtlineare Variabilität bei der Extraktion, Desorption und Ionisierung von Analyten im Gewebe gefunden werden.
Dementsprechend bestand die Herausforderung, ein Verfahren zur Normalisierung von Lipidsignalen in Nierengeweben zu entwickeln. Die Arbeitsstrategie wurde mit dem Ziel entwickelt, einen relativen quantitativen Vergleich der Lipidintensität in MALDI-
Bildgebungs-Messungen verschiedener Nierenproben zu ermöglichen. Es verwendete eine Mischung aus der MALDI-Matrix und zwei Lipid-Metall-internen Standards. Um eine homogene und reproduzierbare Abscheidung zu gewährleisten, wurde die Mischung automatisch mittels eines handelsüblichen Tintenstrahldruckers aufgebracht, wobei teure Matrixabscheidungsvorrichtungen vermieden wurden. Der interne Lipidstandard wurde verwendet, um die Signalintensität von Gewebslipiden zu normalisieren, während der interne Metallstandard die Konsistenz der Matrix und die Anwendung interner Standards bestätigte. Letzteres wird durch Bestimmung des Gesamtmetallgehalts unter Verwendung von Massenspektrometrie mit induktiv gekoppeltem Plasma (ICP-MS) überwacht. Die Normalisierung der Lipidsignale zeigte eine ausgezeichnete Bildkorrektur in Bezug auf die Variabilität der Laserenergieablagerung, die bei MALDI-Gewebebildgebungsmessungen beobachtet wurde. Die Anwendung der Methode zur Normalisierung der Ionenintensitäten von Nierenlipiden in Kontroll- und Cisplatin-behandelten Ratten ermöglichte den Vergleich von Lipidbildern in beiden Gruppen auf relativer quantitativer Basis.
Die Ergebnisse schließen die ICP-MS-kontrollierte Anwendung von Matrix- und internen Standards als entscheidend ab, wenn ein relativer quantitativer Vergleich von MALDI-MSI-Daten beabsichtigt ist. Sie sehen auch die Verwendung von multimolekularen internen Standards, die auf einen breiteren Bereich von Lipidklassen erweitert werden, als großes Potenzial für die MALDI-Bildgebung von Gewebslipiden vor, was eine verbesserte pixelbasierte Normalisierung verschiedener Lipidspezies gleichzeitig ermöglicht.
Contents
1 Introduction ... 1
1.1 Mass Spectrometry Imaging - MSI... 1
1.2 Desorption and ionization techniques in MSI... 5
1.2.1 Secondary Ion Mass Spectrometry - SIMS ... 5
1.2.2 Desorption Electrospray Ionization - DESI ... 6
1.2.3 Matrix-Assisted Laser Desorption Ionization - MALDI ... 7
Matrix selection and application ... 10
Lasers ... 13
Desorption and ionization ... 14
Mass analysis ... 17
MSI software ... 19
MSI data processing ... 20
Biological applications of MALDI MSI ... 23
1.2.4 Laser Ablation Inductively Coupled Plasma - LA-ICP ... 26
1.3 Multimodal imaging ... 27
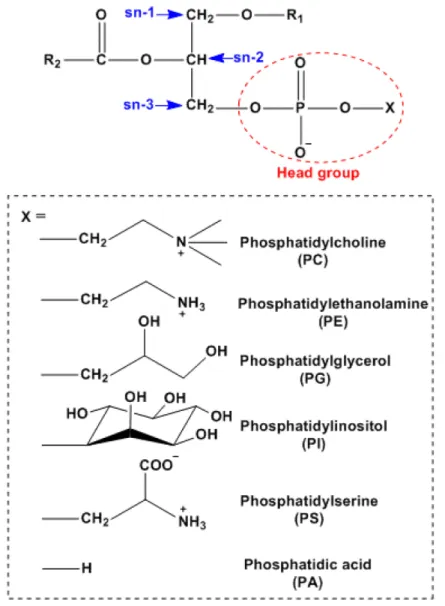
1.4 Lipids and lipidomics ... 29
1.4.1 Lipids ... 29
Glycerophospholipids (GPLs) ... 30
1.4.2 Lipidomics ... 31
Mass spectrometry-based lipidomics approaches ... 33
1.4.3 Bioinformatics tools in lipidomics ... 35
2 Aims and scope ...37
3 Results and discussion ...39
3.1 Lipid imaging by MALDI LTQ Orbitrap mass spectrometry in kidney sections under cisplatin treatment ... 39
3.1.1 Overview ... 39
3.1.2 Histopathological assessment of cisplatin-induced renal damage ... 40
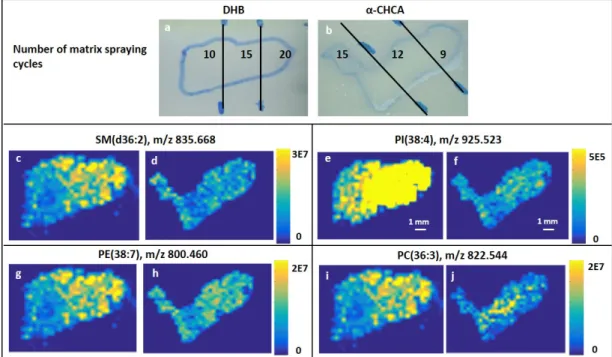
3.1.3 Evaluation of the matrix of choice ... 41
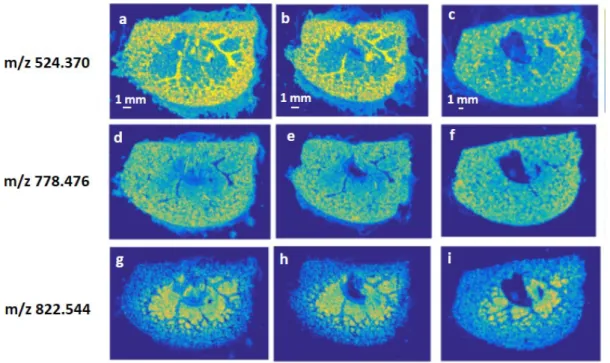
3.1.4 Assessment of reproducibility ... 45
3.1.5 Assignment of lipids ... 46
3.1.6 The role of high resolution MS (HRMS) and MS/MS imaging ... 47
3.1.7 Lipid imaging for screening of cisplatin-induced effects ... 51
3.1.8 Significance of cisplatin-induced alterations of tissue lipids ... 59
3.1.9 Conclusion and outlook ... 60
3.2 Dual internal standards with metals and molecules for MALDI imaging of kidney lipids ... 61
3.2.1 Overview ... 61
3.2.2 Optimization of printing conditions and customized ink ... 63
3.2.3 Reproducibility under optimized printing parameters and uniformity of internal standard on-tissue distribution ... 68
3.2.4 Proof of concept ... 69
Instrumental drifts ... 69
Methodological drifts ... 72
3.2.5 Application for intratissue or intrameasurement correction ... 76
Effect of the internal standard adduct type and chemical class ... 76
Structure and condition of the tissue ... 80
3.2.6 Application for intersample or intermeasurement correction ... 81
3.2.7 Conclusion and outlook ... 86
4 Materials and methods ...88
4.1 Lipid imaging by MALDI LTQ Orbitrap mass spectrometry in kidney sections under cisplatin treatment ... 89
4.1.1 Chemicals and reagents ... 89
4.1.2 Animal treatment and tissue preparation ... 89
4.1.3 Histological hematoxylin and eosin staining ... 90
4.1.4 MALDI matrices ... 90
4.1.5 Matrix application ... 91
4.1.6 Instrumentation ... 92
4.1.7 Molecular identification and nomenclature of tissue lipids ... 93
4.2 Dual internal standards with metals and molecules for MALDI imaging
of kidney lipids ... 93
4.2.1 Chemicals ... 93
4.2.2 Animals treatment and tissue preparation ... 94
4.2.3 Matrix- internal standards mixture preparation ... 94
4.2.4 Inkjet printing of matrix-internal standards mixture ... 95
4.2.5 MALDI MSI measurements ... 96
4.2.6 Direct injection and laser ablation ICP-MS analysis ... 96
Direct infusion ICP-MS ... 96
LA-ICP-MS... 97
5 Abbreviations ...99
6 References ...101
1
1 Introduction
1.1 Mass Spectrometry Imaging - MSI
Mass Spectrometry Imaging (MSI) is an innovative development of mass spectrometry which emerged as a promising technique in many areas, including biomedical sciences, material sciences and forensics, owing to its high chemical specificity and relative ease of application[1-3]. MSI techniques were introduced into the biological sciences at the end of the 20th century[4], since then it has witnessed numerous methodological and technological developments and positioned itself in the focus of mainstream mass spectrometry (MS).
MSI could be defined as a label-free molecular imaging technique, which allows in situ analysis of molecules in complex biological samples. It provides high-resolution images of biomolecules directly from tissue sections utilizing two important features.
The first is the chemical specificity of mass spectrometry, which allows determining the mass of biomolecules (m/z) without prior labelling commonly required for other imaging techniques, such as fluorescence, radioimmunoassays, among others.
Secondly, the spatial arrangement of biomolecules in the measured sample could be indicated, allowing visualization of molecular distribution. Hence, MSI made possible the direct identification and localization of a wide range of molecules, including pharmaceuticals, metabolites, lipids, proteins, and peptides on the surfaces of various types of complex samples, in a scale range extending from subcellular dimensions to whole biological systems.
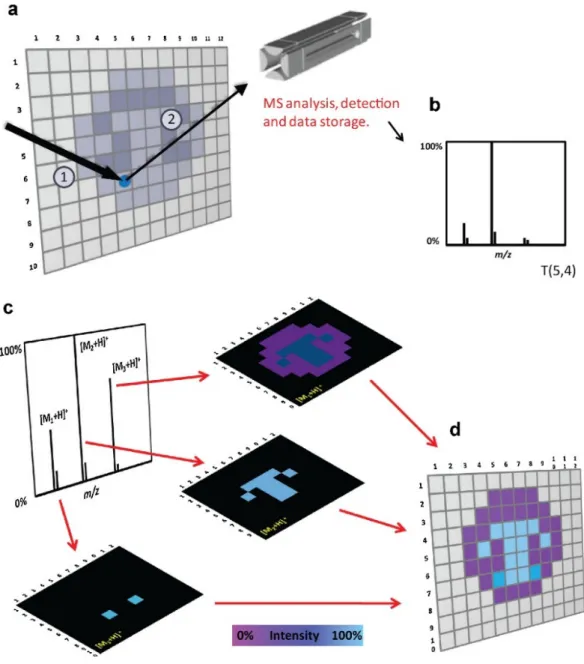
In principle, the imaging process in biological research is carried out by rastering a mass spectrometric microprobe across the sample surface in a predefined pattern. Each spot at which the probe is fired, biomolecules are desorbed and ionized from the surface and a mass spectrum is created, which is stored along with its relative position[5]. Once acquisition is complete, imaging software is employed to create MS images, in which individual ions can be extracted and displayed as a function of intensity versus relative position, where changes in color represent changes in intensity. The general principle of a typical MSI experiment is illustrated in Figure 1.
2
Figure 1. General principle of MSI methods. (a) In a typical MSI experiment, the total area is theoretically subdivided into pixels that are individually inspected (1 and 2 represent the steps desorption and ionization process). (b) For each pixel a single mass spectrum or the average of several mass spectra is collected and stored together with its spatial coordinates. (c) After the entire surface is scanned, an average mass spectrum can be created. The distribution of specific ions can be visualized by the creation of chemical images where the color scale (false color) represents the normalized intensity of particular ions. Each pixel from the image is associated with the original mass spectrum/spectra acquired at the specific point. (d) The aim of imaging is to display the distribution of chemicals across a surface. (Adapted from Wu et al.[1])
3
A number of desorption and ionization techniques have been introduced in MSI studies of biological samples. The most established ones are matrix assisted laser desorption ionization (MALDI), desorption electrospray ionization (DESI), and secondary ion mass spectrometry (SIMS). Other emerging techniques in MSI exist, which are mostly derivatives or modifications of the major methods listed above, such as nano-DESI, laser ablation electrospray ionization (LAESI), and liquid extraction surface analysis (LESA)[6, 7]. Also, laser ablation inductively coupled plasma MS (LA-ICP-MS) is one of the desorption and ionization techniques that is gaining popularity for MSI. This technique is capable of quantitative imaging of elemental distributions generated from surfaces[3].
Irrespective of the imaging modality, MSI could be generally described as a three-step process which involves sample preparation, data acquisition, and data analysis[1, 3].
All three components should be controlled and optimized to obtain meaningful MSI data. In the following, the three components of MSI are briefly described.
Sample preparation aims mainly at maintaining the integrity and the spatial arrangement of the molecular species within the biological sample. Collection and treatment procedures need to be sufficiently fast to prevent tissue degradation. It is worth to state that sample preparation varies largely depending on the ionization technique. DESI and SIMS require minimal sample preparation, whereas MALDI implies application of the matrix, as will be discussed later with respect to each ionization method. MSI studies reported the use of various types of biological samples, including single cells[8-11] bacterial colonies[12, 13], tissues from different plants[14- 17] or animal organs[18, 19] and rodent whole body sections[20-23]. Samples might be fresh, snap-frozen[24], alcohol preserved[25], or formalin-fixed paraffin-embedded (FFPE)[26].
Data acquisition involves the stages of desorption/ionization, mass analysis and ion detection (Figure 1a, b). Desorption and ionization of molecules from the sample surface could be achieved using a laser beam in case of MALDI, a primary ion beam in case of SIMS, or a charged droplet flux in case of DESI (Figure 2).
In MSI, data acquisition is either performed in the microprobe mode or the microscope mode. The microprobe mode is by far more frequently used. In this approach, the surface of the sample is theoretically divided into small areas (pixels). All pixels are
4
scanned individually in sequence by the desorption/ionization probe, which is adjusted to provide the desired spatial resolution. The data collected from each pixel is represented in a mass spectrum or an average of two or more mass spectra acquired from the specific spot[3]. The alternative microscope mode makes use of astigmatic projection of ions generated at the sample surface to a position-sensitive (two- dimensional) detector, which allows the simultaneous imaging of a larger area. This method allows higher speed of analysis, but the specific ion optics required and the restriction to perform imaging under vacuum conditions limits its application[1].
The ionized molecules are subsequently directed into the mass analyzer where they are separated and detected according to their m/z ratio. Several types of mass analyzers can be interfaced with these desorption and ionization sources including Time Of Flight (TOF), Fourier Transform Ion Cyclotron Resonance (FTICR), linear triple quadrupole, quadrupole ion-trap, or Orbitrap[3].
Data collected from MSI yield high resolution molecular profiles across the tissue.
Datasets can contain hundreds to thousands of peaks with data files of up to a few gigabytes[27], which requires complex visualization software. MSI software has been developed to control data processing in order to generate ion images, minimize manual investigation, and provide standardized protocols for routine analysis[3, 28].
FlexImaging and ImageQuest are examples of commercial MSI software, while Biomap, Image J, MSiReader are freely available sources.
Figure 2. Working principle of different ionization sources in MSI. (A) Desorption electrospray ionization (DESI), (B) matrix-assisted laser desorption/ionization (MALDI), and (C) secondary ion mass spectrometry (SIMS). (Adapted from Addie et al.[7])
5
1.2 Desorption and ionization techniques in MSI
A recent survey conducted within MSI practitioners showed that MALDI is by far the most utilized technique, while DESI and SIMS are significantly less popular[29]. This section presents an overview on the three molecular MSI methods mentioned above. A brief overview of SIMS and DESI is followed by a detailed discussion of MALDI which is the MSI technique used in this work. In addition, a short description of the elemental MSI method, laser-ablation-inductively coupled plasma (LA-ICP), is given.
1.2.1 Secondary Ion Mass Spectrometry - SIMS
SIMS is a desorption and ionization technique used for MSI which utilizes a primary ion beam (e.g. metal ions) to produce secondary ions from the surface of the sample.
The surface of the sample under high vacuum is bombarded with a high energy primary ion beam (typically 5-25 keV)[30]. This primary ion beam can be focused as sharply as 50 nm or less, depending on the primary ion beam current and the charge state of the primary ions[3]. A collisional cascade within ≈ 10 nm of the surface is initiated. The energy transfer to the molecules deposited on the surface causes their extensive fragmentation, since the energy of primary ions is substantially high compared with bond energies of the surface molecules.
When moving away from the primary collision site, less fragmentation occurs and a small fraction of intact molecules is subsequently ejected from the first layers of the surface if the surface binding energy is overcome. Most molecules are emitted as neutrals and only approximately 1% of them are charged, which are called the secondary ions[30]. Both negative and positive secondary ions can be generated depending on the electron configuration of the surface molecules. Primary ions could be either monoatomic (Ar+, Ga+, In+, Au+, Bi+) or polyatomic (C60+, Bi3+, Aun+)[31, 32].
The latter are considered softer allowing desorption of secondary ions from the sample surface without extensive fragmentation (softer). Consequently, polyatomic ion beams are more suitable for the analysis of intact biomolecules from tissue surfaces and their applications extend to larger molecular weight species[2, 33].
The sample preparation protocol for the SIMS imaging experiment requires only mounting of the tissue section on conductive surface (e.g. indium tin oxide (ITO)- coated glass slide), without further washing steps.
6
The sample must be stable under high vacuum conditions, which ensures that both the primary and secondary ions travel from their origin to their final destination without undergoing collisions[3]. Due to its excellent spatial resolution capabilities, SIMS applications extended to imaging studies of small biomolecules in unicellular organisms[33], single cells[34], embryos[35], and different organs such as kidney[36]
and brain[37]. Limitations of SIMS include the lack of sensitivity of the mass range over 1000 m/z, due to in-source fragmentation of complex molecules. This also results in complex mass spectra which might be difficult to interpret. In addition, commercially available SIMS instruments have limited capability of molecules identification because they have neither the capacity to perform MS/MS fragmentation, nor they provide sufficient mass resolution required for high-resolution imaging[30, 38, 39].
1.2.2 Desorption Electrospray Ionization - DESI
The relatively new ionization method developed by R.G. Cooks in 2004[40], DESI, belongs to the ambient ionization methods, in which ionization occurs at atmospheric pressure with the samples being analyzed in their native state[41].
DESI is a combination of two MS ionization methods: electrospray ionization (ESI) and desorption ionization (DI). It uses energetic charged electrospray solvent droplets to desorb the molecules from the sample surface.
As the charged droplets strike the sample surface, they extract surface-bound analytes that are then desorbed from the surface within scattered secondary droplets. Upon solvent evaporation, these droplets lead to the formation of intact analyte ions that are transported from the surface into the MS inlet[42]. The ionization of biomolecules in DESI takes place in a manner similar to ESI, hence, the soft ionization yields analyte ions with minimal fragmentation which could be multiply charged. The analysis is usually limited to a mass range of 2000 Da and a lateral resolution of about 50 µm[43].
Advantages of DESI include ambient analysis conditions and the possibility to perform tandem mass spectrometry (MS/MS) and accurate mass measurements, which allows the identification of analytes. In addition, DESI – like SIMS – requires minimal sample preparation, which could be problematic leading to analyte delocalization or chemical modification of endogenous compounds[1]. On the other hand, a limitation of DESI is the physical damage encountered by biological samples on a microscopic scale during
7
DESI imaging, when a conventional solvent system such as MeOH:H2O is used.
Depletion of tissue samples was necessary to obtain sustainable abundant signals and high quality images of biomolecules in tissues[44]. Nevertheless, recently developed solvent systems such as ACN:DMF and EtOH:DMF (1:1) have shown to provide abundant signal and high quality DESI images for lipids while preserving tissue morphology and protein content of biological tissues. These non-aqueous
‘‘morphologically friendly” solvent systems are non-destructive allowing analysis in sequence using immunohistochemistry and MALDI imaging to be performed on the same tissue section after DESI-MS imaging[45]. Recent DESI applications include the profiling of lipids for characterization of tumorigenesis[46], the analysis of colorectal adenocarcinoma tissue[47], and the study of endogenous and drug metabolites[48].
1.2.3 Matrix-Assisted Laser Desorption Ionization - MALDI
Biomolecular imaging using MALDI was first described in 1994 by Spengler et al.[49]
and later in more details in 1997 by Caprioli et al.[4], nowadays it is the most widely used MSI method[38]. It is a soft ionization technique that is capable of producing intact higher molecular weight ions using a pulsed laser beam combined with energy absorbing matrix molecules.
An outline of the technique goes typically as follows (Figure 3); a matrix solution is applied to cover the sample surface, which is commonly a thin tissue section. The matrix, which is a low molecular weight organic compound possessing suitable chromophores to absorb the energy of UV laser beam, is usually applied in high excess relative to the concentration of surface analytes. On-tissue application of the matrix solution results in in-situ extraction of biomolecules from the sample surface.
Subsequently, evaporation of the solvent causes crystallization of the matrix molecules and incorporation of analyte biomolecules into the formed crystals. As the laser beam irradiates the sample surface, the matrix crystals absorb the majority of the laser energy, leading to explosive desorption of the matrix crystals, incorporating the analyte into the gas phase without its degradation. The matrix facilitates the ionization of analyte molecules in the gas phase as well. For each location where the laser hits the sample surface, mass signals of the desorbed ions are acquired in a mass spectrum. A data set consisting of an ordered array of mass spectra is created, where each spectrum represents the local molecular composition at known x,y coordinates. The intensities of
8
the molecular masses (m/z values) of specific compounds in each spectrum can be extracted to produce images showing the localization of the molecules within the tissue[39].
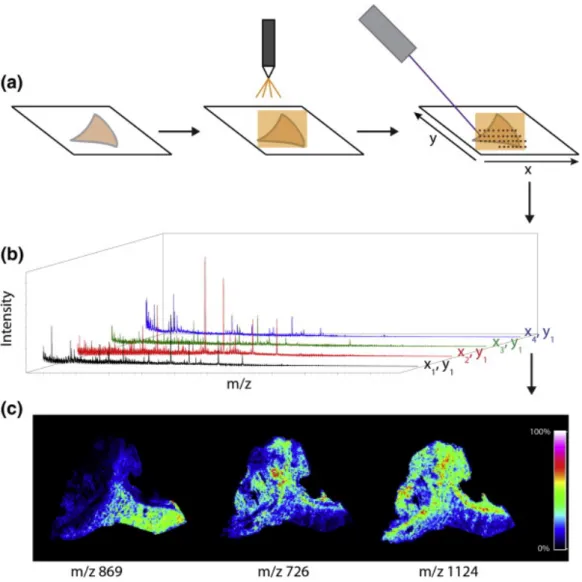
Figure 3. Overview of the MALDI IMS workflow on a section of a human kidney biopsy. (a) Fresh frozen tissue is cut and mounted on a glass slide. Matrix is applied by a robotic sprayer or is sublimated, and the section is irradiated by the laser in a raster array. (b) Mass spectra are acquired for each x,y coordinate. (c) Selected ions may be mapped on the tissue surface to create ion images. (Adapted from Gessel et al. [50])
This section overviews the MALDI MSI pipeline, including sample preparation, matrix selection and application, desorption and ionization processes, lasers, mass analyzers, and data processing. Finally, applications of MALDI for biomolecular imaging are discussed.
9 Sample preparation
Sample preparation pipeline encompasses all handling of the samples starting with collection until analysis. Developing sample preparation protocols aims mainly at maintaining the spatial integrity of biomolecules in the sample. Variation in sample preparation results in variation in ion generation, hence careful optimization is necessary to maintain sensitivity, accuracy and reproducibility of the analysis. Sample preparation includes collection (cutting, mounting, storage), processing (washing, digestion, derivatization), and finally matrix application. The work in this thesis exclusively uses tissue sections of animal origin. Hence, the most common procedures for sample preparation with respect to animal tissues are discussed.
Collection
Fresh frozen tissues are ideally suited for MALDI MSI studies[50]. It is important to minimize the time between harvesting the sample and its preservation to reduce sample degradation by endogenous enzymes. Commonly, a cryogen like liquid nitrogen allows snap freezing of the biological samples for stabilization. A snap-frozen tissue can be stored at temperatures below -70 °C for a minimum of one year without detrimental effects on the quality of MALDI MSI results[51]. Another possibility to preserve samples is fixation (e.g. formalin-fixed tissues), which is ubiquitously used for clinical studies and a huge amount of archived fixed samples already exists. However, it is not optimal for tissue preservation in MALDI imaging studies, because there is no control of molecules diffusion during fixation, in addition to the problematic mass spectrometric analysis of the cross-linked proteins[52]. Methods useful for the analysis of formalin-fixed samples have been described to leverage this vast source of information[53].
After biological samples are collected, they are cut through using a cryostat microtome into thin sections (3-20 µm) with the aim of obtaining a flat and even surface, for optimum imaging results[54]. It is required to optimize the cutting temperature and the tissue thickness individually for the different tissue types[50]. Sometimes it is required to embed fragile or small tissues in an embedding medium to support their sectioning.
Classically, optimal cutting temperature compound (OCT) is the medium of choice for histopathological studies. However, it is not suitable for MALDI MSI since it ionizes
10
and causes up to 50% signal suppression due its high abundance[55]. Alternative embedding media like gelatin and carboxymethylcellulose (CMC) showed to interfere less with the analysis. Subsequently, tissues are mounted on the sample holder, which could be a glass slide, or a conductive surface in case of MALDI-TOF instruments (e.g.
ITO glass slides), and stored at temperatures below -70 °C until analysis.
Processing
Before application of the matrix, optional processing of the samples can include some pretreatment steps. The processing protocol is tailored and validated according to the target analytes and could significantly improve the results of the analysis. This includes drying, washing, on-tissue digestion, and derivatization.
After the removal of tissue sections from the freezer for analysis, they are dried to lessen instability by several methods, e.g. vacuum desiccation[56] or air under a stream of nitrogen[57]. Tissue washing should be carefully optimized because it directly affects composition and localization of the analytes within the sample. It is usually considered to remove ionization-suppressing small molecules and lipids during the analysis of proteins and peptides[58]. In some cases, on-tissue enzymatic digestion is needed to overcome the low sensitivity of the imaging analysis of intact proteins. This is particularly useful for formalin-fixed paraffin-embedded (FFPE) tissues, to liberate peptides from the cross-linked proteins[59]. Enzyme are either spray-coated in the same manner as the matrix, or applied using an automatic spotting instrument[60]. Also, different strategies for on-tissue chemical derivatization were introduced to imaging studies, to improve detection of low molecular weight drugs within tissues, where poor ionization efficiency, isobaric endogenous compounds, or ion suppression complicate the analysis[61]. Derivatization is relatively a new approach and of limited application due to variations in reactions yields and side reactions.
Matrix selection and application
Matrix application plays an important role in successful MALDI MSI analysis. Lateral resolution and detectability of the analytes are strongly decided by the choice of matrix and its method of application. Generally, the matrix coat applied to the sample surface should be very homogenous providing crystal structure size that matches the diameter of the laser beam to guarantee high quality ion images. The basic strategy is to apply
11
the matrix in a quickly evaporating solvent to extract the analyte, ensure proper crystallization, and minimize analyte diffusion[54].
Selection of matrix and solvent
The matrix solution commonly includes three components, the matrix compound, the solvent, and triflouroacetic acid, which is added in many cases to promote ionization.
The MALDI matrix is typically a low molecular weight organic acid with strong absorbance at the wavelength of the laser used. Many matrices proved useful for different compound classes[39, 54], however, the three most commonly used matrices for MALDI MSI are 2,5-dihydroxybenzoic acid (DHB), α-cyano-4-hydroxycinnamic acid (α-CHCA), and 3,5-dimethoxy-4-hydroxycinnamic acid (SA, sinapic acid)[59], as shown in Table 1. While SA is most suitable for the analysis of proteins, DHB and α- CHCA are more suited for peptides, lipids and lower molecular weight analytes.
Ideally, several matrices with different solvent composition should be experimented in both positive and negative ion modes to specify which matrix is the best for a certain analyte. The choice of solvent can cause significant differences in the properties of crystallization of matrices on the surface tissue sections[62]. Different combinations of water and organic solvents like, methanol, acetonitrile, acetone, and isopropanol are commonly used. A 50% organic solvent solution is a proper starting point for testing and optimization[55].
Other nontraditional matrices include ionic liquid matrices[63] (e.g. α-CHCA acid with 2-amino-4-methyl-5-nitropyridine), inorganic metal matrices (e.g. gold nanoparticle[64], colloidal graphite[65]), in addition to matrix-free approaches[66].
These methods have their strengths and weaknesses, however, they are less common due to limitations regarding sensitivity and applicability to a wide range of target compounds[59].
12
Compound Structure Application
DHB (2,5-
Dihydroxybenzoic acid)
Peptides Lipids
Oligonucleotides Carbohydrates
α-CHCA (α-Cyano-4- hydroxycinnamic acid)
Peptides
Pharmaceuticals Lipids
Oligonucleotides
Sinapic acid, SA (3,5-Dimethoxy-4- hydroxycinnamic acid)
Proteins Peptides
Methods of matrix application
Matrix coating can be either discrete, which is more common to profiling applications, or continuous. Discrete matrix application has the advantage of limited analyte diffusion and is usually performed using automated piezoelectric spotters dispensing picoliter volumes of the matrix solution[54]. Continuous matrix application is the mode used for MALDI imaging.
It can be performed by a number of methods like, spray-coating, electrospray deposition, or solvent-free dry matrix application (e.g. sublimation, sieving)[68].
Table 1. Chemical name, structures, and application of common matrices used in MSI analysis[67].
13
Manual spray-coating using a pneumatic airbrush sprayer is cost-effective, nevertheless, it is difficult to standardize across multiple samples and laboratories because it is subjective and depends on the skills of the analyst. Automatic spraying of the matrix is the method of choice for the majority of MALDI MSI community because it overcomes the lack of reproducibility associated with manual spraying. A number of commercially available robotic sprayers having almost the same working principle is available on the market[59]. The matrix solution is sprayed as fine aerosol and allowed to deposit on the tissue surface. The coat is allowed to dry and several iterations are normally needed to obtain enough amount of matrix for the analysis.
Other less common methods for matrix application in MALDI MSI include sublimation, which produces uniform very small matrix crystals making it suitable for high resolution imaging[59]. Also, the use of commercial desktop inkjet printers provided a low-cost method utilizing the same principle of automated chemical spotters[69]. Automatic spotters cover the samples surface with a spaced array of small matrix droplets (picoliter volumes) providing both automated uniform matrix coating and sufficient permeation into the tissue[68].
Lasers
MALDI MSI studies reported the use of ultraviolet (UV) and infrared (IR) lasers. UV- MALDI is the most widely used mode. It commonly utilizes nitrogen (N2) gas lasers because they are simple, small-sized, and relatively low in cost. Their emission wavelength (λ = 337 nm) is close to the absorption maximum of many commonly used matrices such as DHB, α-CHCA, and SA. Disadvantages of N2 lasers include limited pulse repetition frequency (< 100 Hz). Also, their relatively short lifetime (total number of emissions ≤108 which normally correlates to ≤2 years) limits their application in high-throughput analysis[70]. For such type of applications, frequency-tripled Nd:YAG solid state lasers (λ = 355 nm) having longer time spans are used. The Nd:YAG lasers also provide more sensitive MALDI MSI analysis due to achievable repetition rates of up to 1000 Hz[71].
IR-MALDI is relatively less common. It utilizes liquid matrices providing better spectral reproducibility in comparison to UV-MALDI, which mostly uses solid state matrices with relatively high degree of heterogeneity depending on analyte-matrix co-
14
crystallization[72]. Examples for IR lasers employed in MALDI MSI studies include pulsed erbium solid-state lasers (Er:YAG, λ = 2.94 µm and Er:YSGG, λ = 2.79 µm).
Desorption and ionization
The desorption and ionization processes in MALDI are extremely complex involving a large number of intertwined physical and chemical events and have been the focus of many research groups[73, 74]. A comprehensive discussion of these events is beyond the scope of the thesis. Hence, only a brief overview follows in the next paragraphs.
Desorption
Desorption of the matrix and analyte occurs when a sufficient energy density is achieved through short pulse durations (ns) of the laser. Energy deposition is affected by a number of parameters including sample properties, matrix absorption, sample surface characteristics, and most importantly, the laser fluence (J cm-2) [74]. Generally, a rapid phase transition of the bulk matrix-analyte material from solid to gas occurs leading to disintegration of the top layers. The disintegration event may be characterized as ‘‘desorption’’ or ‘‘ablation,’’ depending on the laser fluence. In the desorption regime, the solid to gas transition is smooth at the top surface of the sample, and the emitted material contains little or no condensed particles, droplets or clusters.
At higher ablative fluences, the sample is sufficiently overheated that subsurface nucleation occurs, leading to ‘‘phase explosion’’ which is turbulent and frothy. This ejects condensed material consisting of particles and clusters. According to literature, MALDI is often performed in the ablation regime[68, 73, 75, 76].
Ionization
Much research has focused on the specific mechanisms of the MALDI ionization processes and numerous theories and models have been proposed. A consensus that supports the idea of several processes occurring and not just one single event, has been reached.
These competing processes are evidenced by the presence of a variety of ionized species in the mass spectrum that may be protonated, deprotonated, cationized, or radicals[77- 82]. It is generally accepted that ion formation follows a two-step model. Primary ionization is the first step, it refers to ions produced from the neutral molecules of the
15
sample surface and it mostly involves a contribution of the matrix. Ion-molecule reactions in the desorption/ablation plume follow, giving rise to secondary ions which reach the detector (secondary ionization)[83].
Whereas, various models for generation of primary ions are still somewhat divergent, mechanisms for secondary ionization have been widely accepted, as they are believed to follow basic condensed phase ‘plume’ kinetic and thermodynamic rules. Several mechanisms and models were proposed to explain the primary ionization, among which
“the cluster ionization mechanism” also known as “the lucky survivor model”[77-79], and “the photoexcitation/ pooling mechanism” known as “the coupled physical and chemical dynamics model” (CPCD)[80-82] are the most widely accepted. The key points for both models are briefly discussed.
Primary ionizaion
The lucky survivor model
Also known as “the cluster ionization mechanism”, this model proposes that the analyte ions are largely preformed in the solid matrix and considers matrix mainly as an ablation vehicle and does not contribute preformed ions. The evidence for the preformed ions in the solid matrix was observed during the preparation of MALDI samples of pH sensor dyes from solutions of different pH[84]. The solid samples retained the color of the original solution, indicating that the dye molecules had the same ionized state as in solution.
The disintegration of the solid matrix upon laser irradiation leads to the formation aggregates having an excess of positive or negative charge. Once in the expanding plume, the charged clusters dissociate and undergo extensive but incomplete neutralization in the plume by counterions leaving some ions at the end. The neutralization happens by losing neutral matrix molecules to release the analyte ions or by ejection of the ions.
For this reason, the model is called “the lucky survivors”[78], indicating that they are the ones which survived the neutralization process, and justifying the presence of the singly charged species.
16
The Coupled Physical and Chemical Dynamics model (CPCD)
This model is also known as ‘’the photoexcitation/ pooling mechanism”, and on the contrary to the cluster model, almost all primary ions are derived from the matrix. It is based on the initial photoexcitation of the matrix with consequent migration of the excitation energy within the matrix crystals. This is followed by the concentration of this energy by two sequential pooling events resulting eventually in ionization[85]. The combination of migration and pooling events is necessary because direct photoionization by two- or multi-photon absorption of matrix or matrix-analyte complexes, is less likely. This is because the ionization potentials (IP) of nearly all MALDI matrices lie above the 2-photon energy of the typical UV-MALDI lasers, even in condensed clusters where the IP is expected to drop[81]. However, this amount of energy can be concentrated on one molecule by two sequential pooling events. The model assumes that the excitation energy (known as excitons[86]) is mobile in the crystals with stacked aromatic π-electron systems of matrices. Pooling happens through redistribution of excitation energy of two neighboring molecules resulting eventually in de-excitation of one of the two molecules to the ground state and ionization of the other one. The excited states interact either in S1-S1 or S1-Sn pooling, the latter being responsible for ionization[83].
Secondary ionization
Secondary ionization starts as soon as primary ions exist, hence it could occur concurrently to primary ionization when the material is still dense allowing extensive ion-molecule reactions. It includes charge transfer between matrix and analyte and between analytes, and it occurs in the expanding plume and takes much longer in comparison to primary ionization. Changes in the density allow the collisions and interactions of the primary ions with the neutral molecules to give new ions[67, 81].
The charge transfer is assumed to be reversible and could occur through the following main reactions:
- Proton transfer: mH+ + A ↔ m + AH+ ,and (m-H)- + A → m + (A-H)- - Electron transfer: m+ + A ↔ m + A+ , and m- + A → m + A-
- Cation transfer: e.g. mNa+ + A ↔ m + ANa+ Where, m = matrix, A = analyte.
17
Mass analysis
After desorption and ionization, the analytes enter the mass spectrometer where they are separated based on their mass-to-charge ratio (m/z). MALDI ion source has been coupled to a variety of mass spectrometers for imaging applications including, time-of- flight (TOF), quadrupole ion trap, Fourier transform-Orbitrap, and Fourier transform- ion cyclotron resonance (FT-ICR) mass spectrometers.
The versatility of the of the MALDI ion source for MSI applications allowed many companies and research groups to focus on instrument and software developments, which resulted in the availability of several MALDI mass spectrometers with variable MSI capabilities on the market. The specific MSI application determines the choice of the instrument, for example, the requirements necessary for protein imaging differ largely when compared to small molecules. The important qualities that determine the choice of a MALDI MSI instrument include spatial resolution, mass range, mass resolving power, mass accuracy, sensitivity, tandem MS capabilities, throughput, and data storage[50, 59].
Classically, MALDI ion source has been coupled to TOF mass analyzers, this was largely due to the nature of the ion source, producing pulsed ion packets, which were suitably measured and analyzed using a TOF analyzer. In TOF mass analyzers, ions are accelerated to a very narrow range of kinetic energies, then separated according to their m/z in a flight tube. Although MALDI-TOF instruments offer excellent throughput, they suffer limited mass resolving power and mass accuracy essential for direct mass identification of analytes in biomolecular imaging studies. MALDI-FT-ICR and MALDI-FT-Orbitrap are on the other hand high performance alternatives, which offer high mass resolving power and high mass accuracy.
These methods have shown to resolve and identify ions at a single nominal mass that are commonly present in MALDI imaging mass spectra[87].
This work includes imaging measurements that has been mainly done using a hybrid linear quadrupole ion trap-Orbitrap instrument; MALDI LTQ Orbitrap XLTM (Thermo Scientific). The instrument can operate as a standalone version of either the linear quadrupole ion trap or the orbitrap, or as a hybrid device of both. The working principle of the linear ion trap and the orbitrap follows in the next paragraphs.
18 Linear quadrupole ion trap
The geometry of the linear ion trap could be seen in Figure 4. It consists of four electrode rods cut into three axial segments. The central section where ions are stored is longer in comparison to front and back sections, which are of equal but shorter length.
A combination of radiofrequency (RF) and direct current (DC) voltages are applied to opposite pairs of rods to trap the ions. The linear ion trap is versatile and can operate to store, isolate, dissociate the ions and then send them to the Orbitrap for further analysis (axial ion ejection). Alternatively, it can also operate as an independent mass analyzer sending the ions directly to the detector (radial ion ejection to the electron multiplier detector). It is a low resolution device that when combined to other mass analyzers offers improved space-charge capacity, increased sensitivity due to higher ion storage capacity, and more efficient ion injection[67].
Orbitrap
The Orbitrap consists of a central spindle-shaped electrode surrounded by a pair of bell- shaped outer electrodes, together they form a barrel-like shape ( Figure 5). It employs an electric field to trap the ions orbitally. The orbital motion of the ion is related to the ion kinetic energy and is used for radial trapping and not for mass analysis. In the axial direction, ions oscillate harmonically from one end of the barrel assembly to the other while they continue to orbit around the central spindle electrode. The frequency of the back-and-forth axial oscillations determines the m/z ratio[89]. Two split halves of the outer electrode of the Orbitrap detect the image current produced by the oscillating ions.
Figure 4. Basic design of the two-dimensional linear ion trap (adapted from Schwartz et al.[88])
19
By Fast Fourier Transformation (FFT) of the image current, the instrument obtains the frequencies of these axial oscillations and therefore the mass-to-charge ratios of the ions. Orbitrap is a high performance device that allows direct and accurate identification of biomolecules due to high mass resolving power [89].
Figure 5. Orbitrap mass spectrometer. Curved arrows show the stable ion trajectories.
R1 and R2 represent the electrodes radii (adapted from Makarov et al.[90])
MSI software
One of the principal goals of data analysis in MSI experiments is to determine trends in the spatial distributions of biomolecules, which can be related back to the underlying biology. MALDI MSI data sets can be many tens to hundreds of gigabytes depending on the specimen size, image resolution, and spectral resolution. This developed the need for software programs to process the highly complex MSI datasets. Generally, MSI software tools can be classified into two main categories which control either data acquisition or processing (visualization and analysis in order to generate ion images).
Data acquisition software
This type of software is designed to register the target location or region of interest defined by the user. It defines the target location by allowing the user to draw a shape around the area of interest using an optical image of the sample, and setting the spatial resolution within this area. Afterwards, automated acquisition is initiated to collect mass spectra at each position in the raster pattern. Image acquisition software could be separate or integrated in the standard instrument control software[59].
Image analysis software
After image acquisition, proper data processing and analysis of datasets is crucial for accurate interpretation of the results. The MSI dataset has a specific data format that
20
depends on the measuring instrument. Most mass spectrometers have a proprietary data format, which can be exported to the image processing software provided by the vendor such as, FlexImaging (Bruker), Tissue-View (ABSciex), and ImageQuest (Thermo).
On the other hand, a number of open source software for visualization and processing of MSI data has been described. For example, MSiReader, an open source program to view and perform data analysis of MSI data has been described[91]. It has been rapidly taken up by users and provides a Matlab interface allowing it to be adapted to individual needs. Also, OpenMSI, a Web-based open source software, provides a high-throughput solution for image data processing. Large imaging data sets can be stored and processed on a central high performance server, while users visualize the resulting images on local computers[92].
In this respect, common data formats have proven to be useful allowing data exchange between different instrumental platforms and between different image evaluation and processing software tools. Two of the most common open-source formats for MSI data are Analyze 7.5 and imzML[59]. Data analysis of MSI measurements in this work has mainly used the common data format imzML.
imzML. The initiative for developing imzML was to ensure flexible and fast handling of the MSI data, provide complete description of the MSI experiment, and minimize the data file size. It was developed to follow the standards proposed by the Human Proteome Organization- Proteomics Standards Initiative for storing mass spectrometry data. It is consistent with the existing mzML format and consists of two separate files.
The binary file (*.ibd) stores spectral data, and the (*.imzML) file stores all associated metadata. Both file types are required to fully describe the dataset[93, 94].
The imzML format has been adopted by a growing number of instrument vendors and continues to be used by developers of open-source MSI image processing software.
MSI data processing
Spectral preprocessingThe data analysis process can be generally divided into two separate processes, data preprocessing, and analysis. MALDI MSI data show experimental variance within the raw dataset. For this reason, preprocessing of the data is useful to reduce such variance before the analysis of the data in order to obtain confident conclusions and improve
21
subsequent processing. Spectral preprocessing could involve baseline correction (denoising or removal of background), realignment, normalization of intensity, and peak picking.
Baseline correction
The intensity value recorded for each element in the profile spectrum is commonly associated with a certain amount of noise or background. The amount of noise is instrument-dependent and arises from experimental fluctuations. Possible sources may arise from transient detector gain variations or statistical fluctuations in ion motions. A number of algorithms have been reported for estimating background and many commercial data analysis software packages include baseline correction modules[95].
It is worth to mention that baseline artifact is much reduced from mass analyzers that include an orthogonal mass separation stage, such as hybrid instruments[96].
Normalization
In general, it is important to normalize ion intensities to minimize differences in peak intensity between spectra, i.e. scaling each spectrum to some factor for better intercomparison of intensities between different spectra[97].
These differences in intensity values could arise from variation in instrument performance, as well as differences in sample preparation, inherent sample variability, and experimental error. Normalization has been routinely applied in many areas of mass spectrometry, especially for quantitative analysis where ion intensity is normalized against the intensity of an internal standard that has similar ionization characteristics as the analytes of interest.
For MALDI MSI, several normalization methods have been described to address the variability in signal intensity[69, 95, 98-105]. This includes the often used normalization to Total Ion Current (TIC). It is recommended that visual examination of exemplary m/z-images after TIC normalization should be considered[97], since for some MSI software, TIC normalization makes the assumption that the same number of ions will be produced from each spatial location[100, 106], which could introduce artifacts and limits the reliability of the method[95, 98]. Also, normalization to matrix related peaks[99] was used for correction of uneven matrix thickness and crystallization. However, this method assumes that endogenous biomolecules respond
22
evenly to changing matrix conditions, limiting the success of this approach as well[3].
Other methods implement normalization algorithms based on noise levels, and median signal intensity of the spectrum[98, 100]. On the other hand, the most promising approaches for MSI signal normalization seem to be those applying internal standards, enabling pixel-by-pixel correction of raw intensities[42].
Calibration and realignment
Systematic shifts that affect the whole spectrum (e.g. due to instrument fluctuations) can be compensated for with recalibration or online lock mass calibration using known ions within each spectra (e.g. matrix peaks)[107]. However, variability in the centroid m/z detected for an individual peak (mass shifts within the mass accuracy range) throughout the course of a number of replicate measurements (or between the different spectra) can cause problems for quantitative comparisons, even with a properly calibrated instrument.
Moreover, irregularities within the flatness or thickness of tissue sections boost this mass measurement variability. In such case, calibrating each spectrum to known peaks that are common to the dataset and can be recognized within the spectra (i.e. internal calibrants or landmarks), can effectively realign the spectra to ensure that comparison considers the intensity of the same ions across a number of samples. It is also important that these common peaks span the entire mass range of interest to prevent extrapolation outside of the chosen alignment points[95].
Peak picking
Peak picking is the selection of m/z values which correspond to high and relevant peaks with the aim to reduce the number of m/z values by neglecting those values corresponding to noise signals or to non-specific baseline signals[97]. Various peak picking methods for MALDI mass spectra are implemented in mass spectrometry imaging software packages. Nevertheless, this process has showed to be difficult to perform in a blind automated manner due to the presence of unresolved peaks. Hence, it is recommended to carefully visualize the results in order to validate the labeled peaks manually[59].
23 Data analysis
A list of m/z values and their corresponding intensity or peak areas extracted from each spectrum in the data set, is usually the output of the preprocessing steps previously described. Depending on the biological task under investigation, this data can be subject to a number of data-mining methods with the aim of information extraction.
A simple approach is to use the resulting list of m/z values to identify specific molecules of interest in the dataset. Then, the localization of the specific molecules (drugs, metabolites, etc.) is compared in disease-state tissue with physiological one to search for disease biomarkers. In this approach, it is beneficial to examine the resulting ion images and the histological staining images of both tissues types to link distinct molecular distributions to histological features[6].
Other data mining approaches include a set of statistical methods that allow spectral classification of the data and results in a collection of ion images and/or spectra, which show important features within the dataset.
A well-known example is principal component analysis (PCA). It is an unsupervised method that groups together peaks whose intensities are correlated in certain areas of the tissue. The output of the analysis is a set of principle components that are rank- ordered according to the amount of variance that they describe in the data.
Software developers have developed MSI software packages to facilitate the analysis of MSI data. Commercial software packages, such as Multimaging (Imabiotech, France) or SCiLS (Bruker Daltonics, Germany) can handle large-sized, multi-sample data sets and include many statistical tools for biomarker discovery[108]. Open-source software is available as well, such as MSiReader[91] or Biomap[109], but is less focused on the simultaneous analysis of several samples. Also, studies reported different in-house developed data mining approaches for MALDI MSI datasets[110, 111].
Biological applications of MALDI MSI
MALDI is currently a dominant technique in biomolecular MSI, owing to its versatility and its widespread commercial availability[7]. Several biomolecule classes including proteins, peptides, lipids, drugs, and carbohydrates have been investigated in diverse biological tissues[39].
24
In the following, a number of examples with a focus on MSI of lipids, will shed light on some areas where MALDI MSI studies of different molecule classes contributed to the understanding of biological processes.
MALDI profiling studies of proteins were reported in various cancer tissues showing protein content specific to each tumor type such as those of the brain[112] or lung[113].
Also, proteomic changes detected by MALDI profiling studies in mouse tumors, proved useful to correlate the variation in protein profiles to the disease progression, which is important for evaluation of treatment efficiency and prognosis. For neurodegenerative diseases, brain distribution of proteins led to the identification of a biomarker protein of Parkinson’s disease in a mouse model[114]. Also, molecular physiology of the eye was the subject of MALDI MSI studies, which reported the modifications and distributions of crystalline proteins in the lens and correlated this to clinical conditions like formation of cataracts[115].
Peptides were also attractive targets for MALDI MSI investigations because their peaks are generally more intense and resolved than proteins[89]. The specific distribution of amyloid peptides in brain tissue of a mouse model of Alzheimer’s disease was investigated[116]. Also, investigations of various neuropeptides were the focus of a number of MALDI MSI studies[117-119].
Application of MALDI to the imaging of pharmaceutical compounds has been of great interest to study the distribution of drugs in tissue specimens. Examples include the imaging of MRI contrast agents in fresh and fixed tissues. The distribution of the contrast agent, a Gd-containing compound, was further validated with MRI and inductively coupled plasma atomic emission spectroscopy[120]. Also, the controlled release of drugs and their distribution into the adjacent tissue by implanted medical devices (drug eluting coronary stents) was studied by MALDI MSI[121]. The distribution of tiotropium, a bronchodilator for the management of chronic obstructive pulmonary disease, that is administered via inhaled delivery, was imaged in lung tissue to better understand the distribution in lung tissue of rats[102].
MALDI MSI of lipids
Many applications of MALDI MSI focus on lipid analysis because of their diverse roles as structural components of cell membranes, their function in the surfactant cycle, and
![Table 1. Chemical name, structures, and application of common matrices used in MSI analysis[67]](https://thumb-eu.123doks.com/thumbv2/1library_info/5598970.1691017/25.892.134.760.170.849/table-chemical-structures-application-common-matrices-used-analysis.webp)
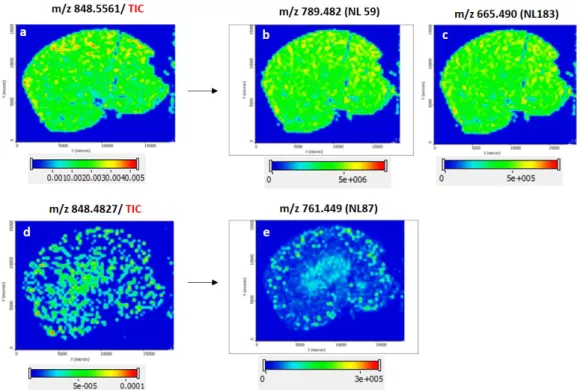
![Figure 14. (a) MALDI images of [PS(38:5) + K] + at m/z 848.4827 and [PC(38:4) + K] + at m/z 848.5561](https://thumb-eu.123doks.com/thumbv2/1library_info/5598970.1691017/62.892.145.746.92.837/figure-maldi-images-ps-k-m-pc-k.webp)