An Analysis of the Sustainability of the Increasing Consumption of Bolivian and Peruvian Quinoa at University Canteens in Berlin
Pablo Abbis, Christopher Patrick Benzenberg, Mariana Cerca, Lina Anne de Boer,
Marvin Ester, Lisa Frach, Rebecca Geyer, Dženeta Hodži
ć, Josef Kaiser, Nick Küspert,
Luca Kunz, Manuel Mezger, Maximilian Rittner, Fabian Stark, Marcel Twele
Humboldt-Universität zu Berlin Unter den Linden 6
10099 Berlin
Phone: +49 30 2093-66336 Fax: +49 30 2093-66335 Web: www.iri-thesys.org
Corresponding Author:
Rebecca Geyer: IRI THESys, Humboldt-Universität zu Berlin, Unter den Linden 6, 10099 Berlin, Germany, geyerreb@hu-berlin.de
THESys Discussion Papers ISSN 2566-7661 (Print) ISSN 2566-5561 (Online) Editor in Chief:
Jonas Østergaard Nielsen (IRI THESys) jonas.ostergaard.nielsen@hu-berlin.de
This publication may be reproduced in whole or in part and in any form for educational or non-profit purposes, without special permission from the copyright holder(s) provided acknowledgement of the source is made. No use of this publication may be made for resale or other commercial purpose, without written permission of the copyright holder(s).
Please cite as:
Abbis, P.; Benzenberg, C. P.; Cerca, M.; de Boer, L. A.; Ester, M.; Frach, L.; Geyer, R.; Hodžić, D.; Kaiser, J.;
Küspert, N.; Kunz, L.; Mezger, M.; Rittner, M.; Stark, F.; Twele, M. 2017: An Analysis of the Sustainability of the Increasing Consumption of Bolivian and Peruvian Quinoa at University Canteens in Berlin. THESys Discussion Paper No. 2017-2. Humboldt-Universität zu Berlin, Berlin, Germany. Pp. 1-34.
edoc.hu-berlin.de/series/thesysdiscpapers Cover: Quinoa © Jai79 (pixabay.com)
Copyright © September 2017 by the authors and IRI THESys Print: HU Druckerei, Dorotheenstraße 26, 10117 Berlin
1
An Analysis of the Sustainability of the Increasing
Consumption of Bolivian and Peruvian Quinoa at University Canteens in Berlin
Pablo Abbis, Christopher Patrick Benzenberg, Mariana Cerca, Lina Anne de Boer, Marvin Ester, Lisa Frach, Rebecca Geyer, Dženeta Hodžić, Josef Kaiser, Nick Küspert, Luca Kunz, Manuel Mezger, Maximilian Rittner,
Fabian Stark, Marcel Twele
Keywords: Quinoa, sustainability, interdisciplinary teaching, Deutschlandstipendium, Themenklasse
Preface
The THESys Discussion Paper “An Analysis of the Sustainability of the Increasing Consumption of Bolivian and Peruvian Quinoa at University Canteens in Berlin” represents the first report in this series compiled solely by bachelor’s and master’s students. It therefore adds an important new category to the series, one that provides a platform for innovative interdisciplinary research conducted by students. The authors are students at Humboldt-Universität’s Departments of European Ethnology, Geography, Philosophy and Physics, the Thaer-Institute of Agricultural and Horticultural Sciences as well as the School of Economics.
They all are or have been members of the so-called Themenklasse Nachhaltigkeit & Globale Gerechtigkeit, (Themenklasse Sustainability & Global Justice), a year-long interdisciplinary study project at IRI THESys for fifteen students who receive a monthly scholarship from the German federal government’s Deutschlandstipendium programme. The scholarships, which reward academic excellence and social engagement, are provided by the Stiftung Humboldt-Universität, with co-funding from the Federal Ministry for Education and Research.
The Themenklasse Nachhaltigkeit & Globale Gerechtigkeit has existed since 2013. Since its inception, the students of the Themenklasse have used their one year scholarship period to carry out interdisciplinary group work on questions of sustainability and global justice, under the supervision of IRI THESys scientists.
In this work, which has always fallen under the larger topic of “Humboldt’s Footprint”, the students have addressed questions of great societal relevance while using the “cosmos” of their university as an area or object of study. Their work has included projects on subjects such as the sustainability of the Humboldt- Universität’s supply chains, student mobility, and official travel at the university’s geography department.
The 2016/2017 cohort also decided to focus on Humboldt’s Footprint, this time addressing the question of sustainable food production and consumption. The students began by exploring and comparing different disciplinary approaches to the question of sustainability in a resource context. After determining the major differences in disciplinary approaches and perspectives, they then narrowed down the often broader, more general questions to the specific question of Quinoa consumption in university canteens. During many long meetings and discussions, and with only brief inputs from their supervisors, the students explored the multi-faceted problem of how to assess Quinoa as a product, including its production, transport and
2
consumption. They took approaches to this question of sustainable quinoa consumption that ranged from empirical quantitative work to a normative approach.
This report presents an initial summary and synthesis of the outcomes of this work. It is not a final report, as the work of the 2017/2018 cohort will continue to examine this topic. In a June 2017 workshop, the group presented their work to fellow students and explored how this topic could be further refined and developed, e.g. to regionally differentiate the economic and social impacts of the diffusion of quinoa production. As the supervisors of this work, we are excited to learn about the next group of new ideas and to see the outcomes of the next steps in this analysis. We therefore want to express our gratitude to Stiftung Humboldt-Universität for their constant support, which has been essential to ensuring the continuity of the work of this group of talented and enthusiastic young researchers.
Berlin, June 2017
Bettina König, Sebastian van der Linden, Tobias Krüger
3
Contents
1. Introduction ... 4
2. Background ... 4
2.1 Introduction to quinoa ... 4
2.2 Philosophy propaedeutic ... 6
3. Analysis of the concept of sustainability ... 7
4. Application of the analysed concept ... 9
4.1 Sustainability of quinoa production ... 9
4.2 Sustainability of the well-being of quinoa producers ... 11
4.3 Sustainability of quinoa transport ... 15
4.3.1 Intermodal transport in Europe ... 15
4.3.2 Maritime transport ... 17
4.3.3 Intermodal transport in South America ... 18
4.3.4 Calculation of greenhouse gas emissions and final results ... 19
4.3.5 Application to the sustainability debate... 21
5. Conclusion... 22
6. References ... 24
7. Appendix ... 28
4
1. Introduction
For thousands of years, Quinoa has traditionally been the staple food for large portions of the Peruvian and Bolivian population (FAO, 2011). In the last twenty years, as a consequence of a strongly growing demand for this so-called “super food” in Europe and Northern America, quinoa production has increased tremendously. Since 2014, the Studierendenwerk Berlin, which operates almost all of the canteens at Berlin universities, has been purchasing and serving quinoa. Thus, the Studierendenwerk itself and the students that eat at these canteens have become actors in the global system of quinoa supply and demand. But what is the impact of students’ everyday lunch choices within a global production and consumption system? To what extent is it sustainable to eat quinoa instead of local alternatives? To address questions like these, we – the students of the Themenklasse – decided to start with the following research question:
Is the rising consumption of quinoa, both overall and at Berlin university canteens, sustainable?
However, to address this question, a theoretical framework is first needed (section 1). This paper shall analyse the concept of sustainability and apply this analysis to important aspects of the impact of quinoa:
its production, the income of local producers, and greenhouse gas emissions.
Section 2 will provide some background information on quinoa as a crop and product, as well as a philosophy propaedeutic, thus building a foundation for the sections that follow. Analysis of the concept of sustainability will be offered in section 3, followed by an application of this analysis in section 4. The analysis focuses on the time period between 1995 and 2015 and examines the production of quinoa using the example of Bolivia, the income of local producers in Peru, and estimation of greenhouse gas emissions for various modes and routes of quinoa transport. Finally, in section 5, conclusions will be drawn and the limits of this paper will be discussed.
2. Background
2.1 Introduction to quinoa
Quinoa (Chenopodium quinoa Willd.) is a plant related to spinach and beetroot. Considered a pseudocereal, it is used as a seed crop and belongs to goosefoot family of plants (genus Chenopodium), which consists of several weedy salt-tolerant plants belonging to the amaranth family (Amaranthaceae), a dicotyledonous herbaceous plant. It has been cultivated in the Andean region for thousands of years and includes domesticated populations as well as their wild relatives (Scanlin and Lewis 2017; Bois et al. 2006). Today, Quinoa is still cultivated mainly in the equatorial Andes of South America, the same area where it is believed to have first domesticated in small quantities 7000 years ago (FAO and CIRAD 2015). Especially large cultivation areas can be found in the highland areas of Bolivia and Peru, where the largest amounts of quinoa in the world are produced. Ecuador also has large cultivation areas. In addition, quinoa that is well adapted to the climatic conditions west of the Andes is cultivated in central Chile (Bazile 2015).
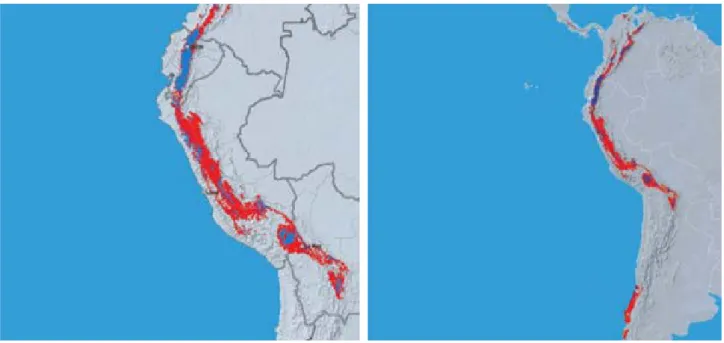
If consumption of quinoa continues to rise, it is expected that cultivation areas will also expand. Attempts have been made to cultivate quinoa not only in South America, but also in other regions of the world (Ritter, 1987). However, the negative consequences of climate change pose increasing risks to production.
Figure 1 shows the regions in South America in which the climate is currently suitable for quinoa cultivation
5
(in red and blue). By 2050, quinoa cultivation will be limited to the blue areas as a result of climate change (GIZ 2013).
Figure 1: Current cultivation areas for quinoa (red and blue) in South America (right) and Bolivia/Peru (left) in comparison to predicted cultivation areas in 2050 (blue only) (GIZ 2013)
Quinoa is remarkably adapted to harsh climatic conditions. In the Bolivian Altiplano, quinoa can grow at altitudes of 3600-4100m and endure nighttime temperatures close to 0°C during the growing season (Bois et al. 2006). In this region, there are strong fluctuations in temperature between day and night, and frost is even possible in the summer months. The exact tolerance and stress threshold depends on the specific quinoa variety. Optimum growing temperatures for quinoa range between 15°C and 20°C, but it can also be grown between 10°C and 25°C in extreme cases. Quinoa also exhibits high drought resistance, an ideal adaptation to the dry periods that immediately precede and follow the rainy season. Moreover, it can be grown in stony soil and soil poor in humus, with possible soil types ranging from sandy loam to loamy sandy soil. However, good soil drainage is very important, as ponding water can lead to the death of the plant. In addition, quinoa tolerates a strong pH variance within the soil, ranging from acidic soils (pH 4.5) to alkaline soils (pH 9). However, optimal growth occurs at a neutral pH (Garcia et al 2015; Ritter 1987).
This stress tolerance is mentioned by Scanlin and Lewis (2017, p. 224) as one factor that raised global interest in quinoa, in addition to its “protein quality, culinary versatility, gluten-free status, [and]
biodiversity”. Quinoa has been consumed as a traditional food in the Andean region for thousands of years and until 1975, cultivation was limited to subsistence farming (Scanlin and Lewis 2017). The increasing popularity of quinoa in developed countries is following a “superfood” trend that began after the Smithsonian Institute in Washington, DC, described quinoa as “the most nutritious grain in the world”
(Scanlin and Lewis 2017, p. 223). Following that statement, several publications, newspapers and interviews explained and extolled the health benefits of quinoa. In fact, quinoa contains exceptional protein content when compared with true grains, as well as superior protein quality (Scanlin and Lewis 2017), with total protein content (16.28 g db) higher than wheat (14.51 g db), maize (10.51 g db), and rice (8.10 g db) (USDA 2017). In addition, in 2013, the Food and Agriculture Organization of the United Nations (FAO) launched the
6
International Year of Quinoa (FAO & CIRAD 2015). The growing popularity of quinoa led to a tripling in its price between 2006 and 2013 (Bellemare et al. 2016a).
2.2 Philosophy propaedeutic
Conceptual analysis is a major method in contemporary analytical philosophy. To introduce this method, the following section will begin with a general characterisation of conceptual analysis. Before we apply this method to the concept of sustainability, we will use it to analyse the concept of the term “table” as a simple, illustrative example.
Concepts are often very vague, in philosophy as well as in the empirical sciences. What do we mean when we speak about justice, what is our understanding of knowledge, what exactly is captured by the term poverty? In order to clarify such concepts and determine their exact meaning, philosophers have developed a method called conceptual analysis. Because it can also be applied to vague concepts in the empirical sciences, this method is of great relevance to this paper. We shall use it to produce an analysis of the concept of sustainability.
Using the specific example of an analysis of the concept “table”, two types of criticism of a conceptual analysis will be introduced. These are needed to conduct the analysis of the concept of sustainability.
In general, conceptual analysis can be characterised as clarifying a concept by tracing it back to other, clearer concepts. These concepts may be mundane and therefore be clear by their very nature, or they may be other concepts that have already been analysed themselves. We will now demonstrate this general understanding by conducting a conceptual analysis of the concept of a table:
X is a table if and only if X has a slab and X has legs.
A conceptual analysis is always structured this way. The actual analysis occurs after the “if and only if”, where the conditions required for something to be a table are specified. This part is called the analysans.
The analysans provides the conditions that must be met by the analysandum, the term before “if and only if”. In this case, two conditions must be met, namely having a slab and legs. However, this analysis is just a starting point, for there are two types of criticism of such an analysans that are relevant to this paper.
First, the analysis may be too narrow. This is the case when there are things that actually fall under the broader concept, but that do not meet all of the conditions of the analysans. For example, there are things that are tables that do not have a slab and legs. One example might be a lectern, which has a slab on top but no legs or only one leg. Secondly, the analysis can be too broad. This is the case if there are things that fall under the analysans but which are not part of the extension of the analysandum. There might be things that have a slab (or something slab-like) and legs, which we usually do not conceive of as tables. Examples might be a dock, or even a bus shelter.
In each of these cases, there are two ways to alter or keep the previous analysans. The problem is that the vagueness of a concept brings different opinions about which things should or should not be included in the extension of that concept. There certainly are things that some consider to be a table while others do not, like the lectern. One could either simply describe the vagueness or specify a certain understanding of the concept. The first method is known as descriptive, while the second method is known as revisionary. A descriptive method is an intuitive starting point. However, when necessary, the revisionary method will be
7
employed in this project. With this preliminary work complete, the actual analysis of the concept of sustainability can now begin.
3. Analysis of the concept of sustainability
The aim of this paper is not to create a universal analysis of the term sustainability, but rather to create an operational analysis that can be used to answer the question of whether the import and consumption of quinoa by the Studierendenwerk Berlin is sustainable or not.
The term sustainability originated in forestry, which is why the initial approach in the search for an analysis will be an example from forestry (Grober 2013). A simple example might be the following: “Logging trees is sustainable with respect to the forest if and only if logging trees causes the regeneration of the forest”. If the analysans is satisfied, it is intuitively plausible to speak of sustainability. The generalisation of this example leads us to a first analysis of sustainability:
1) X is sustainable with respect to Y if and only if X causes the regeneration of Y.
However, with regard to our research project, this analysis has many difficulties, which we will resolve in this section. One disadvantage is that the analysis is limited to certain understandings of sustainability, as the term regeneration is mainly used in an ecology context. An attempt to discuss financial sustainability fails, as the following example shows: “A subsidy is sustainable with respect to the income of fishermen if and only if the subsidy causes the regeneration of the fishermen’s income.” Even answering the question of what the regeneration of income could be seems to be impossible. Because the analysis provided above was too narrow, the section concerning regeneration will have to be changed. The term regeneration is too vague and has been replaced in the following analysis. From this point on, changes in our analysis will be marked in italics:
2) X is sustainable with respect to Y if and only if X causes the average amount of Y to at least remain equal in the future.
Still, there are other problems with this formulation for the purpose of this paper. One major problem is the broad scope of what X can be. In this research project, we are only interested in X being specific things, namely actions. According to formulation 2, X can encompass things other than actions. For instance, take the following statement: “The rain cycle (X) is sustainable with respect to the amount of water in the sea (Y) if and only if the rain cycle (X) causes the average amount of water in the sea (Y) to at least remain equal in the future”. Our current analysis considers this example to be sustainable. While this is not implausible, the aim of this project is to specify an analysis that addresses actions. The rain cycle may be sustainable, but it is not what this project aims to evaluate – it is not an action. The following analysis therefore restricts X to an action:
3) X is sustainable with respect to Y if and only if X is an action and causes the average amount of Y to at least remain equal in the future.
This formulation is unnecessarily complicated. The condition of X to be an action can easily be placed in the analysandum:
8
4) An action X is sustainable with regard to Y if and only if X causes that the amount of Y remains at least equal in average in the future.
However, in the case of this analysis, all kinds of actions that increase Y are included. This is counterintuitive in some cases. Take the following example: “Using nuclear power is sustainable with respect to nuclear waste if and only if using nuclear power causes the average amount of nuclear waste to at least remain equal in the future.”
Even though the analysis considers this to be sustainable, it is obviously not. For our project, not everything that increases something should be assessed as sustainable. We want to reach a narrower understanding of sustainability, as our aim is to include only those actions that increase an instrumental good. The notion of an instrumental good is a crucial one in practical philosophy, but the idea is also common in everyday thinking (Zimmermann 2014). The best way to get a grasp of instrumental good is to contrast it with its complement, intrinsic good (or value). In practical philosophy, something is an instrumental good if (and only if) it is useful or important for the sake of something else, while something is an intrinsic good if (and only if) it is good for its own sake. Examples for instrumental goods are useful everyday objects like toothbrushes, cars or books. It is clear that these objects are good for something else. Toothbrushes are good for health, cars are good for mobility and books are good for education or entertainment. Examples of intrinsic goods are often more abstract notions like happiness, friendship, knowledge or freedom. The value of these goods is not derived from the value of something else, but lies in the good itself. For the purpose of an analysis of the concept of sustainability, it seems appropriate to narrow the scope of the variable Y to instrumental goods, because the idea of sustainability is meant to guide our action. This leads to the following result:
5) An action X is sustainable with respect to an instrumental good Y if and only if X causes the average amount of Y to at least remain at equal in the future.
However, some actions remain that are intuitively sustainable, but are still not covered by our analysis. This is mainly due to the term “future” and its open-ended nature: “An action X (reforesting) is sustainable with respect to an instrumental good Y (a rainforest) if and only if reforesting causes the average amount of rainforest to at least remain equal in average in the future”. A precise evaluation of this analysis will consider some examples of X to not be sustainable. Why? If “the future” is not limited to a certain extent, it will also include those periods after the Earth’s (and therefore the rainforest’s) extinction. In addition, because our research project has access to specific data for specific times, it is useful to specify “the future”:
6) An action X at tx is sustainable with respect to an instrumental good Y relative to tn, and tx < tn if and only if X causes g:t→Y and ∫ 𝑔(𝑡)𝑑𝑡𝑡𝑥𝑡𝑛𝑡𝑛−𝑡𝑥 ≥ 𝑔(𝑡𝑥)).
The formula g(tx) indicates the amount of Y at time tx. The average amount of Y in the time interval tx to tn is denoted by the first part of the formula: ∫ 𝑔(𝑡)𝑑𝑡𝑡𝑥𝑡𝑛𝑡
𝑛−𝑡𝑥 . Still, there may be instrumental goods which should not always be increased. CO2 is one popular example: While some CO2 is a necessary condition for life as we know it, too much of it in the atmosphere is harmful for human life. The analysis as it currently stands will only consider the increase, and never the decrease, of CO2 to be sustainable:
9
“An action of driving a car today is sustainable with respect to an instrumental good CO2 relative to tomorrow, and (today < tomorrow) if and only if driving a car causes g:t→CO2 and ∫ 𝑔(𝑡)𝑑𝑡
𝑡𝑡𝑡𝑡𝑡𝑡𝑡𝑡 𝑡𝑡𝑡𝑡𝑡
𝑡𝑡𝑡𝑡𝑡𝑡𝑡𝑡−𝑡𝑡𝑑𝑡𝑡≥ 𝑔(𝑡𝑡𝑡𝑡𝑡)).”
In order to ensure that an increase in an instrumental good always secures an increase in an intrinsic good, we will introduce a third variable, Z. Z represents the intrinsic good or value for whose sake we are concerned with the instrumental good in the first place. Now it is necessary to clarify whose values we are talking about. We thought that a virtue of the concept sustainability was that it is neutral in regard to which things are valuable. By leaving open the possibility of inserting any value, our intent was to keep the concept compatible with a wide array of positions in political and moral philosophy. For example, the concept can be applied to anthropocentric views, which are only concerned with human well-being, as well as to more holistic approaches that attribute intrinsic value to biodiversity or nature as a whole.
Furthermore, the concept is not committed to any view of the nature of morality. In other words, it is compatible with both realist and constructivist approaches. However, once the concept must actually be applied, taking a stand seems unavoidable, at least in regard to which value to insert. We have decided to focus on human well-being, for it seems to enjoy wide consensus, even among otherwise opposing views.
While what well-being consists of is naturally controversial, there is apparent unanimity about some aspects of it, such as living in a healthy environment and having enough food. Our notion of well-being can build upon this:
7) An action X at tx is sustainable with respect to an instrumental good Y relative to tn, such that tn >
tx, and relative to a value Z if and only if X causes g:t→Y and f:Y→Z and 𝑓(∫ 𝑔(𝑡)𝑑𝑡𝑡𝑛𝑡𝑥𝑡
𝑛−𝑡𝑥 ) ≥ 𝑓(𝑔(𝑡𝑥))). The formula f(g(tx)) indicates the amount of value Z at time tx. The average amount of value Z in the time interval tx to tnis denoted by the first part of the formula: 𝑓(∫ 𝑔(𝑡)𝑑𝑡𝑡𝑛𝑡𝑥𝑡
𝑛−𝑡𝑥 ).
4. Application of the analysed concept
In applying this analysis of sustainability, we will focus on certain aspects of the empirical research: the production of quinoa, the income of quinoa producers and finally, the transport of quinoa.
4.1 Sustainability of quinoa production
The first part of this section will focus on the production of quinoa in Bolivia and will apply the conceptual analysis just conducted to actual data. We will therefore answer the question of whether quinoa consumption in 1995 was sustainable by comparing well-being related to quinoa production that year to well-being related to quinoa production from 1995 to 2014. The southern Altiplano plateau can be considered the main production area in Bolivia; quinoa production there accounts for up to 90% of Bolivian exports of the crop (Aroni et al., 2009; Rojas, 2011). As a response to growing commercial demand, the production of quinoa rapidly spread from the southern edge of the Uyuni salt flats towards the west and north of the flats. Due to the high altitude of the region, environmental conditions reach extremes, with rocky, sandy soil that is permanently exposed to drought, frost, violent winds and intense solar radiation.
10
Yet expansion of the area under cultivation and intensification of existing cultivation is urgently needed to meet market demand and maintain productivity. This often leads to a disregard for the properties of the soil in locations where quinoa is produced. In the near future, this will result in a higher demand upon irrigation systems and the increased application of fertilizer. Moreover, in some areas, there has been a shift from cultivation on mountainsides to cultivation on flatlands, as these are more accessible for agricultural equipment. As a result, the expansion of cultivation to flatlands is inevitably causing the displacement of indigenous plants and local grasses and bushes that cover the soil as they are replaced by quinoa monoculture. Additionally, the cultivation of fallow lands, which are highly vulnerable to wind erosion, has led to a decline in soil fertility (FAO & CIRAD, 2015).
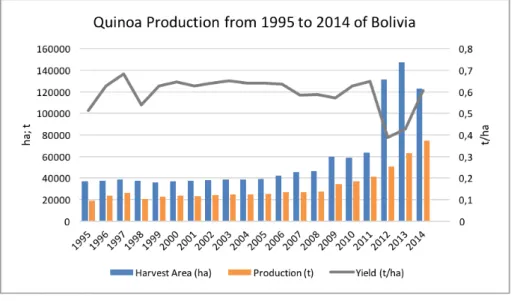
However, the data available today does not incorporate these impending drawbacks. An analysis of the available data may therefore very well produce a conclusion that does not take such negative impacts of monocultural farming into account (Fig. 2).
Figure 2: Bolivian quinoa production from 1995 to 2014 in tonnes
As an interim conclusion, we now would like to return to the question raised at the beginning of this subsection: Is the level of quinoa consumption in 1995 sustainable as measured by a comparison of the well-being of the people due to the production of quinoa in Bolivia that year to such well-being in 2014? To answer this question, we will draw on the analysis developed in section three. The analysis states:
An action X at tx is sustainable with respect to an instrumental good Y relative to tn, such that tn > tx, and relative to a value Z if and only if X causes g:t→Y and f:Y→Z and 𝑓(∫ 𝑔(𝑡)𝑑𝑡𝑡𝑛𝑡𝑥𝑡𝑡−𝑡𝑥 ) ≥ 𝑓(𝑔(𝑡𝑡))).
According to this analysis, we need to determine whether quinoa consumption in 1995 led to well-being related to quinoa production from 1995 to 2014 that was at least as high as well-being related to quinoa production in 1995. For this purpose, we first need to determine quinoa production in 1995 [g(1995)]. The table shows that the production of quinoa in 1995 was 18,814 t. Next, we need to know average quinoa production from 1995 to 2014: [∫2014−199519952014𝑔(𝑡)𝑑𝑡]
11
The figure states that average production of quinoa from 1995 to 2014 was approximately 31,917 t per annum. But how much well-being is associated with these production levels? In order to answer this question, we introduce a common assumption: Ceteris paribus. It maintains that if there is more of some instrumental good, the impact on the overall well-being cannot be negative. According to this notion, higher quinoa production will be accompanied by unchanged or increased overall well-being. However, the ceteris paribus clause seems somewhat suspect. Indeed, there are relevant aspects of production that should be considered when estimating overall well-being. These include the harvest area as well the yield per hectare. As the table shows, from 1995 to 2014 the average yield per hectare increased somewhat over 1995 levels, but essentially not by much.
We should therefore not assume impacts on well-being. From 1995 to 2014, harvest area almost quadrupled. Yet this increase is marginal when compared with Bolivia’s overall harvest area and can be ignored. Since both of the fundamentally relevant factors do not really impact overall well-being, we may infer from the above-mentioned common notion that overall well-being associated with quinoa production did not change or increase, on average. Thus, the analysans holds true.
Therefore, quinoa consumption in 1995 was sustainable, as measured by the comparison of well-being from the production of quinoa in Bolivia in 1995 with such well-being in 2014. However, as indicated above, due to a rising amount of monocultures, the yield may at some point in the future suddenly decrease, something that makes a prediction highly unreliable.
4.2 Sustainability of the well-being of quinoa producers
The geographic and climatic conditions on the Altiplano plateau, the expansion of quinoa farming, and the associated agricultural challenges are closely intertwined with social and economic developments in the region. Therefore, in the following section we will examine the sustainability of rising quinoa consumption with regard to the well-being of quinoa producers in Peru.
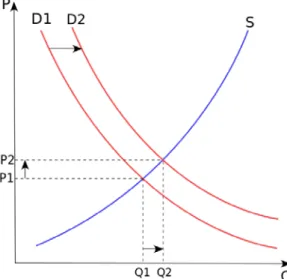
According to neoclassical economic theory, higher consumption (=more demand) of a good will lead to a higher price for that good and a higher quantity sold (Marshall 1890) (Fig. 3).
Figure 3: Supply and demand. P – price; Q - quantity of good; S – supply; D – demand (Source: Paweł Zdziarski, Wikimedia Commons 2017)
12
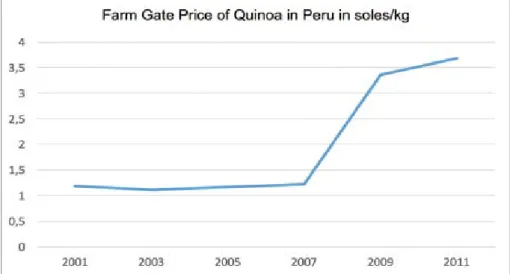
In the case of quinoa, the empirical data between 2001 and 2011 seems to confirm the theory that growing consumption of quinoa will lead to higher quinoa prices. Combined quinoa imports by the EU 28, USA and Canada from Peru increased fivefold over this period (Fig. 4). In the same period, the inflation-adjusted farm gate price of quinoa in Peru almost doubled from about 1.2 soles/kg to about 2 soles/kg (Fig. 5).
Figure 4: Increase in global quinoa demand between 2001 and 2011 (based on comtrade 2017)
Please note: For data on combined quinoa imports, we used source data from comtrade product category 100890 - other cereals, which before 2012 consisted mainly of quinoa and wild rice. As Peru is not a significant producer of wild rice, we have used the
data to approximate combined quinoa imports. Exact data may vary somewhat.
Figure 5: Increase in inflation-adjusted farm gate price of Quinoa between 2001 and 2011 (based on Ministerio de Agricultura y Riego 2017 and Instituto Nacional de Estadistica e Informatica 2017)
In order to examine the sustainability of the well-being of Peruvian quinoa producers using our definition of sustainability and data on changes in the farm gate price of quinoa, we will make the following two assumptions:
1) Changes in quinoa prices affect the welfare of quinoa producers.
13
Bellemare et al. (2016a) found “evidence that the rising price of quinoa has had a positive effect, both direct and indirect, on the welfare of producer households”. In another study the International Trade Centre concluded that “falling quinoa prices […] reduced welfare of households” (Bellemare et al. 2016b).
Thus, we will use the quinoa price as an indicator for the welfare of quinoa producers.
2) Economic welfare and personal well-being are related.
For the second assumption, we will treat life satisfaction as a measure of well-being and income as a proxy for economic welfare. There have been various studies about the relation between available household income and life satisfaction. Empirical data suggests an almost linear relation between GDP per capita and life satisfaction across nations (Deaton 2008). For our case, one observation is especially relevant: most of variation in life satisfaction due to GDP is in countries with GDP per capita below $10,000 (Proto et al.
2014). In 2015, both Peru and Bolivia had per capita GDP lower than $10,000 (Peru: $5935; Bolivia: $2393).
We will therefore assume that an increase in household income (economic welfare) for quinoa producers will lead to an increase in well-being.
Summarizing our assumptions, higher quinoa prices lead to increased economic welfare for quinoa producers, which lead to a higher level of well-being among quinoa producers.
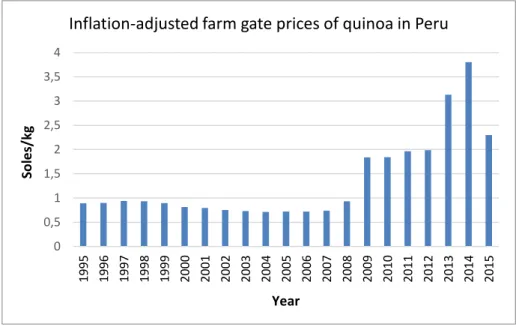
We will use Peruvian inflation-adjusted farm gate prices of quinoa for the last 20 years provided by the Ministry of Agriculture and Irrigation of Peru (Fig. 6) as our empirical data. The farm gate price can be defined as “the pricing point, that is, the price of the product available at the farm, excluding any separately billed transport or delivery charge” (ILO et al. 2004, p. 598).
Figure 6: Development of inflation-adjusted farm gate prices of Quinoa in Peru between 1995 and 2015 (own calculation based on Ministerio de Agricultura y Riego 2017 and Instituto Nacional de Estadística e Informática 2017)
When applying our definition of sustainability to the data, we will operate with these variables:
0 0,5 1 1,5 2 2,5 3 3,5 4
1995 1996 1997 1998 1999 2000 2001 2002 2003 2004 2005 2006 2007 2008 2009 2010 2011 2012 2013 2014 2015
Soles/kg
Year
Inflation-adjusted farm gate prices of quinoa in Peru
14
X (explanatory variable) – Δ Farm gate price of quinoa (compared to previous instant of time) Y (instrumental variable to measure Z) – Economic welfare of quinoa producers in Peru Z (intrinsic variable of interest) – Well-being of quinoa producers in Peru
Starting from the above-mentioned assumptions and the data collected, we want to answer the question of whether the increased quinoa prices caused the average well-being of quinoa producers from 1995 to 2015 related to the price of quinoa was of at least of the same quality as well-being in 1995 related to the price of quinoa.
For this purpose, we first need to determine the quinoa price in 1995. According to the data, the price of quinoa in 1995 was 0.89 soles/kg. Next, we need to know the average quinoa price from 1995 to 2015:
[∫2015−199519952015𝑔(𝑡)𝑑𝑡].
According to Figure 6, the average price of quinoa from 1995 to 2015 was approximately 1.35 soles/kg. This means that the average price over this period was higher than the price of quinoa at the beginning of the time period in 1995. Following assumptions 1 and 2, we therefore can conclude that the average well-being over this time was higher than the well-being of quinoa producers in 1995. Considering that rising demand causes higher prices, the rise of global quinoa demand since 1995 has been sustainable under our definition.
If rising global demand between 1995 and 2015 has been sustainable with regard to the well-being of Peruvian quinoa farmers, we conclude that the effect has been the same for rising quinoa consumption at the Studierendenwerk Berlin in the last few years, but at a proportionally smaller scale.
Nevertheless, we have to consider the following limitations and additional effects that could not be included in the definition or the assumptions.
We see that in the last few years of the boom – even with continuously rising international demand for quinoa – at first, the price rose strongly until the beginning of 2014, but has been decreasing since then. In the long run, the price is likely to be related to demand for quinoa, but is driven by factors other than just demand. For example, a rising and volatile price of quinoa might attract speculation, which can further influence the price. Higher demand for quinoa and higher trade prices can lead to changes in the composition and characteristics of the market. In Peru, quinoa has traditionally been produced by small production units that use traditional cultivation techniques. The boom in the last ten to twenty years has led to the establishment of large production facilities in coastal regions of Peru. These new, primarily export-oriented producers employ industrial agricultural practices including fertilizers, pesticides, and so on. Effects of scale result in lower production costs for these large producers, making it hard for small traditional farmers to compete. As only a very few varieties of quinoa are grown for export, these industrial farmers also cause a decrease in biological diversity. In section 5, we describe very similar problems for Bolivia.
In our approach, we do not include price volatility in the sustainability assessment, even though price volatility plays a significant role for the welfare of quinoa producers. In practice, the cultivation of quinoa must be planned one harvest period in advance and estimated using prices expected at the time of the
15
harvest. When quinoa prices are volatile, actual prices at the time of the harvest might vary strongly from the prices that were expected when the crop was planned. In 2014 and 2015, many producers of quinoa reacted to falling prices by holding back parts of their harvest, in the hope that prices would increase again.
Stored in simple sacks, the quinoa was vulnerable to pests, but instead of recovering, the price continued to fall further (El Mundo 2017).
4.3 Sustainability of quinoa transport
With regard to recent climate-impact research, the assessment of greenhouse gas emissions caused by the transport of agricultural commodities like quinoa plays a significant role in the debate about sustainable, globally fair nutrition. Therefore, we will calculate the greenhouse gas emissions caused by the transport of quinoa that is consumed at Berlin university canteens. Additional sources of emissions, such as those resulting from the cultivation or processing of quinoa, are not included in this analysis. The emissions generated throughout the various modes of transport are measured in CO2 equivalents, including the greenhouse gases CO2, CH4 and N2O. A distance-based method for calculating transport-related emissions was used that adapts parts of the European CEN-draft standard prEN 16258.
In order to calculate greenhouse gas emissions generated by the international exchange of goods, the different modes and routes of transportation that the product actually uses must be determined. This effort can begin at the Studierendenwerk. Information about quantities of quinoa purchased and suppliers were obtained from the Studierendenwerk’s central purchasing department. In 2016, Studierendenwerk Berlin purchased 24,450 kg of raw quinoa and 17,892 units of quinoa chili burgers, each weighing 0.125 kg.
Raw quinoa was purchased from Altdorfer Mühle GmbH in 71155 Altdorf, Germany, and quinoa chili burgers were supplied by Hilcona Feinkost GmbH in 70771 Leinfelden, which is located in the same area.
With this information, it was possible to get further information about transportation routes by conducting a phone interview with Altdorfer Mühle GmbH about the origin of the raw quinoa that they sold.
4.3.1 Intermodal transport in Europe
This study focuses on Bolivia and Peru because these are the countries that supply quinoa to Altdorfer Mühle GmbH. In the interview, it was possible to gain information about important logistic routes and hubs used in the international shipment of raw quinoa to Altdorf and Berlin, as well as significant facts about intermodal transport used during shipment. According to Altdorfer Mühle GmbH, maritime transport is the prevailing mode for sending commodities like quinoa from South America to Europe, whereas air transport can largely be excluded due to its significantly higher costs. This means that the relevant hubs for this investigation are the ports of Antwerp, Rotterdam, Bremerhaven and Hamburg.
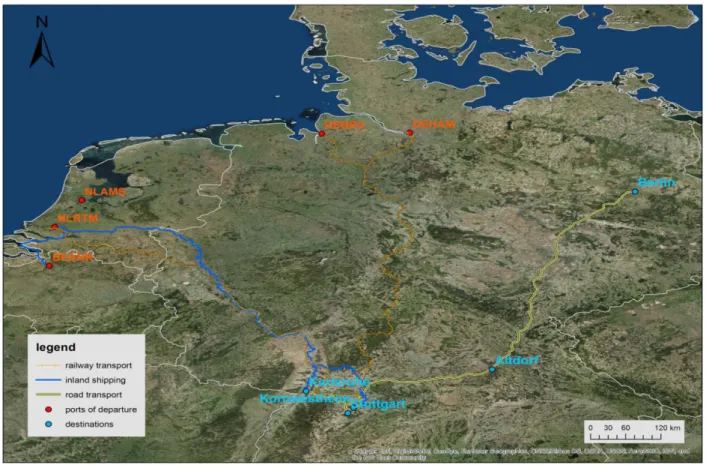
From these hubs, different intermodal transport routes are possible. These include sending shipments from Antwerp or Rotterdam to Karlsruhe or Stuttgart via inland waterway and from there to Altdorf by road. A common alternative route involves transshipment in Bremerhaven or Hamburg, where the cargo is loaded onto freight trains that deliver it to Kornwestheim in southern Germany. From there, transport to Altdorf continues by road. Another option is transshipment in Antwerp or Rotterdam, with freight trains taking the cargo to Kornwestheim from there. The latter option shall only be discussed for transshipment in Rotterdam whereas the previous intermodal options involving international inland shipping (i.e. by inland waterway) and domestic transport by rail shall be analysed in all six possible configurations (see Table 1). In each case, raw quinoa is sent from Altdorf to Berlin by lorry in the final stage of the transport process.
16
Figure 7: Maritime hubs and transhipment sites for intermodal transport of quinoa to Berlin
Table 1 and Figure 7 serve to clarify these intermodal transport operations. Like all illustrations in this section, Figure 7 was created using the program ArcGIS ArcMap Version 10.1. The routes actually employed may differ slightly from the ones shown in Figures 7 to 9 due to the availability of GIS data. The illustrations that follow are intended to convey this information in a qualitative way.
Table 1: Overview of intermodal shipment options including ports of discharge, intermodal transhipment points and their respective UN/LOCODEs
Port of discharge Intermodal transshipment point
Antwerp BEANR Karlsruhe DEKAE
Altdorf DEALT Berlin DEBLN
Stuttgart DESTR
Rotterdam NLRTM
Karlsruhe DEKAE
Stuttgart DESTR
Kornwestheim DEKOR
Bremerhaven DEBRV Kornwestheim DEKOR
Hamburg DEHAM Kornwestheim DEKOR
17 4.3.2 Maritime transport
Once the relevant destination ports are known, determining the ports of origin in Peru and Chile will enable us to analyse transatlantic shipping routes used in the transport of quinoa to Berlin. In the Peruvian case, the areas with highest numbers of quinoa production are located in the Andean highlands in the departments of Puno, Ayacucho and Junín (Gómez-Pando et al. 2013). In Bolivia, quinoa is basically harvested in the southwestern part of the country, including the departments of La Paz, Oruro and Potosí, also in the Andean highlands. The closest ports to these regions that are relevant for transatlantic container shipping are situated at the Peruvian and Chilean coasts: the ports of Callao, Matarani, Arica and Iquique.
The relevance of these ports was determined by using data from an AIS vessel tracking provider (Fleetmon 2017) and selecting ports with an activity index higher than 60 (out of 100) and a cargo port usage higher than 40%. These ports can also be found in databases for liner services provided by port operators in Hamburg (Hafen-Hamburg 2017) and Rotterdam (Rotterdamtransport 2017). Figures 8 and 9 illustrate, among other things, the ports of origin used to determine quinoa transport routes to Germany.
The direct route itself was actually determined using a mapping service of the freight forwarder SeaRates (SeaRates 2017), which provides direct shipping routes and distances between ports. The usefulness of this application in conducting an analysis of realistic transport routes is limited, as it only draws a direct link between two given international ports, as can be seen later in Figure 8.
This is too inaccurate for the calculations in this paper, as container vessels sometimes call at several ports during their transatlantic itinerary. The dilemma lies in finding a representative approximation of a multitude of possible shipping routes that are unknown to the authors due to a scarcity of free information about maritime cargo itineraries. One method that can be used to narrow these down is to determine ports at which container vessels are likely to call during transatlantic voyages from the Chilean coast through the Panama Canal and on to northern Germany and to calculate the distance covered by a shipping route that connects all of these ports. As the degree of complexity of this indirect route is somewhat higher than any of the actual routes, it can be used to create an inclusive uncertainty interval when it is used as an upper limit and the direct route is used as a lower limit. Several criteria are needed to enable a representative selection of ports of call. Only ports with activity indices higher than 60 (out of 100), with a cargo port usage higher than 40% (Fleetmon 2017), with a minimum distance of 170 km to the next port of call and with a location that would cause a realistic diversion from a ship’s actual course.
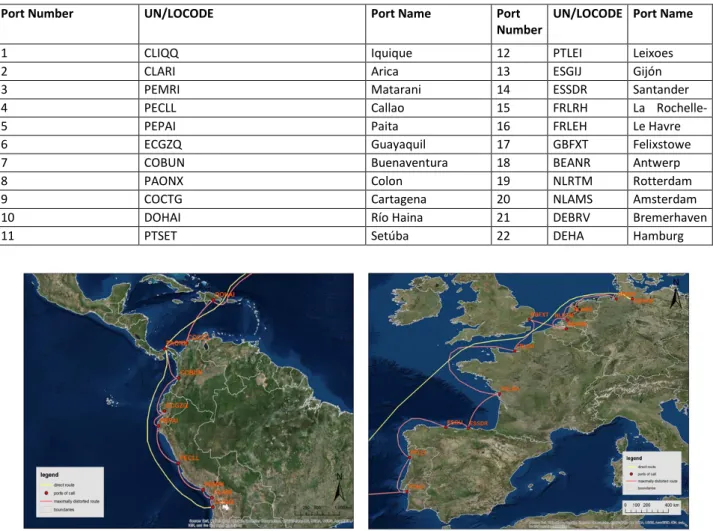
Table 2 presents the itinerary with the maximum number of ports of call and also lists all of the relevant ports. Figure 8 illustrates the distortion of a direct maritime connection that is caused by calling at several ports along the way. Note that this graphic only provides a rough sketch of such an itinerary, not the exact itinerary itself. It shows that the limits of the distance interval consist of a direct course through international waterways on the one hand and a course that closely follows the coastline on the other.
Further aspects of this model will be discussed in the upcoming section about the calculation of emissions.
18
Table 2: Itinerary with the maximum number of ports of call
Port Number UN/LOCODE Port Name Port
Number UN/LOCODE Port Name
1 CLIQQ Iquique 12 PTLEI Leixoes
2 CLARI Arica 13 ESGIJ Gijón
3 PEMRI Matarani 14 ESSDR Santander
4 PECLL Callao 15 FRLRH La Rochelle-
5 PEPAI Paita 16 FRLEH Le Havre
6 ECGZQ Guayaquil 17 GBFXT Felixstowe
7 COBUN Buenaventura 18 BEANR Antwerp
8 PAONX Colon 19 NLRTM Rotterdam
9 COCTG Cartagena 20 NLAMS Amsterdam
10 DOHAI Río Haina 21 DEBRV Bremerhaven
11 PTSET Setúba 22 DEHA Hamburg
Figure 8: Maximally distorted shipping route and direct shipping route South America (left) and Europe (right)
4.3.3 Intermodal transport in South America
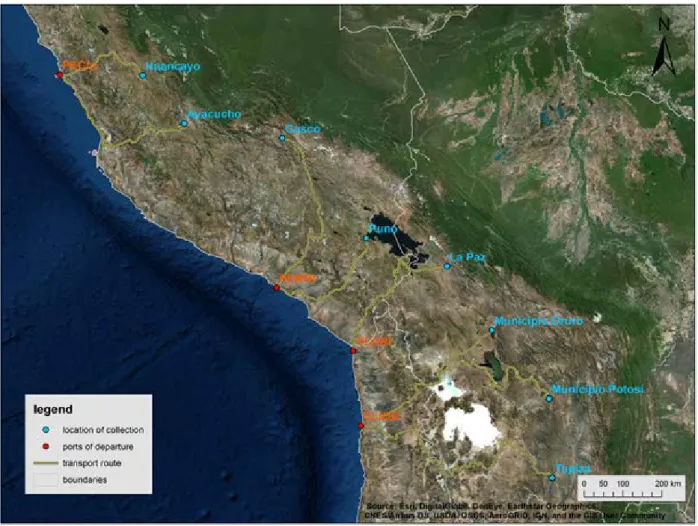
Considering the extensive quinoa cultivation areas in the western Andes and Andean highlands spread across Bolivia, Peru and other countries, there is no single point of departure for international quinoa shipments. National and regional trade networks and distribution patterns are for the most part unknown to the authors, which requires taking a more hypothetical approach to describing intermodal transportation in the countries where quinoa is cultivated. The departments that primarily contribute to the production of quinoa are Junín, Ayacucho, Apurímac, Cusco and Puno in Peru and La Paz, Oruro and Potosí in Bolivia. In this region, Huancayo, Ayacucho, Cusco, Puno, La Paz, Municipio Oruro and Municipio Potosí are the biggest urban conurbations that can be seen as important hubs of agricultural trade. Finally, Tupiza in south Bolivia will be included as a final location in the analysis, as it is also a relevant hub of the quinoa trade in Potosí (Winkel et al. 2015). These eight locations will be considered collection points for regionally produced quinoa and will serve as starting points for intermodal transport to the closest of the five relevant ports along the Chilean and Peruvian Pacific coasts. The model thus does not include transport from the areas of cultivation to the closest capital city. Figure 9 shows direct intermodal routes from the each of the eight collection points to its closest port. Commodities reach these ports by road, as railways and inland waterways are practically non-existent in these areas due to unsuitable geological and socio- economic conditions.
19
Figure 9: Intermodal connections from cultivation areas to maritime transport hubs along the Pacific coast
4.3.4 Calculation of greenhouse gas emissions and final results
The actual algorithm used to calculate the emissions generated by the transport of quinoa from South America to Berlin is simple. Compatible with the CEN-draft standard prEN 16258, it generally first requires the determination of the distances covered by the various means of transport. These distances are then multiplied by specific emission factors that express the quantity of CO2 equivalents emitted per tonne- kilometre of goods transported. The quantity emitted varies depending on the specific means and conditions of transport. The sum of the individual results describes the total greenhouse gas emissions generated by the transportation network. The real challenge in this method lies in finding suitable data for distances and emission factors that allow a representative approximation of the actual, real-world conditions on the ground. Before we carry out this calculation, it must be said that sources of errors exist beyond those already mentioned and which cannot be quantified within this study. For example, there is no detailed information about actual collection and distribution routes. This can result in a dynamic change in the share of emissions of a given shipment, caused by the loading and unloading of additional freight onto and from a lorry. Furthermore, the real weight of the shipment is also certainly higher than estimated, as the figures provided by the Studierendenwerk Berlin only refer to the weight of the raw commodities themselves and leave out the weight of their packaging, such as palettes and containers. Greenhouse gas emitting warehouses, transshipment facilities and processes at ports and freight depots are also not
20
included in this assessment. Furthermore, three assumptions have been made when calculating of distances, namely that:
1. Commodities are transported directly from the Chilean coast through the Panama Canal to the northern European coast without being transferred to other vessels with itineraries that deviate from this direct route.
2. Transport and emissions commence in the eight designated collection points in Bolivia and Peru.
3. Distances used will be the shortest connections without detours, with deviations from these distances covered by uncertainties.
The choice of specific emission factors limits the accuracy of the model, as these factors depend on a multitude of parameters which cannot all be considered simultaneously. These include, for example: a wide variety of traffic conditions; the topography of the route, which is very relevant for transport in mountain ranges like the Andes because emissions vary depending on the grade of the highway; the load factor of the actual lorry; the size, type and technological standards of the lorries, freight trains and cargo vessels involved; and their speed, which is decisive for their fuel consumption, especially for cargo vessels. The emission factors selected for the final calculation make certain assumptions and scenarios for these parameters and are drawn from the publication Carbon Footprint – Teilgutachten (Schmied et al. 2012), published by the UBA, Germany’s main environmental protection agency. They are introduced and discussed in the appendix of this study, alongside the calculation sheets, applied values, formulas and method used to determine uncertainties. In the following section, the more illustrative results, shown in Table 3, shall be presented. It summarises the results as the best-case-scenario of greenhouse gas emissions caused by the transport of quinoa from Bolivia and Peru to Berlin, plus a positive amount that reflects uncertainty due to inexact distances and emission factors. The specific greenhouse gas emissions caused by the transport of Bolivian and Peruvian quinoa to Berlin are in grams of CO2 equivalents per kilogram transported.
There are 56 results for the different combinations of places of origin and transhipment locations. It can be seen that the transport combinations that do not include shipment by inland waterway but rather intermodal railway transport, shown in the bottom three rows, have the lowest greenhouse gas emissions values. More specifically, row five of the table reveals the route that generates the lowest emissions:
transshipment in Rotterdam and from there by rail to Kornwestheim. It must be said that transshipment to rail in Antwerp was not analysed. As is intuitively expected, the lowest value for specific greenhouse gas emissions is generated by the Huancayo – Rotterdam – Kornwestheim route.
Table 3: Final results of the calculation of greenhouse gas emissions by transport route (Values in gCO2e/kg) Origin of shipment
Huancayo Ayacucho Cusco Puno La Paz Mcp. Oruro Mcp. Potosí Tupiza
Transshipment locations BEANR & DEKAE 417 + 66 462 + 70 482 + 71 446 + 68 467 + 70 467 + 71 523 + 78 515 + 77 BEANR & DESTR 434 + 62 479 + 67 498 + 68 463 + 64 483 + 67 483 + 67 540 + 75 532 + 74 NLRTM & DEKAE 413 + 68 459 + 72 478 + 73 442 + 69 463 + 72 463 + 73 519 + 80 511 + 79 NLRTM & DESTR 427 + 65 473 + 69 492 + 70 457 + 66 477 + 69 477 + 70 533 + 77 526 + 76 NLRTM & DEKOR 391 + 65 437 + 69 456 + 70 421 + 67 441 + 69 441 + 70 497 + 78 489 + 76 DEBRV & DEKOR 398 + 66 444 + 71 463 + 72 428 + 68 448 + 71 448 + 72 504 + 79 497 + 78 DEHAM & DEKOR 400 + 67 445 + 72 464 + 73 429 + 69 449 + 72 449 + 72 506 + 80 498 + 78
21
To produce an average value for the greenhouse gas emissions generated by the transport of quinoa sold at university canteens without knowing its exact point of origin or route, the mean value of these 56 combinations has been calculated. Table 4 shows this mean value and the relative shares of the different transport stages.
It must to be said that these shares can vary within a specific transport. They can thus only be understood as a rough indication of how greenhouse gas emissions are distributed among the different stages of transport. In addition, the average value of 466+70 grams of CO2 equivalents per kilogram of quinoa transported can be converted into energy consumption values. This amounts to 155+23 millilitres of conventional Diesel fuel or 0.81+0.12 kWh electric energy per kilogram of quinoa shipped, using the emission factors per energy source from the publication Carbon Footprint – Teilgutachten (Schmied et al.
2012).
Table 4: Mean value and uncertainty for specific greenhouse gas emissions and the share of the different stages of transport (Values in [gCO2e/kg])
Stage of transport Mean minimum value Mean uncertainty
466 70
Lorry South America 20.7% 16.26%
Container vessel 45.7% 54.59%
Inland vessel 5.0% 0.04%
Train 0.9% 0.18%
Lorry Germany 27.7% 28.93%
4.3.5 Application to the sustainability debate
The above values for emissions and energy consumption give a concrete idea of one aspect of the ecological impacts caused by the consumption of quinoa at Berlin university canteens. Regarding the sales figures provided at the beginning of section 4, one can conclude that in 2016 the raw quinoa consumed at university canteens of the Studierendenwerk Berlin resulted in the emission of roughly 11.4+1.7 tonnes of CO2 equivalents from transport alone. As quinoa chili burgers are not supplied by Altdorfer Mühle GmbH, but rather by another provider, they are not included in this figure. However, under our model, their transport would generate further emissions of roughly 1.0+0.2 tonnes of CO2 equivalents. It must be said that this assessment only focused on the transport of quinoa, not on cultivation methods, other ecological impacts or additional processing, all of which must also be considered significant contributors to greenhouse gas emissions resulting from quinoa consumption.
Assuming a 200 gram personal portion of quinoa, the transport of one lunch portion releases about 93+14 grams of CO2 equivalents into the atmosphere, equal to the energy consumption of 31+5 ml of Diesel fuel or 0.16+0.03 kWh of electricity per quinoa portion. If a customer at a university canteen were to instead choose 200 grams of potatoes, their transport would only result in the emission of around 9.3+2.7 grams of CO2 equivalents into the atmosphere – about 10% of the impact of quinoa. In this case, potatoes are provided by ibuss Kartoffelcenter GmbH in northern Germany, which obtains raw potatoes from the surrounding area, except in June and July, months in which potatoes cannot be yet harvested and must be imported from Israel.
22
It is obvious that substituting local crops for quinoa at university canteens in Berlin is a serious consideration as far as climate protection is concerned. The approximately 90% reduction in greenhouse gas emissions that this would result in offers a remarkable opportunity to mitigate climate impacts for humans and the natural environment, one of the most important and timely challenges facing the world.
Nevertheless, this does not reflect the extent and variety of consequences that human activity has for the environment. For example, in the case of maritime transport – the dominant means of the international transport of commodities like quinoa – additional environmental concerns include: the emission of air pollutants; the effect of ships’ antifouling paint and its persistence as an organic pollutant; the transport of non-native species in ballast water; marine pollution due to cargo loss and inadequate shipboard waste management; and the acoustic pollution of marine ecosystems (Umweltbundesamt, 2016). These environmental impacts could not be quantified in this analysis but are still considerable and play an important role in any decision based on sustainability and human health.
This sustainability analysis focuses on the change in an instrumental good, namely the concentration of carbon dioxide in the atmosphere. The increasing sale of quinoa by canteens operated by the Studierendenwerk Berlin was analysed to determine if it has led to a change in the concentration of carbon dioxide in the atmosphere. Consequently, not only the question of whether there has been a change or not has been answered, but whether this change leads to an average CO2 concentration that is accompanied by the same or better overall well-being. If the calculated average shows such a change, it is sustainable. If it does not, the action is not sustainable according to this analysis.
As has been shown, consuming quinoa does cause an increase in the concentration of carbon dioxide in the atmosphere. The concentration of carbon dioxide is already above the ideal value and additional emissions of carbon dioxide will cause the concentration to rise further. Accordingly, the well-being of humans related to the concentration of carbon dioxide in the atmosphere does not increase or remain stable, but rather decreases.
The consumption of quinoa from 2014 to 2016 in canteens operated by the Studierendenwerk Berlin is not assessed as sustainable in regard to the concentration of carbon dioxide in the atmosphere.
5. Conclusion
Throughout the course of this research, we have been guided by the goal of analysing the concept of sustainability and applying it to rising quinoa consumption at canteens operated by Studierendenwerk Berlin. We identified three important factors in order to properly answer this question. First, the production of quinoa using the example of Bolivia, the welfare of local producers in Peru, as well as an assessment of greenhouse gas emissions generated by various transport routes between South America and Berlin.
In the first subsection, subsection 4.1., the analysis was applied to the production of quinoa in Bolivia using official FAO data, resulting in a confirmation of its sustainability. We were able to conclude that quinoa consumption in 1995 was sustainable when the well-being of people in Bolivia due to the production of quinoa in 1995 was compared to such well-being in 2014. However, due to the increase in monocultures in Bolivian croplands, a drop in productivity is expected in the future. Such a sudden disruption of productivity
23
would result in a negative outcome according to this analysis. Since it is impossible to know if or when such a disruption will occur, long-term predictions about changes in productivity are not possible based on the data available.
In addressing the well-being of quinoa producers in subsection 4.2, the second section, we conclude that, with certain assumptions, the rising demand by the Studierendenwerk Berlin seems to be sustainable.
However, the limitations that we mention are critical and must be carefully considered when drawing conclusions about the future impact of this demand. In addition, it would have been interesting to apply data about the number of people working in quinoa production in Bolivia or Peru in the last 20 years and how their income has changed over time to our definition of sustainability. As this data could not be obtained, further research in this area would be one possible next research step.
In the third subsection 4.3., the analysis of carbon dioxide emissions caused by the transport of quinoa from South America to Berlin resulted in a negative assessment of its sustainability. The concentration of carbon dioxide in the atmosphere is already higher than the ideal value and further emission of CO2 and CO2 equivalents caused by the transport of quinoa consumed in Berlin university canteens would lead to an even higher concentration – a negative outcome.
In summary, the results of these three sub-analyses are thus as follows: the consumption of quinoa can be considered sustainable with respect to productivity and income, but must be considered unsustainable in regard to the concentration of carbon dioxide in the atmosphere.
For most of us, this project was our first experience working on a single topic in an interdisciplinary team.
The fact that we come from different disciplines posed a variety of challenges. We first sought to establish a productive structure for the project by starting off in groups organized by discipline, with each group researching different aspects of the project. Students of philosophy developed the analysis of the sustainability concept used throughout the paper. Agriculture and economics students collected relevant data. Bringing these two aspects together turned out to be difficult and required changes both to the conceptual analysis as well to data collection. Once the conceptual analysis of sustainability was adjusted so that it could be applied to actual data, everything could be brought together fairly smoothly. The conclusions about the different aspects of sustainability were again drawn in an interdisciplinary way, which allowed us to closely monitor both aspects. Finally, the results of these interim conclusions led to the final conclusion of the paper. Although we certainly uncovered certain problems and challenges when combining the very different approaches of the different disciplines, the research project also allowed us to understand that exactly this combination may facilitate a more thoughtful discussion of the topic. In the end, these different perspectives made a carefully conducted research project possible.
![Table 4: Mean value and uncertainty for specific greenhouse gas emissions and the share of the different stages of transport (Values in [gCO2e/kg])](https://thumb-eu.123doks.com/thumbv2/1library_info/5591491.1690765/23.892.84.813.464.639/table-uncertainty-specific-greenhouse-emissions-different-transport-values.webp)
