Research Collection
Doctoral Thesis
Elucidating the nature of the metal-insulator transition in NaOsO3 with large scale facility experiments
Author(s):
Gurung, Namrata Publication Date:
2020-07
Permanent Link:
https://doi.org/10.3929/ethz-b-000453822
Rights / License:
In Copyright - Non-Commercial Use Permitted
This page was generated automatically upon download from the ETH Zurich Research Collection. For more information please consult the Terms of use.
DISS. ETH NO. 26960
Elucidating the nature of the metal-insulator transition in
NaOsO 3 with large scale facility experiments
A thesis submitted to attain the degree of DOCTOR OF SCIENCES of ETH ZURICH
(Dr. sc. ETH Zurich)
presented by Namrata Gurung
M. Sc., Universität Stuttgart
born Nov 23, 1992, citizen of India
Accepted on the recommendation of Prof. Dr. Laura J. Heyderman
Prof. Dr. Nicola A. Spaldin Prof. Dr. Cesare Franchini
Dr. Valerio Scagnoli
2020
Declaration of Originality
I hereby declare that the following submitted thesis is original work which I alone have authored and which is written in my own words.
Title: Elucidating the nature of metal-insulator tran- sition in NaOsO3by means of large scale facil- ity experiments
Author: Gurung, Namrata
Supervisor: Prof. Dr. Laura J. Heyderman
With my signature I declare that I have been informed re- garding normal academic citation rules and that I have read and understood the information on “Citation etiquette”. The citation conventions usual to the discipline in question here have been respected.
Furthermore, I declare that I have truthfully documented all methods, data, and operational procedures and not manipu- lated any data. All persons who have substantially supported me in my work are identified in the acknowledgements.
The above work may be tested electronically for plagiarism.
Zürich, June 27, 2020
"Do not seek for reasons in the specific patterns of stars, or of other scattered arrangements of objects: look, instead, for a deeper universal order in the way that things behave."
– Amphos Roger Penrose, The Road to Reality
Abstract
Ascertaining the nature of unconventional electronic states in transition metal oxides, has lead to the discovery of several novel emergent phenomena such as high temperature superconductivity, colossal magnetoresistance, and metal-insulator transitions.
One particular 5dtransition metal oxide system that has captivated substantial attention in the past decade is NaOsO3, due to its unique property of magnetism that plays a key role in determining the physical properties of the system.
In this thesis, we used a combination of several experimental techniques to elucidate the microscopic mechanism of the concomitant metal-insulator transition with paramagnetic-antiferromagnetic ordering in NaOsO3. We first employed resonant X-ray diffraction to directly look at the local environment of the 5dOs ion above and below the ordering temperature. Resonant X-ray scattering experiments were performed at OsL2,3 edges to observe diffraction peaks sensitive to the Os electron-density (via the anisotropic scattering tensor) and magnetism as a function of temperature across the metal-insulator transition. By measuring the temperature evolution of these diffraction peaks, we have inferred that the change in Os electron density across the metal-insulator transition is indeed driven by magnetism. We also searched for diffraction peaks that could arise from crystallographic symmetry breaking. However, we did not observe any such signatures, giving further confirmation of the magnetically driven transition scenario. Such a scenario, raised our interest whether a metal-insulator transition upon photoexcitation with femtosecond laser pulses could be observed in NaOsO3, whether it would be possible to disentangle the electronic and magnetic dynamics on a sub-picosecond timescale, and if such dynamics would be different from the one reported in other transition metal oxides.
Therefore, we performed optical and X-ray based time-resolved experiments with the goal to compare and disentangle the timescales of different elementary inter- actions arising from magnetic, electronic and structural degrees of freedom upon photo-excitation. Specifically, we used time-resolved resonant X-ray diffraction, to measure the time-evolution of diffraction peaks arising from magnetic and structural degrees of freedom upon photo-excitation. With our experiment we could determine an ultrafast melting of the antiferromagnetic order occurring on a sub 100 femtosecond timescale, which remains the fastest reported in literature
Abstract
so far. Furthermore, we could disentangle the time evolution of the magnetism from the lattice, as the change observed in diffraction peaks corresponding to the lattice periodicity presented dynamics with a time constant of the order of several picoseconds. We have thus established a novel metal-insulator transition concomitant with ultrafast melting of the antiferromagnetic order.
In order to complement our results on the evolution of long range magnetic order, in the last part of the thesis, we have designed and performed measurements aimed at ascertaining the presence and the role of spin fluctuations in NaOsO3. Such experiments have been motivated by a recent proposal that indicated di- rectional spin fluctuations as the cause for a continuous evolution of the Fermi surface topology, explaining the anomalous temperature dependence of the sample resistivity. According to this scenario, the system continuously evolves from an insulating to a pseudogapped bad-metal phase atTA=30 K marked by the onset of longitudinal spin fluctuations and, finally, at T=TN, rotational spin fluctuations close the pseudogap causing the system to become a metal. In order to explore the presence and evolution of such spin fluctuations with temperature, we performed muon spectroscopy (µSR) experiments that are sensitive to spin fluctuations in the frequency range 0.01 MHz - 1 THz. OurµSR measurements focused on the low temperature regime in the vicinity ofTAand they revealed the absence of the onset of spin fluctuations. However, a continuous evolution of the Fermi surface topology, could be still taking place, which is based on another mechanism resulting in a reduction of the effective magnetic moment of Os as a function of temperature.
Additionally, from the muon-data analysis we obtained a temperature dependence of the order parameter, which suggested that the metal-insulator transition in NaOsO3could be a first order transition. This is contrary to previous reports of a second-order phase transition. In order to ascertain the nature of the phase transition, we thus performed isothermal magnetization measurements in the vicinity of the phase transition. Analysis of such datasets using the Franco Method, leads to the conclusion that the phase transition n NaOsO3 is in fact a first order phase transition. This result calls for a revisit of all the previous models based on the fact that the metal-insulator transition is a second-order phase transition.
To conclude, on one hand our results have shed light on the unique role of magnetism as the driving force of the metal-insulator transition in NaOsO3and, on the other hand they call for further measurements to clarify in detail the mechanism linking magnetism to the metal-insulator transition. We thus predict NaOsO3to continue to be a hotbed for research in the upcoming years, and will serve as a benchmark for comparison to other magnetically itinerant systems.
Sommario
L’accertamento della natura di stati elettronici non convenzionali negli ossidi di metalli di transizione ha portato alla scoperta di numerosi nuovi fenomeni inaspettati come la superconduttività ad alta temperatura, la magnetoresistenza colossale e transizioni metallo-isolante.
Un sistema di ossido di metallo che ha catturato una notevole attenzione recente- mente è il NaOsO3, grazie alle sue proprietà magnetiche, che svolgono un ruolo chiave nel determinare le proprietà fisiche del sistema stesso.
In questa tesi, abbiamo usato una combinazione di diverse tecniche sperimentali per chiarire il meccanismo microscopico all’origine della transizione metallo-isolante che avviene concomitante con l’ordinamento antiferromagnetico nel NaOsO3. Per prima cosa abbiamo impiegato la diffrazione di raggi X risonante per osservare direttamente la densità elettronica dello ione 5d Os al di sopra e al di sotto della temperatura di ordinamento magnetico. Gli esperimenti di diffrazione di raggi X risonanti sono stati condotti alle soglie di assorbimentoL2,3 dell’Osmio, per osservare picchi di diffrazione sensibili alla densità elettroinca dell’ Osmio (attraverso il tensore di diffrazione anisotropico) e il magnetismo in funzione della temperatura attraverso latransizione metallo-isolante. Misurando l’evoluzione in funzione della temperatura di questi picchi di diffrazione, abbiamo dedotto che il cambiamento nella densità dell’elettrone Os attraverso la transizione metallo- isolante è effettivamente guidato dal magnetismo. Abbiamo anche fatto una ricerca di picchi di diffrazione che sarebbero potuti derivare dalla rottura della simmetria cristallografica. Tuttavia, non abbiamo osservato tali picchi, dando ulteriore conferma dello scenario di una transizione guidata magneticamente. Un simile scenario ha suscitato il nostro interesse a stabilire se fosse possibile osservare anche una transizione metallo-isolante in caso di fotoeccitazione con impulsi laser a femtosecondi nel NaOsO3, se fosse possibile districare la dinamica elettronica e magnetica su una scala ti tempi al disotto del picosecondo, e se tale dinamica potesse avere caratteristiche differenti da quella riportata in altri ossidi di metalli.
Pertanto, abbiamo eseguito esperimenti ad alta risoluzione temporale utilizzando raggi X e laser ottici con l’obiettivo di confrontare e districare le scale temporali delle diverse interazioni elementari derivanti da gradi di libertà magnetici, elettronici e strutturali dopo l’eccitazione iniziale. Più specificamente, abbiamo usato la diffrazione di raggi X risonante risolta nel tempo, per misurare l’evoluzione
Sommario
temporale dei picchi di diffrazione associati agli ordinamenti magnetici e strutturali.
Con il nostro esperimento siamo riusciti a determinare la scomparsa ultraveloce dell’ordine antiferromagnetico che si verifica su una scala temporale inferiore a 100 femtosecondi, uno dei valori più veloci finora riportato. Inoltre, siamo riusciti a districare l’evoluzione temporale del magnetismo dal quella del reticolo cristallino, poiché il cambiamento osservato nei picchi di diffrazione corrispondenti alla periodicità del reticolo presentava dinamiche con una costante temporale dell’ordine di diversi picosecondi. Abbiamo così stabilito che, eccitando il NaOsO3 con un impulso laser, vi si può indurre una transizione metallo-isolante in concomitanza con la scomparsa ultraveloce dell’ordine antiferromagnetico.
Al fine di integrare i nostri risultati sull’evoluzione dell’ordine magnetico, nella ultima parte della tesi, abbiamo eseguito misurazioni volte ad accertare la presenza e il ruolo delle fluttuazioni di spin nel NaOsO3. Tali esperimenti sono stati motivati da una recente proposta teorica che indicava le fluttuazioni di spin direzionali come la causa di una continua evoluzione della topologia della superficie di Fermi, spiegando in questo modo l’anomala dipendenza dalla temperatura della resistività del campione. Secondo questo scenario, il sistema evolve continuamente da uno stato isolante ad uno di metallicità scadente, con la presenza di uno pseudogap aTA=30 K segnata dall’insorgenza di fluttuazioni di spin longitudinali e, infine, a T=TN, le fluttuazioni di rotazione rotazionale chiudono lo pseudogap facendo diventare il sistema un metallo. Al fine di esplorare la presenza e l’evoluzione di tali fluttuazioni di spin con la temperatura, abbiamo eseguito esperimenti di spettroscopia muonica (µSR) sensibili alle fluttuazioni di spin nella gamma di frequenze 0.01 MHz - 1 THz. Le nostre misureµSR si sono concentrate sul regime di bassa temperatura in prossimità diTAe hanno rivelato l’assenza dell’insorgere delle fluttuazioni di spin predette dal modello teorico. Tuttavia, questo non esclude una possibile evoluzione della topologia di superficie di Fermi, che si basi su un altro meccanismo con conseguente riduzione del momento magnetico effettivo di Os in funzione della temperatura.
Inoltre, dall’analisi di questi ultimi esperimenti, abbiamo ottenuto una dipendenza dalla temperatura del parametro d’ordine magnetico, che ci ha suggerito la pos- sibilità che la transizione metallo-isolante in NaOsO3 possa essere in verità una transizione del primo ordine piuttosto che del secondo ordine, in contrasto con le conclusioni di altri lavori scientifici. Al fine di accertare la natura della transizione di fase, abbiamo quindi eseguito misurazioni di magnetizzazione isotermica in prossimità della transizione di fase. L’analisi di tali set di dati mediante il cosiddetto metodo di Franco ha confermato che la transizione di fase nel NaOsO3è in realtà una transizione di fase del primo ordine.
Per concludere, da un lato i nostri risultati hanno fatto luce sul ruolo unico del magnetismo come forza trainante della transizione metallo-isolante in NaOsO3
e, dall’altro, hanno aperto nuovi scenari che richiederanno ulteriori misure per
chiarire in dettaglio il meccanismo che collega il magnetismo alla transizione metallo-isolante. Prevediamo quindi che il NaOsO3continuerà ad essere oggetto di intenso interesse nei prossimi anni e servirà da punto di riferimento per il confronto con altri sistemi simili.
Contents
Abstract i
Sommario iii
Introduction xix
1. Metal-Insulator Transitions 1
1.1. Slater MIT . . . 2
1.2. Mott Insulators . . . 4
1.2.1. Mott-Hubbard MIT. . . 4
1.2.2. Mott-Heisenberg MIT . . . 5
1.2.3. Examples of Mott Insulators . . . 6
1.3. Lifshitz transition . . . 8
2. Metal - Insulator Transitions in 5dsystems 10 2.1. Metal- Insulator Transition in NaOsO3 . . . 11
2.1.1. Evidence for Slater MIT . . . 12
2.1.2. Evidence for Mott-Heisenberg MIT . . . 18
2.1.3. Evidence for Lifshitz MIT . . . 20
2.1.4. Further discussion and outlook on MIT in NaOsO3 . . . 22
3. Experimental Techniques 23 3.1. X-ray Diffraction . . . 23
3.1.1. Theory . . . 23
3.1.2. Characterization Technique: Laue Diffraction. . . 25
3.1.3. Characterization Techniques: Single-Crystal X-ray Diffraction 26 3.2. Synchroton Radiation . . . 28
3.2.1. Synchrotron Radiation . . . 29
3.3. X-ray Free-Electron Laser (XFEL) Facility . . . 31
3.3.1. X-ray Free-Electron Laser Radiation . . . 32
3.4. Muon Source Facility . . . 33
3.4.1. Generation of Muon beam. . . 35
4. Resonant X-ray Diffraction on NaOsO3 37 4.1. Theory . . . 37
Contents
4.2. Multipole Matrix Elements. . . 40
4.3. Anisotropic Tensor Susceptibility (ATS) Reflections . . . 41
4.4. FDMNES Simulation Package . . . 42
4.5. Resonant X-ray diffraction on NaOsO3: Results and Discussion . . 42
4.5.1. Experimental Details . . . 42
4.5.2. Absence of crystallographic symmetry breaking . . . 43
4.5.3. ATS reflections across OsL2,3 edges . . . 44
4.5.4. Origin of the ATS reflection, (300) and its azimuthal angle dependence . . . 45
4.5.5. First Principle Calculations . . . 49
4.5.6. Summary . . . 51
5. Time-resolved Resonant X-ray Diffraction on NaOsO3 53 5.1. Models used to describe ultrafast magnetization dynamics . . . 56
5.2. Optical pump - Optical probe measurements . . . 59
5.3. Time-resolved resonant X-ray diffraction on NaOsO3: Results and Discussion . . . 61
5.3.1. Experimental Details . . . 61
5.3.2. Determination of the dynamic lattice response . . . 63
5.3.3. Measurement of the antiferromagnetic peak . . . 65
5.4. Summary . . . 68
6. Muon Spectroscopy and Magnetometry on NaOsO3 69 6.1. Muon Spectroscopy: Theory . . . 70
6.2. Muon Spectroscopy on NaOsO3: Results and Discussions . . . 73
6.2.1. Experimental Details . . . 73
6.2.2. Zero-field (ZF) and Longitudinal-field (LF)µSR . . . 73
6.3. Magnetization measurements on NaOsO3: Results and Discussions 79 6.3.1. Observation of thermal hysteresis . . . 79
6.3.2. Magnetocaloric Effect . . . 80
6.3.3. Franco Method . . . 81
6.4. Summary . . . 81
7. Conclusions and Outlook 83 A. FDMNES Simulation Package 87 A.1. FDMNES Input Files for Spectral Shape Calculation on NaOsO3 at OsL2,3edges . . . 89
A.1.1. For NaOsO3 crystal structure at T=300 K . . . 89
A.1.2. For NaOsO3 crystal structure at T=390 K . . . 91
A.1.3. For NaOsO3 crystal structure at T=420 K . . . 93 B. Calculations for temperature increase for different laser fluences 95
Contents
Bibliography 96
Acknowledgements 107
Curriculum Vitae 111
Publications 112
Conference contributions 114
List of Figures and Tables
1.1. Reproduced from Wikimedia Commons. Bandgap comparison of metals, insulators and semiconductors. . . 2 1.2. Simplified band structure: the opposite spin potential on each
neighboring ion splits the electronic band for different spin potentials (↑) and (↓), respectively, thus, creating an insulating band gap. . . . 3 1.3. Reproduced from Ref. [35]. Schematic of a Mott-Hubbard transition
for a system at half-filling. The simple case of a metallic band (left), filled up to the Fermi level,EF. AsUincreases, the spectral weight shifts towards two bands below and aboveEF, and eventually, at the Mott-Hubbard transition, the lower and upper Hubbard bands (LHB/UHB) separate out with an insulating gap. . . 5 1.4. Insulating gap is characterized by the charge-transfer gap,∆. . . 8 1.5. Reproduced from Ref. [50]. Example of a topological transition with
the change of a Fermi surface topology. . . 9 2.1. Reproduced from Ref. [12]. Slater MIT (left) where commensurate
AFM order doubles the unit cell. (Right) Simplified band structure.
The opposite potential on each neighboring ion in the magnetic regime splits the electronic band, creating an insulating band gap. . 11 2.2. NaOsO3 in its antiferromagnetic state belowTN with Os magnetic
moments (red arrows) lying along thec-axis.The OsO6 octahedral cage is coloured in grey. . . 12 2.3. Reproduced from Ref. [11]. Temperature dependence of magnetic
susceptibility χ, measured separately below 300 K (squares) and above 300 K (circles). The inset shows a plot of the inverse suscepti- bility data above 410 K, and the line is the Curie-Weiss fit, yielding effective Bohr magneton to be 2.71µB. . . 13 2.4. Reproduced from Ref. [11]. Temperature dependence of (a) electrical
resistivityρ(b) Hall coefficientRH, and (c) Specific heatCpof NaOsO3. The inset shows an expansion ofρvs T, DSC curves, andCp/TvsT2 (solid line is a fit to the data) at the low-temperature limit. . . 13 2.5. Reproduced from Ref. [60]. Spin density plot of Os ions in the a-c
plane atUe f f = 1 eV, where this system becomes insulating. The different colors indicate the opposite spin orientation in the G-AFM alignment. . . 14
List ofFigures andTables
2.6. Reproduced from Ref. [12]. Integrated intensity of magnetic peak as a function of temperature measured using polarized neutron diffraction. . . 15 2.7. Reproduced from Ref. [12]. Refined structural parameters from neu-
tron powder diffraction. The vertical dashed line indicatesTMIT. The insets of (d) and (e) are a representation of the crystallographic bond lengths and angles considered, with the larger spheres indicating the Os ions and the small spheres indicating the oxygen ions. The crystal structure shows an anomaly in the a and c lattice constants at TMIT. However, there is no indication of a structural symmetry change. 15 2.8. Reproduced from Ref. [64]. Temperature evolution of the energy
gap extracted from optical conductivity measurements. . . 16 2.9. Reproduced from Ref. [13]. (a) The shaded regions distinguish the
low temperature magnetic-insulating and high temperature non- magnetic metallic phases in NaOsO3. The measured phonon mode frequencies obtained from inelastic neutron scattering and (b) from DFT calculations both show strong agreement and reveal a phonon shift at the Slater transition of∆ω=40cm−1. The DFT calculations allow the identification of the lattice deformation modes withB2g
being the largest. These deformation modes are illustrated in (c) where the separate lattice distortions, involving Os–O interactions, are shown with the directions indicated by the red arrows. Ag (in phase) and B3g(out of phase) correspond to asymmetric stretching.
B1g(in phase) and B2g(out of phase) represent symmetric stretching breathing modes. . . 17 2.10. Reproduced from Ref. [14]. (a) and (b) Measured (squares) and
calculated (line) dispersion revealing the large spin-gap. (c) The calculations were performed using a minimal model Hamiltonian with the exchange interaction parameters J1 = J2 = 13.9 meV. On adding the third-nearest-neighbor term, the exchange interactions J3
=J4 were found to have a magnitude appreciably less thanJ1orJ2. 18 2.11. Reproduced from Ref. [67]. Brillouin zone of orthorhombic lattice.
b1,b2,b3represent the reciprocal lattice space vectors along the crystal axes, with b2 being along the long axis i.e. b-axis. . . 19 2.12. Reproduced from Ref. [16]. Paramagnetic spin fluctuations in
NaOsO3at 450 K. (a) Experimental data collected at various crystal momenta. (b) Comparison of the WAFL model (solid line) with experimental data. The dashed line is a momentum independent high-energy contribution. . . 20 2.13. Reproduced from Ref. [21]. Change of slope in resistivity at TA is
attributed to the onset of a pseudogap. . . 21
List ofFigures andTables 3.1. Schematic diagram of the diffraction condition, with the incoming
wave diffracted by the planes of atoms of the crystal. Black dots represent atoms spaced by a distance,a. . . 24 3.2. Schematic diagram of the Laue back-reflection mode. Incoming
X-rays are diffracted by the sample forming arrays of diffraction spots recorded by the CCD camera. . . 25 3.3. Laue photographs of (a) high quality single crystal and (b) polycrys-
talline NaOsO3. . . 25 3.4. Seifert 4-circle X-Ray Diffractometer at PSI. The four circles corre-
spond to the rotatable theta (θ), two-theta (2θ), phi (φ) and chi (χ) angles, respectively. . . 27 3.5. Theta-scan of (080) reflection of single crystal NaOsO3taken with
the Seifert 4-circle X-Ray Diffractometer at PSI. . . 27 3.6. Reproduced from Ref. [68]. Schematic of the chemical mechanical
polishing process of a sample, where the sample sits on the base of the carrier whose weight is adjusted according to the pressure one wants to apply, and this rotates over a rotating disc on which the polishing slurry is lathered upon. . . 28 3.7. Reproduced from Ref. [69]. The brilliance of light sources over the
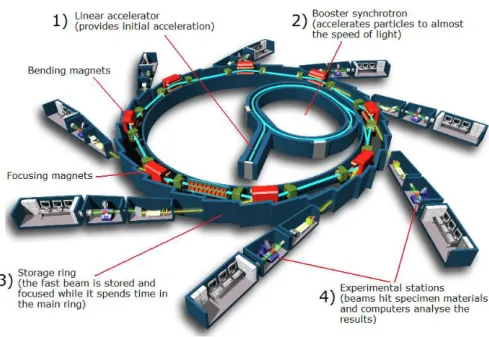
years. . . 29 3.8. Schematic of a Synchrotron. Picture credits attributed to EPSIM
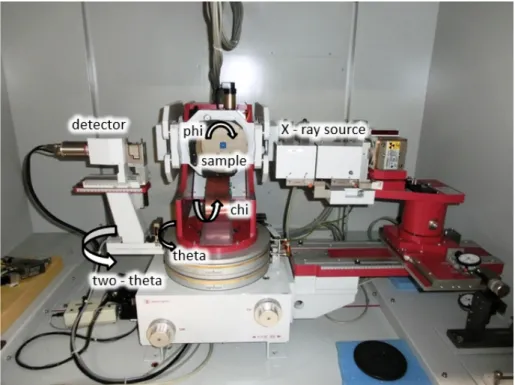
3D/JF Santarelli, Synchrotron Soleil. . . 30 3.9. Photograph of the 6-kappa diffractometer at I16 beamline. The
6-circle angles are in accordance to those mentioned in Ref.[70].
When the angles mu and gamma are set to zero, the diffractometer is essentially a conventional four-circle diffractometer for which the theta (θ) and two-theta (2θ) angles are named eta (η) and delta (δ), respectively. Image courtesy: Dan Porter, I16 beamline scientist. . . 31 3.10. Reproduced from Ref. [72]. Schematic diagram of 700 m long
undulator at XFEL Facility, SACLA, Japan. . . 32 3.11. Reproduced from Ref. [73]. Variation of the angular distribution
for different asymmetry parameters,A, corresponding to positrons emitted with different energies. . . 34 3.12. Reproduced from Ref. [74]. The PSI 590 MeV cyclotron. . . 35 3.13. Reproduced from Ref. [74]. Principle of the muon beamline. . . 36
List ofFigures andTables
4.1. Figure reproduced from Ref. [76]: Schematic illustration of the elastic resonant scattering process. (Left panel) In the first step an incoming photon (represented byEnergy= hν1) is absorbed by the scatterer atom and a core electron (represented by an arrow, with spin up) is promoted into an unoccupied state close to the Fermi level. (Middle panel) This results in an intermediate electronic state with an electron and a hole (represented by a circle) in the core level. (Right panel) The intermediate state then decays via recombination of the excited electron with the core hole and a photon is emitted (represented by Energy=hν1). In the resulting final state, the electronic configuration of the scatterer atom is identical to that of the initial state. . . 38 4.2. Reproduced from Ref. [76]: Schematic geometry of an Resonant
X-ray Scattering experiment. . . 40 4.3. (Top panel) Energy dependence of the intensity of the (030) forbidden
reflection at fixed momentum transfer for selected temperatures illustrating the peak intensity variation across the MIT at OsL3(left) andL2edge (right) edges for azimuthal angle,ψ ∼90◦. The X-ray absorption spectra (ABS) measured at the same energy range are also shown. (Bottom panel) Same as above, but for the (300) reflection.
The azimuthal angle in this case wasψ ∼0◦. . . 45 4.4. Azimuthal dependence of the (300) forbidden reflection at the res-
onant energyEA(closed circles). The observed signal is consistent with aσ−π0 origin (continuous line). . . 46 4.5. (300) Space-group forbidden Bragg peak and (330) magnetic peaks
were measured as a function of temperature. The estimated critical exponentsαhklfor the two reflections areα300=1.7±0.1 andα330= 0.72±0.08, respectively, implyingα300 ∼2×α330. In the inset, the same data in the vicinity of TN and normalized by the intensities of the respective reflections measured at T = 395 K are shown, demonstrating the different critical behavior of the two reflections. 47 4.6. Reproduced from Ref. [22]. FDMNES simulations of the temperature
dependence of the intensity of the (030) reflection (top row) and of the (300) reflection (bottom row). All plots show energy scans at fixed momentum transfer at selected temperatures, and an X-ray absorption spectrum (ABS) across the OsL3edge. All simulations were performed with a cluster radius of 6 Å. Panels (a), (b) display the simulations for the (030) reflection spectra excluding (no SOI) and including (SOI) the effect of the spin-orbit interaction (SOI).
Panels (c), (d) show simulations performed on the (300) reflection. . 50
List ofFigures andTables
4.7. Reproduced from Ref. [22]. (a) Isosurface of the 5delectron density of Os ions in the insulating state of NaOsO3. The isosurface colors highlight the symmetry relation between the Os ions in the unit cell, i.e., Os ions sitting at (0 0 1/2) and at (1/2 0 0) positions are related by a rotation about thecaxis of 180◦. For clarity, only osmium and oxygen atoms were selected (represented as green and red spheres for Wyckoffpositions 4c and 8d, respectively) are shown. (b), (c) are the reconstructed 5delectron density distributions for the metallic and the insulating phases, respectively. . . 52 5.1. Reproduced from Ref. [97]. Schematic of a time-resolved resonant
X-ray diffraction experiment. X-ray pulses produced by an undulator are used to monitor the time evolution of a selected Bragg peak as a function of the delay∆tbetween the infrared (IR) laser pulse (pump) and X-ray probe pulse. . . 54 5.2. Reproduced from Ref. [98]. Three basic classes of insulators and
their characteristic response times: (a) Mott insulator, (b) Excitonic insulator, and (c) Peierls insulator. For each case, the characteristic signatures of the insulating state (solid lines, coloured shading) following the transition from a metallic state (dashed lines, grey shading) are illustrated: in real space, the introduction of a periodic modulation of the valence-electron density and, if applicable, of the atomic positions, and in energy-momentum space, the opening of an energy gap (∆). (d) Corresponding timescales of the responses to im- pulsive near-infrared excitation, and their assignment to elementary model-specific processes.. . . 55 5.3. Reproduced from Ref. [109]. a) Schematic diagram of the three
temperature model showing the time constants for interaction of the electron, spin and lattice reservoirs. b) Using the three temperature model equation, the effective temperatures for different reservoirs, and their timescales, can be estimated. . . 56 5.4. Reproduced from Ref. [104]. Schematic of a holon-doublon model.
(a) The band structure of a Mott insulator with schematics of the electronic configuration corresponding to the lower (LHB) and upper Hubbard bands (UHB). The pink arrow indicates the band gap optical excitation with photon having energyhν. (b) Magnetic structure of a Mott insulator subjected to the band gap excitation.
The staggered pattern of the blue and red circles denotes lattice sites hosting electrons having spins S pointing “up” or “down,” thus forming two oppositely oriented magnetic sublattices. Pink arrows denote light induced hops of electrons between individual magnetic sublattices resulting in melting of the magnetic order. . . 58
List ofFigures andTables
5.5. Time traces of change in the reflectivity on NaOsO3 single crystal upon excitation with 800 nm laser pulses with different laser fluences. 59 5.6. The minimum value of the change in reflectivity (∆R/R) for each
fluence extracted from Fig. 5.5 is plotted as a function of fluence.
This is fitted with an exponential function, as a guide to the eye, to highlight the saturation observed around fluence≈4 mJ/cm2. . . . 60 5.7. Reproduced from [112]. Schematic of the X-ray grazing incidence
diffraction geometry, used to match laser and X-ray penetration depths. Wave vectors
−
→ ki and
−
→
kf are the incident and scattered wave vectors, respectively. The linear position-sensitive detector is oriented parallel to the sample surface. Incoming X-rays probe the sample at a grazing incidence,αi, and are then scattered onto a 2D detector. . . 61 5.8. Photograph of the sample holder with the sample between silicon
pads. Both sample and silicon pads were glued to a copper plate with silver epoxy. . . 62 5.9. (a) Time trace of the change in intensity of the structural peak (1¯22)
measured for the highest fluence. (b) Time traces of the change in intensity of the structural peak (2¯40) measured upon photoexcitation for two different fluences. . . 63 5.10. Rocking scans around the structural peak (1¯22) at different time
delays. The intensity drops at higher time delays, and shifts to lower phi-angles, implying expansion of lattice. The curves are shifted vertically for clarity. . . 64 5.11. Time traces of the change in intensity of the antiferromagnetic peak
(1¯50) upon photoexcitation measured for different laser fluences. . 65 5.12. Rocking scans around the antiferromagnetic peak (1¯50) at different
time delays. The red line correspond to the Gaussian fits. The curves are shifted vertically for clarity. . . 66 5.13. (a) Maximum intensity (b) FWHM of magnetic peak (1¯50) resulting
from fits for different time delays. . . 67 6.1. Reproduced from Ref. [21]. Change of slope in resistivity at TA is
attributed to the onset of pseudogap. . . 69 6.2. Schematic of the muon implantation into the sample and its decay
into positron (e+), an electron antineutrino (νe) and a muon neutrino (νµ). The emitted positrons are detected by positron detectors placed around the sample. Image courtesy of Andreas Suter (PSI) [74]. . . 71
List ofFigures andTables
6.3. Reproduced from Fig. [73]. Backward (B) and Forward (F) detector setup for LF and ZF-µSR. The magnetic field direction is along thez axis and no precession is expected when the internal magnetic field is absent. Only thezcomponent of the spin polarization vector will be measured. Note that ZF-µSR is the limiting case whereH=0. . 72 6.4. Muon stopping sites at center of three different rhombi of the unit cell. 74 6.5. Zero-field measurements taken at low temperature. (a) clear beating
is indicative of multiple frequencies. (b) Fourier transform of the time-spectra shown in (a) indicates the presence of three frequencies corresponding to the mentioned internal fields 167.73, 178.97, 265.29 mT, respectively. . . 74 6.6. Evolution of the three peaks as a function of temperature. . . 75 6.7. Temperature dependence of the order parameter (black dots). The
red line represents a fit performed using Eq. 6.6. . . 76 6.8. ZF-µSR time spectra (grey circles) at three different temperatures.
Muon depolarization fitted (red line) with Eq. 6.7 with increasing temperature. . . 78 6.9. Temperature dependence of the dynamical longitudinal relaxation
rate (λL) extracted by fitting LF-µSR time spectra with Eq. 6.7. . . . 78 6.10. Field cooled temperature dependent magnetization measured with
µ0H=0.01 T while cooling (FCC) and warming (FCW). Inset: mag- nified nearTN. . . 79 6.11. Normalized change in magnetic entropy nearTN. Inset: Isothermal
Arrott-Belov curves above and belowTN. . . 80 A.1. FDMNES . . . 88
Introduction
The quest to understand materials and their physical properties dates back to 600 BC, when the Greek philosopher Thales of Miletus noted that lodestone attracts iron. Since then, research on materials has seen incredible leaps in terms of dis- coveries of novel phenomena and their understanding, leading to the creation of devices pervading every aspect of our daily life (such as Si-based transistors [1]), and paving the way for future technological advancements.
Within solid state materials, 3dtransition metal oxides have attracted considerable interest due to the novel phenomena that they host, including high temperature superconductivity (most notably in cuprates [2] and pnictides [3]), colossal mag- netoresistance [4,5], and metal-insulator transitions [6,7]. This richness of the displayed phenomena stems from the presence of several competing interactions associated with the lattice, charge, orbital and magnetic degrees of freedom. For example, it was soon realized that Coulomb repulsion and magnetic exchange interactions should be correctly taken into account in order to qualitatively and quantitatively describe the observed physical properties of most of these materials.
An important point to stress is that, for 3dtransition metal oxides, the spin orbit interaction (SOI) is often neglected, as its energy scale is negligible compared to other interactions. However, SOI becomes significant for elements such as rare earths or 5d transition metals since, when the atomic number Z increases, the strength of SOI increases, being proportional toZ4. Such materials therefore offer possibilities to host a different hierarchy of interactions that could lead to new physical effects and holds the promise of advances in theoretical understanding as well as the potential for new applications in devices. Indeed, recent advances in sample fabrication and experimental techniques have already led to new insights into the physics of compounds with 5delectron systems. In particular, there have been several studies focusing on the interplay between the spin-orbit interaction, the Coulomb repulsion and the bandwidth in Iridates [8,9,10] and to a lesser extent in Osmates [11,12,13,14,15,16]. Research in these systems has resulted in the discovery of novel phenomena such as topological insulating phases [17,18], spin liquid behavior [19] and bulk insulating states [9].
One such 5d oxide system, NaOsO3, has recently attracted significant attention as it was proposed to provide the first realization of magnetically driven MIT
Introduction
[11], following a model proposed by Slater 50 years ago [20]. Such a proposal ignited a flurry of research into the metal-insulator transition of this material which, despite many efforts, did not offer yet a clear picture of the complex behaviour of NaOsO3. The aim of this thesis is therefore to further elucidate the nature of the metal-insulator transition in NaOsO3. A comprehensive study revealing the different facets of this transition using a variety of experimental techniques such as resonant X-ray diffraction, time-resolved resonant X-ray diffraction, and muon spectroscopy will be presented.
The thesis is structured as follows:
In Chapter 1, a historical overview of the development of models explaining the existence of insulating and metallic behaviour as well as an introduction to different physical mechanisms invoked to explain metal-insulator transitions is presented. Specifically, mechanisms relevant to the material of interest of this thesis, NaOsO3, are introduced, such as the magnetically driven Slater insulator, the correlated Mott insulator and the Mott-Heisenberg insulator, as well as the Lifshitz transition driven by change in Fermi surface topology.
In Chapter2, we review the preceding literature and summarize recent experimental results that have been gathered on NaOsO3as well as different theoretical models that have been proposed to explain the metal-insulator transition by ascertaining the hierarchy of the different energy terms present in NaOsO3 metal-insulator transitions.
In order to understand the microscopic mechanism of the metal-insulator tran- sition in NaOsO3, we have combined standard characterization techniques and experiments performed at the large scale facilities, such as the Diamond Light Source Synchrotron, the SACLA X-ray Free Electron Laser Facility and the Swiss Muon Source. Chapter3is dedicated to introducing the experimental methods we have used to ascertain the nature of the metal-insulator transition in NaOsO3. A particular emphasis is put on explanation of the complex infrastructure necessary to perform such experiments.
In Chapters 4, 5, 6, we then discuss in detail the results of the experiments performed at these respective facilities.
Chapters 4 contains results and discussions on the resonant X-ray diffraction NaOsO3experiments performed at Diamond Light Source Synchrotron, UK. Since resonant x-ray diffraction uses the resonant process of electronic excitations, one obtains direct access to element specific spectroscopic information. In our case, of interest is the Os ion, which is responsible for the magnetic properties of the
material. Specifically, we have observed the emergence of the (300) Bragg peak in the resonant condition with the onset of magnetic order. The intensity of this space-group-forbidden Bragg peak continuously increases with decreasing temper- ature in line with the square of intensity observed for an allowed magnetic Bragg peak. As a result, we could infer that the change in Os electron density across the metal-insulator transition is driven by magnetism.
These results motivated us to try to compare the timescales of different inter- actions, by ascertaining the time-evolution upon photo-excitation of the intensity of the diffraction peaks associated with magnetic, electronic and structural order.
These time-resolved resonant X-ray diffraction experiments on NaOsO3were per- formed at the X-ray Free Electron Facility, SACLA, Japan. Chapter5, contains results and discussions on our observations, where the sub 100 fs melting of the antiferromagnetic order upon photo-excitation is revealed.
Having realized the importance of magnetism for the development of a change in the electron density leading to the insulating state, and with the recent [21]
proposal of the metal-insulator transition consisting of a smooth change of the Fermi surface topology driven by spin-fluctuations, we subsequently performed muon spectroscopy on NaOsO3, which is described in Chapter6. The aim was to explore the role of spin-fluctuations in the evolution of the metallic state of the system as a function of temperature. Following the results from muon spectroscopy, speculation on the order of the metal-insulator transition was raised, and we thus performed detailed magnetization measurements around the metal-insulator transition on NaOsO3. On careful analysis, we unexpectedly found that the metal- insulator transition presents a small hysteresis in the temperature dependence of the magnetization between cooling and heating curves, which points to the presence of a coexistence of metallic and insulating phases. Such behaviour is indicative of a first order phase transition. Such a result, thus questions the existing models that have so far been proposed.
Lastly, we present our Conclusions and Outlook in Chapter 7, summarizing our key findings on the elusive nature of the metal-insulator transition in NaOsO3. As we shall see, this system will continue to be a hotbed for research due to the non-trivial interplay between magnetic, electronic and structural interactions, and our results will serve as a guide into exploration of microscopic mechanisms taking place in other transition metal oxide systems sitting on the verge of phase transitions.
Additionally, an Appendix with the code used for FDMNES Simulations to simulate results obtained from resonant X-ray diffraction is provided with descriptions, and an Appendix for the detailed calculations for temperature rise in NaOsO3upon photoexcitation with different laser fluences is provided.
Introduction
Contributions
The work presented in the thesis has been performed as part of a research team. For clarity, an overview of the contributions of the PhD student, Namrata Gurung, are described explicitly here for each chapter, including collaborations and supervision.
Chapter 4
I Characterized and polished NaOsO3single crystals with the required sample orientations for the X-ray experiments.
I Performed resonant X-ray diffraction experiments with Valerio Scagnoli and support of beamline scientists at the I16 beamline, Diamond Light Source, UK.
I Performed extensive FDMNES Simulations under the guidance of Yves Joly, Institut NèeL CNRS, France.
I Analysed the data and interpreted the results with supervision of Valerio Scagnoli.
I Wrote a manuscript published in PRB [22] with contributions from all authors.
Chapter 5
I Characterized and polished NaOsO3single crystals with the required sample orientations for the XFEL experiment.
I Performed time-resolved resonant X-ray diffraction experiment at the X-ray Free Electron Laser Facility, SACLA, Japan at BL3 beamline. The beamtime was performed with an experimental team comprising several scientists from PSI, along with the support of beamline scientists at SACLA.
I Performed optical pump-optical probe measurements at PSI in collaboration with Serhane Zerdane, from PSI.
I Performed data analysis on the big datasets obtained from XFEL after discus- sions with scientists Paul Bead, Urs Staub and Steve Johnson from PSI.
I Modified codes written by Vincent Esposito, Serhane Zerdane from PSI to clean datasets obtained from XFEL experiments in order to obtain final datasets that were then used for fitting.
I Analysed the data and interpreted the results with several rounds of discus- sions with the other members of the XFEL experimental team, under the supervision of Valerio Scagnoli.
Chapter 6
I Performed muon spectroscopy measurements on NaOsO3 polycrystalline pellet in collaboration with Valerio Scagnoli, Joel Verezhak and Chennan Wang at the Swiss Muon Source, PSI.
I Interpreted muon spectroscopy results with Hubertus Luetkens, Valerio Scagnoli, and Chennan Wang.
I Performed several magnetization measurements on NaOsO3 pellets and NaOsO3 single crystals up to 390 K. Higher temperature magnetization measurements were performed by Nick Bingham, Yale, US.
I Preparing the first draft of a manuscript to be submitted to PRL with contri- butions from all authors.
1. Metal-Insulator Transitions
Why are metal-insulator transitions interesting? What are their origins? What are the different physical mechanisms explaining the occurrence of the metal-insulator transitions present?
Metal-Insulator transitions (MITs) have been a topic of intensive research for about a century, and have been crucial in developing a deep understanding of physical properties of materials. Such progress has enabled breakthroughs in our understanding of electron-electron interactions as well as providing the necessary tools to realize substantial for technological advancements especially within the semiconductor industry e.g. in building traditional transistors [1].
The aim of this chapter is to provide a brief overview of different physical mecha- nisms explaining the occurrence of metal-insulator transitions and highlight the ones that will be relevant for discussions throughout the thesis.
The first successful theoretical description (Bethe, 1928 [23]; Sommerfeld, 1928 [24];
Bloch, 1929 [25]) explaining the existence of metals and insulators was based on non-interacting or weakly interacting electron systems. The theory was based on the filling of the electronic bands, which is a result of the periodic lattice structure of atoms in crystals (see Fig. 1.1): for insulators the highest filled band is completely filled, and for metals, it is partially filled. By the early 1930s, the concept of semiconductors i.e. insulators with a small energy gap between the highest filled band and lowest empty band was also established (Wilson, 1931 [26,27]; Fowler, 1933 [28,29]).
The insulating behavior of a material could be understood in terms of single electrons that interact with the electrostatic field of the static ions. These insulators were broadly be divided into the following two classes (cf. F. Gebhard 1997, p. 4):
1. Bloch–Wilson or band insulators [25,30] due to the electrons’ interaction with the periodic potential of the ions.
2. Peierls insulators [31] due to the electrons’ interaction with static lattice deforma- tions.
However, such a scheme proved its limitations when de Boer and Verwey (1937) reported that many transition-metal oxides (e.g. NiO [32]) with a partially filled d-electron band were often insulators. The importance of the electron-electron interaction [Slater [20], Mott [33]] was thus highlighted, and it was realized that
1. Metal-InsulatorTransitions
Figure 1.1. Reproduced from Wikimedia Commons. Bandgap comparison of metals, insulators and semiconductors.
strong Coulomb repulsion between electrons cannot be ignored and often can be the origin of an insulating behavior. Such observations thus launched the long and continuing history of the field of metal-insulator transitions [7], aiming at ascertaining the mechanisms by which an insulator could become a metal as controllable parameters (temperature, pressure, chemical doping) were varied.
In the following sections, I shall focus on metal-insulator transitions where it is important to include the electron-electron interaction in order to explain the insulating behavior of such materials.
1.1. Slater MIT
Slater combined the features of band and Peierls insulators, concluding that interacting electrons can generate a spin-density wave commensurate with the lattice, which can then change the band structure, causing an insulating state to occur (cf. F. Gebhard 1997, p. 33).
The band insulator arises from the energy gap between the valence and conduction bands due to the periodic lattice structure. In contrast, the Peierls insulator shows that the band structure can be changed resulting from the formation of a superlattice structure due to electron–lattice interactions. Thus, in analogy to the Peierls mechanism, interacting electrons could also generate a periodic modulation of electrons’ spatial charge and/or spin distribution – i.e., charge- and/or spin- density waves altering the band structure which in the Slater case is stabilized by the electron–electron interactions instead of the electron–lattice interactions.
The principle behind the Slater insulator mechanism can be explained as follows:
imagine antiferromagnetically alignedselectrons on a bipartite lattice (see Fig.1.2).
1.1. SlaterMIT
This lattice can be represented as two interpenetrating sublattices (A (blue) with
↑ spin and B (red) with ↓ spin) such that the nearest neighbors of any site are members of the opposite sublattice with one electron per site on average. Since the ↑ electrons repel ↑ electrons, and ↓ electrons repel ↓ electrons, the ↑ and ↓ electrons would arrange themselves preferentially such that they are on alternating lattice sites to minimize their interaction. Thus, they will then form a spin-density wave with wave vector, Q which would be commensurate with the lattice. In the corresponding band structure picture, the lattice unit cell will be doubled and the first Brillouin zone would be cut in half. Thus, at the boundaries of the new (magnetic) Brillouin zone, the bands would be split. This band splitting creates a gap and the system thus becomes an insulator.
Figure 1.2. Simplified band structure: the opposite spin potential on each neighboring ion splits the electronic band for different spin potentials (↑) and (↓), respectively, thus, creating an insulating band gap.
Slater’s theory can be formally obtained from the Hartree–Fock calculation for electrostatically interacting electrons. From this, one can derive that the (relative) magnetic moments form and order at the Néel temperatureTN, which is proportional to the interaction strength. On a bipartite lattice and for hopping between A and B sites, a gap for charge excitations would then open at the same temperature, leading to a phase transition into an insulator occurring atTN, thusTMIT =TN. Also, since this is purely due to magnetic moments ordering with wave vector commensurate with the lattice, one will not observe crystallographic symmetry breaking for this metal-insulator transition.
Thus one can define a Slater transition as follows:
"The Slater metal-insulator transition occurs solely due to antiferromagnetic ordering commensurate with the lattice."
1. Metal-InsulatorTransitions
1.2. Mott Insulators
In the above scenario, only electrostatic electron interactions were considered.
However, in the case of Mott insulators, we solve a many-body electron problem, where the insulating behavior is understood as a cooperative many-electron phenomenon.
Mott described a metal-insulator transition [33] with the notion that it depends "...on the existence of moments and not on whether or not they are ordered”. Therefore, Mott’s decisive criterion is the existence of pre-formed local moments regardless of whether or not they are ordered. According to Mott’s theory, the moments appear since the electrons try to avoid each other to minimize their Coulomb repulsion and the electrons may, but need not, localize on different sublattices as in Slater’s view (cf. F. Gebhard 1997, p. 35).
Thus one can define a Mott insulator as follows [34]:
"For a Mott insulator the electron–electron interaction leads to the occurrence of local moments. The gap in the excitation spectrum for charge excitations may arise either from the long-range order of the pre-formed moments (Mott–Heisenberg insulator) or by a phase transition induced by charge and/or spin correlations (Mott–Hubbard insulator)."
1.2.1. Mott-Hubbard MIT
Hubbard was the first to introduce explicitly a correlation term,Uinto the Hamil- tonian for band-conductivity calculations.
Mott [33] gave the following physically instructive example for a metal–insulator transition: consider the arrangement of hydrogen atoms with Bohr radiusaB on ann-dimensional cubic lattice with lattice constanta. Assume that electrons may hop between neighboring atoms. Then the “tight-binding” approximation for independent electrons (tunneling between nearest neighbors on a cubic lattice) results in a cosine dispersion relation:
ε(k)=−2t Xn
l=1
cos(kla) (1.1)
that describes how the energy varies with crystal momentum,k. The wavevector kis defined inndirections depending on then-dimensions of the lattice e.g. for two-dimensions, k = k1i+k2j. The bandwidth W = 2Nt, where N = 2n is the number of nearest neighbors, andt>0 is the tunneling amplitude which depends on a/aB. At large distances between the hydrogen atoms, a >> aB, the overlap between the atomic wave functions is small, which implies W << U, where U is the Hubbard term describing the intra-atomic energy. We can then find an energy gap for charge excitations at half band-filling, implying that the system is
1.2. MottInsulators
an insulator (see Fig. 1.3). If, we now reduce the distance between the hydrogen atoms, which would increase the overlap in their atomic wave functions, thenW increases accordingly, and fora≈aB, the gap for charge excitation vanishes. Thus forW >>Uthe system is a paramagnetic metal. For intermediate values, around U≈W, we expect a metal–insulator transition. This metal-insulator transition is therefore a direct consequence of electron correlations (cf. F. Gebhard 1997, p. 37).
Figure 1.3. Reproduced from Ref. [35]. Schematic of a Mott-Hubbard transition for a system at half-filling. The simple case of a metallic band (left), filled up to the Fermi level,EF. AsUincreases, the spectral weight shifts towards two bands below and above EF, and eventually, at the Mott-Hubbard transition, the lower and upper Hubbard bands (LHB/UHB) separate out with an insulating gap.
Thus one can define a Mott-Hubbard insulator as follows [34]:
"For a Mott–Hubbard insulator, the electron–electron interaction leads to the formation of a gap. The electron correlations force a phase transition from a correlated metal to a paramagnetic Mott–Hubbard insulator, in which the local magnetic moments do not necessary display long-range order."
1.2.2. Mott-Heisenberg MIT
In the above discussion of the Mott–Hubbard insulator, the possibility of an ordering of magnetic moments was not considered. Thus, we now describe a Mott–Heisenberg insulator for which the insulating state displays long-range order. In the previous subsection, the exchange interaction between localized spins was completely ignored. For the half-filled ground state with all electrons localized, one obtains an antiferromagnetic coupling with J ≈ t2/Ubetween the electrons on neighboring lattice sites. For large interactions whereU >> W, at half band-filling the energy scales for charge excitations (∆µ≈ U−W) and spin excitations (J ∼t2/U) are well separated. However, for the cases whereU≈Wis finite, the spin energy scale cannot be ignored for temperatures around or below that of the corresponding exchange interaction. Thus, the local magnetic moments in the Mott–Hubbard insulator may undergo long-range ordering and the system
1. Metal-InsulatorTransitions
goes from the Mott–Hubbard insulator to the (antiferromagnetic) Mott–Heisenberg insulator at the Néel temperature,TN. However, the size of the local moments does not change much in the transition from a paramagnetic (correlated) metallic state into the (antiferromagnetic) Mott–Heisenberg insulating state (cf. F. Gebhard 1997, p. 38).
Thus one can define a Mott-Heisenberg insulator as follows [34]:
"The Mott–Heisenberg insulating state is the result of a thermodynamic phase transition in which the pre-formed local (magnetic) moments (antiferromagnetically) order below the critical (Néel) temperature."
Above the Néel temperature, the Mott–Heisenberg insulator becomes paramagnetic, which can either be a correlated metal or a Mott–Hubbard insulator.
Thus, the difference between “Slater insulator” and “Mott–Heisenberg insulator”
is as follows: in Slater’s picture (Sec.1.1) not only the long-range order but also the local magnetic moments are absent above the Néel temperature. However, in the case of Mott-Heisenberg picture, the moments are already present in the Mott–Heisenberg insulating state and remain in the paramagnetic metallic phase above the transition temperature.
1.2.3. Examples of Mott Insulators
Wigner Insulator
According to Wigner [36], free electrons in a homogeneously positively charged background may localize at low densities (cf. F. Gebhard 1997, p. 39). At low densities the Coulomb interaction would dominate and the electrons should thus localize into the “Wigner lattice” at zero temperature. Hence there will be a critical temperature for the melting of the Wigner lattice into a “Wigner liquid” wherein the electrons are mobile again and thus becomes metallic. Experimentally, a Wigner crystal is formed by electrons on a liquid Helium surface [37]. The Wigner crystal is a charge-density wave state which is is pinned by impurities, and thus an insulator. Localization effects are stronger in lower dimensions because the average kinetic energy vanishes more rapidly as a function of density. Hence, the Coulomb interaction is stronger in lower dimensions due to the restricted phase space. An example of such an insulator has been observed in two-dimensional electron gas in heterostructures made out of gallium-arsenide and aluminum-gallium-arsenide (GaAs/AlGaAs) when subjected to high magnetic fields [38,39] .
Verwey Insulator
Similar to the above Wigner insulator scenario, an electronic charge-density wave forms at the Verwey transition. The difference to the Wigner crystal is that, in the
1.2. MottInsulators
Verwey insulator, the wavelength of the charge-density wave is of the order of the lattice constant, and often commensurate with the underlying ion lattice. A transition into an electronic charge-density wave was first observed by Verwey for magnetite (Fe3O4) [6, 40] at a temperature T ≈ 120 K. Below the Verwey temperature, one observes a commensurate charge-density wave with wave vector perpendicular to the (011) planes. These planes have sites that are alternately occupied with Fe2+and Fe3+ions. The underlying lattice structure plays little role for the Wigner insulator, whereas it becomes important for the Verwey insulator where the charge-density wave is commensurate with the lattice structure (cf. F.
Gebhard 1997, p. 40).
Multi-band Mott Insulator
As described in Sec. 1.2.1, Mott started from a single band of s electrons with variable distance between their orbitals. In most real materials, the s electrons always form broad bands and their mutual Coulomb interaction is well screened.
Hence, correlation effects insbands are frequently almost negligible. Correlations are more important for thedelectrons of the transition metals (e.g., vanadium (V), iron (Fe), nickel (Ni), and copper (Cu)) because their bandwidth (W) is substantially smaller than that ofsbands. The Hubbard parameterUthen includes interactions such as Hund’s coupling, and crystal field effects. From the band picture all oxides would be metallic since the d bands would be partially filled however, this is not the case, so that the prediction of band structure theory is not accurate.
Nevertheless, the band model is useful for estimating the importance of screening.
For example, for CaO and TiO, the antibonding 4sbands and 3dbands are predicted to overlap strongly and cross the Fermi energy. Thus, the band structure calculation indicates that the Hubbard interaction is screened well enough in CaO and TiO for the metallic behavior to exist even in the presence of electron correlations (cf.
F. Gebhard 1997, p. 43). However, this is not the case for the transition-metal oxides from manganese (Mn) through copper (Cu) where the 4s bands are split offfrom the 3d bands. Thus, the Coulomb interaction in the (narrow) 3dbands becomes very important, and these transition-metal oxides are indeed found to be (Mott) insulators. Some examples of Mott insulators are VO2 [41,42], V2O3
[43,44], cuprates [45]. This becomes even more interesting as one goes down the periodic table, when counter-intuitively, more spatially extended 5dorbitals e.g.
iridates, osmates [9,11] (more extensively discussed in Chapter2) are also found to be insulating. This is because the spin orbit coupling,λwhich increases∝Z4 (where Z is the atomic number) can no longer be excluded yielding rich phase phase diagrams with novel ground states with respect to change in temperature, pressure, chemical doping [46].
1. Metal-InsulatorTransitions
Charge-Transfer Insulator
In transition metal oxides, the transition metal cations are coordinated to inter- mediate ligands, resulting in a finite interaction of the oxygenp-orbitals with the transition metald-orbitals. In effect, the oxygen p bands could energetically lie between the two Hubbard bands (see Fig1.4). In this case the energy for a charge excitation is no longer determined by the HubbardUbut instead by the “charge- transfer” energy∆[47,48]. The transport of an electron from the transition-metald level to another transition-metal atom requires the Hubbard energy:
U =E(dn+1)+E(dn−1)−2E(dn) (1.2) whereas to shift an electron to an oxygenplevel, the charge-transfer energy required is:
∆ =E(dn−1)E(dn)+E(pn0+1)E(pn0) (1.3) If∆<U, then the insulator is a charge-transfer insulator since the energy gap for charge excitations is now determined by the charge-transfer energy∆and not by the on-site interactionU. Such a model has been successful in explaining insulating states of certain chalcogenides and halides [47,48].
Figure 1.4. Insulating gap is characterized by the charge-transfer gap,∆.
1.3. Lifshitz transition
Lifshitz transitions are electron transitions [49] i.e. wherein the electron-state density near the boundary surface and the electron dynamics possess some peculiar features that lead to anomalies in the physical properties of the metal at T (Temperature)=
1.3. Lifshitz transition
0 in metals, leading to an abrupt change of topology of the Fermi surface of the metal [49,50]. The constant energy surface in momentum space,ε(p) is given by:
ε(p)= p2x+p2y−pz2
2m −µ (1.4)
whereµis the chemical potential. Thus, one can see (Fig. 1.5) that the the disruption of the Fermi surface occurs atµ=0. Such a discontinuity at Lifshitz transitions gives rise to anomalies in the electron characteristics of metals leading to e.g. topological semimetals, topological insulators and topological superconductors [50].
Figure 1.5. Reproduced from Ref. [50]. Example of a topological transition with the change of a Fermi surface topology.
Lifshitz transitions associated with transition metal oxide systems, which are our par- ticular interest, have been discussed for various systems such as Sr2−xLaxRhO4 [51], Cd2Os2O7 [52], and NaOsO3[21].
Thus, one can define a Lifshitz transition as follows:
"The Lifshitz transition is a continuous change in topology of the Fermi surface that does not require any symmetry breaking. It is strictly defined at T=0 for a non-interacting fermion system."
2. Metal - Insulator Transitions in 5d systems
Why are5d transition metal oxide systems interesting? What types of MITs are present?
What are the interactions and energies involved?
Compounds containing 5d transition metal ions such as Ir or Os, lie at the crux where several interaction energy contributions (such as such spin-orbit coupling, Hund’s coupling, Coulomb repulsion, and magnetic anisotropy) are at comparable scales. Thus, understanding their interplay and how this affects the magnetic, electronic, and structural degrees of freedom is crucial in order to explain the manifestation of a variety of interesting ground states and phase transitions that occur in these systems.
Iridates and osmates can be found as either perovskite structures (e.g. SrIrO3, NaOsO3, or the layered Sr2IrO4, etc.) or as pyrochlore lattice structures (e.g. Y2Ir2O7, Nd2Ir2O7, Cd2Ir2O7 etc.). Early experiments on the layered Iridates Sr2IrO4 [9]
suggested that the subtle interplay between strong spin-orbit coupling and the Coulomb interaction gives rise to an unexpected relativistic Mott insulating ground state. In the layered Iridates, (Ir4+with a 5d5 electronic configuration), the strong spin-orbit coupling results in the violation of Hund’s rules, splitting the bands withegcharacter, whereas thet2gbands form two sub-bands characterized by the effective total angular momentum Je f f. The Je f f = 3/2 band is lower in energy and fully filled, while the Je f f = 1/2 band is occupied by only one electron and experiments have demonstrated that it has a small bandwidth [9]. Therefore, contrary to the expectations, based on the spatially extended 5dorbital bandwidth, even a small Coulomb repulsion among the 5d-electron states is enough to open a gap [9,8]. Such an example of novel physics triggered a flurry of theoretical and experimental work, which has resulted in numerous predictions of a large array of novel effects in 5delectron systems characterized by strong spin-orbit coupling.
For example, Wang and Senthil have proposed that doping in these systems could potentially lead to high-temperature superconductivity [53]. It has been argued that pyrochlore Iridates (such as Y2Ir2O7) could provide a condensed-matter realization of correlated topological insulators with large gaps, Kitaev spin liquids [54,55] and
2.1. Metal- InsulatorTransition inNaOsO3
Weyl semimetals [56,57,58]. In these latter systems, in the vicinity of Fermi energy, the excitations are described in terms of a relativistic wave equation describing massless spin -1/2 particles, the "Weyl fermions", e.g. a three-dimensional analog of graphene with linearly dispersing excitations. In recent years, research has revealed that osmates can host new unexpected phenomena such as ferroelectric metallicity [59], the first prototype of a Slater Insulator with a concomitant metal-insulator transition and antiferromagnetic ordering [11,12,22], and have the ability to host Lifshitz metal-insulator transitions [21,52].
2.1. Metal- Insulator Transition in NaOsO
3Why NaOsO3? What type of MIT is it? What are the interactions and energies involved?
How does this system compare to other5d and3d Transition-Metal Oxides (TMOs)? Are there other similar systems?
The 5dsystem, NaOsO3 lies in the category of materials with a half-filled state (Os5+in NaOsO3corresponds to a 5d3half-filledt2gstate) and was first synthesized by Shi et al. [11] in the wake of growing interest in 5delectron physics. Through
Figure 2.1. Reproduced from Ref. [12]. Slater MIT (left) where commensurate AFM order doubles the unit cell. (Right) Simplified band structure. The opposite potential on each neighboring ion in the magnetic regime splits the electronic band, creating an insulating band gap.
their experimental observations (e.g. resistivity and magnetization measurements), which shall be extensively discussed in the next Section2.1.1, NaOsO3was proposed to be the first example of a three dimensional Slater insulator, in which it is the onset of antiferromagnetic order in a half-filled state, that opens an insulating gap and

![Figure 1.3. Reproduced from Ref. [35]. Schematic of a Mott-Hubbard transition for a system at half-filling](https://thumb-eu.123doks.com/thumbv2/1library_info/5342413.1681941/36.892.110.747.275.452/figure-reproduced-ref-schematic-mott-hubbard-transition-filling.webp)
![Figure 2.7. Reproduced from Ref. [12]. Refined structural parameters from neutron powder diffraction](https://thumb-eu.123doks.com/thumbv2/1library_info/5342413.1681941/46.892.209.651.498.907/figure-reproduced-refined-structural-parameters-neutron-powder-diffraction.webp)
![Figure 2.10. Reproduced from Ref. [14]. (a) and (b) Measured (squares) and calculated (line) dispersion revealing the large spin-gap](https://thumb-eu.123doks.com/thumbv2/1library_info/5342413.1681941/49.892.280.652.577.884/figure-reproduced-measured-squares-calculated-dispersion-revealing-large.webp)
![Figure 2.12. Reproduced from Ref. [16]. Paramagnetic spin fluctuations in NaOsO 3 at 450 K](https://thumb-eu.123doks.com/thumbv2/1library_info/5342413.1681941/51.892.286.657.265.635/figure-reproduced-ref-paramagnetic-spin-fluctuations-naoso-k.webp)
![Figure 2.13. Reproduced from Ref. [21]. Change of slope in resistivity at T A is attributed to the onset of a pseudogap.](https://thumb-eu.123doks.com/thumbv2/1library_info/5342413.1681941/52.892.211.648.355.718/figure-reproduced-change-slope-resistivity-attributed-onset-pseudogap.webp)
![Figure 3.7. Reproduced from Ref. [69]. The brilliance of light sources over the years.](https://thumb-eu.123doks.com/thumbv2/1library_info/5342413.1681941/60.892.265.583.175.610/figure-reproduced-ref-brilliance-light-sources-years.webp)
![Figure 3.9. Photograph of the 6-kappa diffractometer at I16 beamline. The 6-circle angles are in accordance to those mentioned in Ref.[70]](https://thumb-eu.123doks.com/thumbv2/1library_info/5342413.1681941/62.892.171.689.99.607/figure-photograph-diffractometer-beamline-circle-angles-accordance-mentioned.webp)
