SFB 649 Discussion Paper 2012-062
Brand equity – how is it affected by critical
incidents and what moderates the effect
Lutz Hildebrandt * Sven Tischer *
* Humboldt-Universität zu Berlin, Germany
This research was supported by the Deutsche
Forschungsgemeinschaft through the SFB 649 "Economic Risk".
http://sfb649.wiwi.hu-berlin.de ISSN 1860-5664
SFB 649, Humboldt-Universität zu Berlin Spandauer Straße 1, D-10178 Berlin
S FB
6 4 9
E C O N O M I C
R I S K
B E R L I N
Brand equity – how is it affected by critical incidents and what moderates the effect 1
Sven Tischer and Lutz Hildebrandt2 Abstract
To explore how occurring critical incidents affect customer-brand relations, this study measures the impact on the basis of an online experiment. For this purpose, 1,122 usable responses are gathered considering the smartphone brands of Apple and Nokia as well as different scenarios. The respective reactions to these negative incidents are evaluated using the concept of customer-based brand equity. More precisely, a structure equation model is specified and differences in latent factor means are estimated taking into account perceived quality, various brand associations, loyalty and overall brand equity. The findings indicate that brand equity dimensions are not equally affected. Moreover, the results demonstrate that both brand equity and the business relationship before crisis moderate the effect of distinct critical incidents.
Key words
Brand equity, critical incidents, negative publicity, structure equation modeling, online experiment
JEL Classification:
M14, M31, C12, C14, C38, C93
1 This research was supported by the Deutsche Forschungsgemeinschaft through the SFB 649 "Economic Risk".
SFB 649, Humboldt-Universität zu Berlin, Spandauer Straße 1, D-10178 Berlin
2 Humboldt-Universität zu Berlin, School of Business and Economics, Institute of Marketing, Spandauer Straße 1, D-10178 Berlin,{ tischesv, hildebr}@wiwi.hu-berlin.de
1 Introduction
In comparison to the past, relations between customers and brands are less exclusive today (Rust, Lemon & Zeithaml, 2004). Therefore, in order to retain competitive advantages, it is becoming much more important to improve or, at least, to maintain established customer-brand relations. As a result, marketing research has been intensifying to figure out which incidents destabilize these relationships (e.g. Keaveaney, 1995) in which ways (e.g. Aaker, Fournier & Brasel, 2004; Klein &
Dawar, 2004).
Roos (2002) defines such critical incidents (CI) as extraordinary events which are perceived or recalled negatively by customers before purchase, during purchase or during consumption. The possible impact of these negative perceptions, especially on loyalty, have led to many qualitative studies to be analyzed (e.g. Bitner, Booms &
Tetreault, 1990; Gardial, Fisher, Flint & Woodruff, 1996; Roos, Edvardsson, &
Gustafsson, 2004). In contrast, just a few studies quantify effects of critical incidents, but most of them focus on service failures (e.g. Maxham & Netemeyer, 2002;
Gustafsson, Johnson & Roos, 2005; van Doorn & Verhoef, 2008). The remaining quantitative studies analyze either product harm crises (Ahluwalia, Burnkrant &
Unnava, 2000; Dawar & Pillutla, 2000; Klein & Dawar, 2004; Cleeren, Dekimpe &
Helsen, 2008; Dawar & Lei, 2009) or unethical marketing behavior (Ingram, Skinner
& Taylor, 2005).
All of these studies aim to shed some light on negative information processing in the case of occurring critical incidents in order to be able to develop impact- minimizing marketing strategies. Consequently, the following questions arise: When will the customer-brand relation be damaged and, if so, to which extent? Which brand dimensions are affected by critical incidents and should be addressed afterwards?
Does the kind of critical incident matter? Are there moderators which influence the information processing?
Addressing these questions, this study follows Dawar and Pillutla (2000) and uses the concept of customer-based brand equity (CBBE) to quantify relational changes.
For this purpose, an experimental design was developed reducing some criticized weaknesses of such experiments. By focusing on product brands, this study gains insights into immediate reactions to different critical incidents considering various brand strengths (Ahluwalia et al., 2000; Dawar & Pillutla, 2000; Cleeren et al., 2008) and previous relations (Ahluwalia, 2002; Dawar & Lei, 2009; van Doorn & Verhoef, 2008). As a result, this study is the first which explores an integrated relationship- branding perspective and compares the effect of distinct critical incidents regarding various brand equity dimensions.
The article first reviews literature to develop the conceptual framework and hypotheses. The following sections present the research methodology, the sample and the results. In the end, discussion and limitations of this research are presented.
2 Conceptual framework
2.1 Brand equity and its dimensions
Given the increased importance of brand equity since its conception by Aaker (1991), various brand measures have been developed. Ailawadi, Lehmann and Neslin (2003) classify these measures as product-market outcomes, financial market outcomes or customer mind-set measures. In order to quantify changes in customer- brand relations, this study employs customer mind-set measures adapting the multidimensional concept of CBBE defined by Keller (1993) as “differential effect that brand knowledge has on consumer response to the marketing of that brand”.
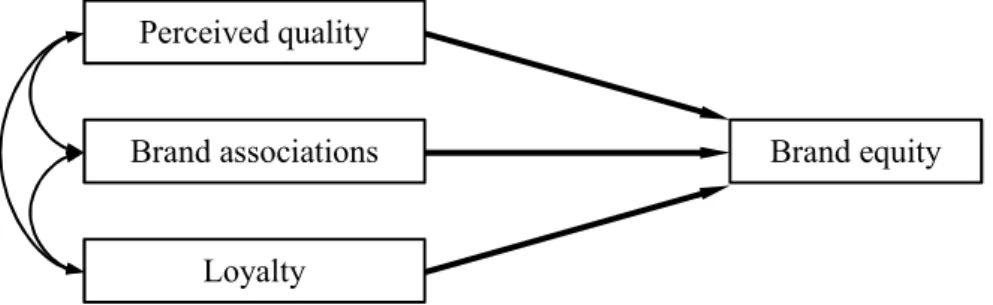
Based on the 4 CBBE-dimensions proposed by Aaker (1996), only perceived quality, brand associations and loyalty are taken into account to analyze relational changes (see Figure 1). This study excludes the fourth dimension (awareness) because a person unaware of a brand does not possess a customer-brand relation.
Hence, there is nothing to be damaged.
Figure 1: Conceptual model of brand equity including relevant dimensions
Perceived quality is, in contrast to objective quality, a consumer’s subjective judgement about “a product’s overall excellence or superiority” (Zeithaml, 1988). This means, whereas objective quality refers to “measureable and verifyable superiority on some predetermined ideal standard” (Zeithaml, 1988), perceived quality depends more on personal product experience, personal needs and the individual consumption situation (Yoo, Donthu & Lee, 2000). Furthermore, perceived quality represents a highly abstract global assessment rather than the sum of individual quality elements (Yoo & Donthu, 2001). Consequently, following Zeithaml (1988), high perceived quality beguiles consumers into buying this brand rather than competing ones.
Brand associations are defined as “anything linked to the memory of a brand”
(Aaker, 1991). These associations may be caused by various sources and differ in strength and uniqueness (Keller, 1993). Despite the wide range of sources, Aaker (1996) identifies the main categories of product, personality and organization related brand associations. Growing experience and/or exposure will strengthen these
Perceived quality
Loyalty
Brand associations Brand equity
associations (Aaker, 1991). Finally, positive associations signal high quality and commitment leading to more favorable buying decisions for the brand (Yoo et al., 2000).
Loyalty is defined by Aaker (1991) as “the attachment that a customer has to a brand.” This brand attachment can be conceptualized from a behavioral or an attitudinal perspective. Whereas behavioral loyalty focuses on repurchase behavior, attitudinal loyalty reflects the intention or “tendency to be loyal to a focal brand” (Yoo
& Donthu, 2001). In the end, consumers with a high level of loyalty increase brand equity by purchasing a brand routinely and resisting other brand offers (Yoo et al., 2000).
2.2 Critical incidents (CI)
Bitner et al. (1990) describe an incident which contributes significantly either positively or negatively to an activity or phenomenon as critical. Focusing on negative incidents as defined by Roos (2002; see introduction), a negatively changed buying behavior can be triggered by these incidents (e.g. Gustafsson et al., 2005; Bitner et al., 1990). This would mean that companies lose operating efficiencies and future revenue streams as a result of customers who reduce their spending and purchase frequency, purchase at discount instead of full prices or switch to another supplier.
Different causes may trigger these consequences. According to Keaveney (1995), CI result from either pricing problems, lack of convenience, core service (product) failures, service encounter failures, inadequate response to failures, attraction by competitors or ethical problems. Concentrating on service failures, Keaveney (1995) distinguishes only two ethical problems occuring while interacting with the customer:
dishonest or intimidating behavior and conflicts of interest related to commission- based recommendations.
However, public awareness has changed with regard to what is deemed to be an ethical problem. Furthermore, due to better educated, increasingly skeptical and demanding consumers (Mangold & Faulds, 2009) and their ability to publish negative incidents easily via the internet, customers do not experience most CI personally nowadays. Instead, people perceive especially ethical problems in the media as negative publicity. As a consequence, Shleifer (2004) takes a more general perspective on ethical problems and differentiates, additionally to Keaveney (1995), between employment of children, excessive executive payments, corporate earnings manipulation, involvement of universities in commercial activities and corruption.
In order to compare the results of this study with existing analyses, attitudinal changes concerning a product failure are quantified. Also, due to the increased importance of ethical problems and to compare distinct CI, this study examines changes in the customer-brand relation becoming aware of corruption.
3 Development of hypotheses
3.1 Relations between brand equity and its dimensions (model hypotheses)
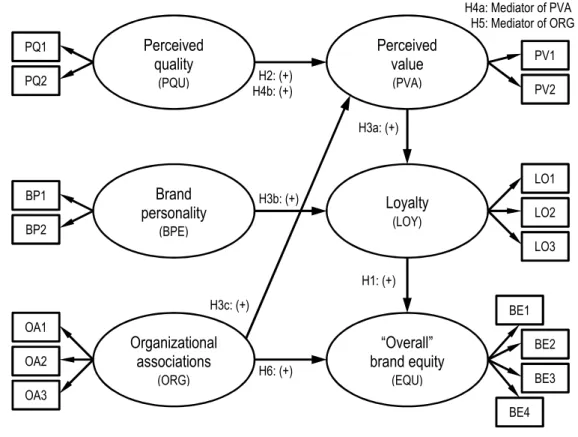
According to Aaker (1996), loyalty is a key indicator of brand equity and can be strengthened by perceived quality and brand associations. Myers (2003) refines this statement, arguing that brand loyalty is a dependent variable of perceived quality and the components of brand associations. Additionally, Buil, de Chernatony and Martinez (2008) claim perceived value, brand personality and organizational associations reflect the relevant brand associations and complete the structural model. Hence, the following hypotheses are proposed:
Hypothesis 1: Rising attitudinal loyalty (LOY) enhances brand equity (EQU).
Hypothesis 2: Higher perceived quality (PQU) increases loyalty (LOY).
Hypothesis 3a: The greater the perceived value (PVA), the greater the loyalty.
Hypothesis 3b: The greater the brand personality (BPE), the greater the loyalty (LOY).
Hypothesis 3c: The greater the organizational associations (ORG), the greater the loyalty (LOY).
Integrating the concept of perceived value takes into account that a high quality perception is necessary, but not sufficient, to become a loyal customer due to perceived price-performance ratio. Therefore, perceived value is assumed to mediate the effect towards loyalty. As a result of Germany-wide similar prices for the same brands, the following hypotheses are proposed:
Hypothesis 4a: Perceived value (PVA) mediates the influence of perceived quality (PQU) on loyalty (LOY).
Hypothesis 4b: The greater the perceived quality (PQU), the greater the perceived value (PVA).
Given that perceived value has to be positive to increase loyalty, organizational associations, such as credibility, esteem and trust, will affect loyalty only in addition to perceived value. Consequently, considering the interdependencies of these organizational associations and following Sirdesmukh, Singh and Sabol (2002), perceived value is assumed to be a mediator between organizational associations and loyalty. In addition, an effect of organizational associations might exist detached from product or service characteristics. Therefore, the following hypotheses are proposed:
Hypothesis 5: Perceived value (PVA) mediates the influence of organizational associations (ORG) on loyalty (LOY).
Hypothesis 6: The greater the organizational associations (ORG), the greater the overall brand equity (EQU).
Derived from these insights and the corresponding hypotheses, the structural model is specified taking into account the mediation of perceived value (see Figure 2).
Figure 2: Structural model and model hypotheses
3.2 Effects of critical incidents (processing or reaction hypotheses)
Keller (1993) postulates that negative associations are formed on the basis of new negative information (knowledge). Consequently, a reduction of positive attitudes towards the brand is expected when a critical incident occurs. Several studies confirm this negative impact (e.g. Ahluwalia et al., 2000; van Heerde, Helsen &
Dekimpe, 2007). Therefore, the following hypothesis is proposed:
Hypothesis 7: A negative critical incident (CI) reduces positive attitudes.
Brand personality
(BPE)
“Overall”
brand equity
(EQU)
Perceived quality
(PQU)
Loyalty
(LOY)
Organizational associations
(ORG)
Perceived value
(PVA) PQ1
PQ2
BP1 BP2
OA1 OA2 OA3
PV1 PV2
LO1 LO2
BE1 BE2 BE3 LO3
BE4 H1: (+)
H3a: (+)
H3b: (+)
H4a: Mediator of PVA H5: Mediator of ORG
H2: (+) H4b: (+)
H3c: (+)
H6: (+)
However, closer examination reveals indications that perceptions, and hence the impact of critical incidents, vary depending on customer-brand relation, crisis and the medium which transmits the message.
With regard to customer-brand relation, various studies show a moderating effect of pre-crisis levels using the concepts familiarity (Ahluwalia, 2002; Cleeren et al., 2008; Dawar & Lei, 2009), commitment (Ahluwalia et al., 2000; Ingram et al., 2005) and brand equity (Dawar & Pillutla, 2000; Cleeren et al., 2008). Specifically, this means critical incidents have less influence on familiar customers, customers who are highly committed to a brand as well as customers with substantial CBBE. These buffering effects can be caused, on the one hand, by more likely biased processing of loyal customers (Ahluwalia et al., 2000) and their tendencies to resist or discount disconfirmatory information (Dawar & Pillutla, 2000). On the other hand, potential customers miss the opportunity to increase their personal experience, which is instrumental in maintaining brand equity during a crisis (Aaker & Biel, 1993).
Consequently, they are more affected (van Heerde et al., 2007). Therefore, the following hypotheses are derived considering the importance of loyalty to brand equity (Aaker, 1996):
Hypothesis 8: Higher brand equity leads to smaller effects of the critical incident.
Hypothesis 9: The smaller the effect of the critical incident, the greater the loyalty.
Furthermore, supposing that loyal customers possess generally more brand knowledge as well as stronger associations (Romaniuk, 2008) and are hence more familiar and committed compared to potential customers, the following hypotheses result:
Hypothesis 10: Associations are stronger for customers compared to non-customers.
Hypothesis 11: Current customers reduce their attitudes less compared to non- customers.
According to Dawar and Lei (2009), the influence of the nature of crisis depends on whether key benefit associations are affected. This implies different critical incidents influence different brand dimensions. One reason is that risk perceptions differ depending on the nature of crisis (Weißgerber, 2007). Therefore, in the case of a product failure, perceived quality (PQU) is presumed to be directly affected in consequence of perceived functional and/or physical risks. In contrast, in the case of corruption, a significant direct effect is expected on associations towards the company (ORG), such as trust, credibility and esteem due to psychological and/or social risks (personal identification). With regard to both critical incidents, perceived value is assumed to decrease as a result of its mediating role and the expected direct effects. Consequently, the following hypotheses are proposed:
Hypothesis 12a: In the event of corruption, organizational associations (ORG) are significantly affected.
Hypothesis 12b: Perceived quality (PQU) is significantly affected in the event of a product failure.
Hypothesis 12c: In both cases, perceived value (PVA) is significantly affected.
In addition to the nature of crisis, Laufer, Gillespie, McBride and Gonzalez (2005) show that perceived severity mediates the impact of critical incidents. Dawar and Lei (2009) confirm this mediation on negative perceptions measuring seriousness.
Assuming that the perception of seriousness depends on the potential amount of damage, geographic and chronological proximity as well as whether or not the persons are directly affected, the following hypotheses are proposed:
Hypothesis 13: When the persons are not directly affected, the critical incident impacts loyalty (LOY) less than other constructs.
Hypothesis 14: CI which are perceived as less critical affect brand dimensions less.
Finally, considering that people strive to avoid cognitive dissonance, mediums transmitting bad news are key planks. This means the more credible the medium is perceived to be, the more likely and extensive the processing of information.
Consequently, the final hypothesis is offered:
Hypothesis 15: Less credible perceived news items affect brand dimensions less.
4 Methodology 4.1 Study design
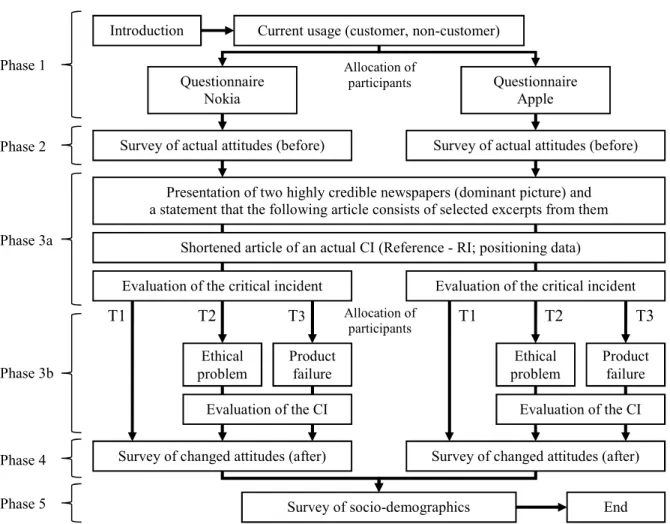
In order to test these specified hypotheses, attitudinal data are gathered via the internet using an experimental pretest-posttest-control design. The experimental design considers additionally three independent variables – level of brand equity (low vs. high, respectively Nokia vs. Apple), current relationship (customer vs. non- customer) and the nature of the critical incident (product failure vs. ethical problem).
Consequently, the design consists of 8 treatment and 4 control groups (2x2x3). All test subjects are assigned randomly to a treatment or control group except current customers of the brands under investigation. Nokia and Apple customers are allocated randomly to a treatment or control group in their respective survey to reach or rather to exceed a minimum threshold of responses in every group. This means, all responses regarding Nokia do not contain the responses of customers who currently use an Apple mobile phone and vice versa (see Figure 3).
The treatments are fictitious articles claiming a product failure or corruption happened recently in and limited to East Asia. Consequently, the incidents do not
concern participants personally. Focusing on attitudinal changes triggered by the incident, these articles exclude any kind of company response. In order to maximize credibility, the articles are created on the basis of past CI in the mobile phone industry (malfunction of batteries and corruption). Also, all participants are exposed first to a well-known critical incident in the industry. For this purpose, this study takes advantage of the data protection discussion regarding smartphones which collect and save positioning data without the knowledge of its user. To offer or rather recall this information concerning both brands, two existing articles of highly credible German- language newspapers are combined. In addition, respondents are informed about the source and are exposed to a picture of cited newspapers speculating that memories of this picture increase the credibility of the fictional treatments.
Figure 3: Experimental design
Phase 1
Phase 2
Phase 3a
Phase 3b
Phase 4 Phase 5
Current usage (customer, non-customer) Introduction
Survey of actual attitudes (before)
Survey of changed attitudes (after)
Survey of socio-demographics Ethical
problem Product failure Evaluation of the critical incident
End Questionnaire
Nokia Questionnaire
Apple Allocation of
participants
Allocation of participants
Shortened article of an actual CI (Reference - RI; positioning data)
Evaluation of the critical incident
Evaluation of the CI
Presentation of two highly credible newspapers (dominant picture) and a statement that the following article consists of selected excerpts from them
Survey of actual attitudes (before)
T1 T2 T3
Ethical
problem Product failure Evaluation of the CI
T1 T2 T3
Survey of changed attitudes (after)
Examining the success of manipulation and the influence of these mediators, subsequent to every article presentation respondents evaluate their knowledge, perceived credibility and criticality of the critical incident. The article presentation (one per control group and two per treatment group) follows a second measurement of all brand equity dimensions. Consequently, pretest results reflect actual attitudes to a specific smartphone brand based on past perceptions and/or direct experiences, whereas, the second measurement covers the reaction to critical incidents. Finally, socio-demographics are collected.
4.2 Measures
According to Christodoulides and de Chernatony’s (2010) distinction between indirect and direct approaches to measure CBBE, this study applies both to measure attitudinal changes with regard to occurring critical incidents. Both indirect approaches and direct approaches are measured using a seven-point Likert scale (strongly disagree to strongly agree). Additionally, avoiding a forced choice, each item offers an alternative no-answer-option. All multi-item measurement scales are adopted from existing measures. In order to ensure that German translations are appropriate, first, a group composed of 20 students translated the original measures.
Second, another group translated the most frequent translations of each item back into English. Finally, the translation which corresponds more closely to the original measures is chosen for each item.
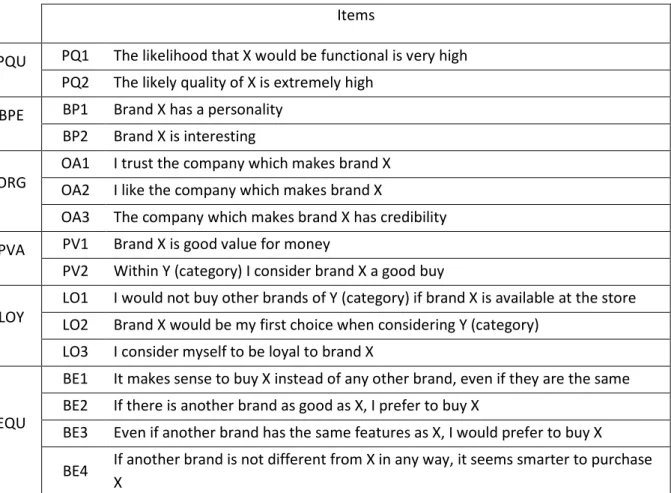
The used perceived quality scale (PQU) is adopted from Yoo and Donthu (2001) and consists of two items. The scale reflects the dimensions of perceived functionality, which is usually a key benefit of technical devices, and perceived quality of the corresponding smartphone brand.
With regard to brand personality scale (BPE), this study follows Buil et al. (2008) and applies the scale proposed by Aaker (1996). However, the final scale contains only two of initially three items. The third item, which refers to a clear image of a typical brand user, is eliminated due to a different semantic content and hence factor loadings below 0.15 across all groups in the pre-test (Fornell & Larcker, 1981).
In order to measure the organizational associations (ORG), this study uses, in compliance with Buil et al. (2008), the three-item scale of Aaker (1996) including statements about trust, credibility and esteem.
Table 1: Measures of the constructs used to evaluate attitudinal changes Items
PQU PQ1 The likelihood that X would be functional is very high PQ2 The likely quality of X is extremely high
BPE BP1 Brand X has a personality BP2 Brand X is interesting ORG
OA1 I trust the company which makes brand X OA2 I like the company which makes brand X
OA3 The company which makes brand X has credibility PVA PV1 Brand X is good value for money
PV2 Within Y (category) I consider brand X a good buy LOY
LO1 I would not buy other brands of Y (category) if brand X is available at the store LO2 Brand X would be my first choice when considering Y (category)
LO3 I consider myself to be loyal to brand X
EQU
BE1 It makes sense to buy X instead of any other brand, even if they are the same BE2 If there is another brand as good as X, I prefer to buy X
BE3 Even if another brand has the same features as X, I would prefer to buy X BE4 If another brand is not different from X in any way, it seems smarter to purchase
X
Concerning the applied perceived value scale (PVA), the effect analysis considers two out of three items developed by Lassar, Mittal and Sharma (1995). The third item is excluded in the course of reliability and validity analyses due to strong correlations with loyalty items. The remaining two-item scale reflects perceived value for money.
Both the applied loyalty scale and the used direct measurement of CBBE, the overall brand equity scale, are adopted from Yoo et al. (2000). The three-item loyalty scale includes statements about attitudinal loyalty. In contrast, the overall brand equity scale consists of 4 items regarding brand preferences. Table 1 gives an overview of all applied measures which are restricted to load only onto one prespecified construct.
4.3 Model evaluation and hypotheses tests
Before evaluating the conceptual model, first, this study examines the assumption of differences both in actual attitudes towards distinct brands and between loyal and potential customers. Second, an analysis verifies the hypotheses that Nokia and Apple have respectively low or high brand equity. For these purposes, descriptive statistics are compared and an ANOVA examines for each item whether associations depend on group membership. Additionally, ANOVA includes multiple comparisons with Bonferroni correction to test for significance of differences between individual groups to assess hypothesis 10.
Following Hu and Bentler (1998), this study applies structure equation modeling (SEM) to evaluate the fit of the proposed model. More precisely, this study uses LISREL with mean structures in order to consider item means and invariance across samples or time according to Baumgartner and Steenkamp (2006). In other words, this means configural, metric, strong factorial and strict factorial invariance are sequently analyzed using multi-sample-analyses based on covariances and means.
The estimated parameters (Maximum Likelihood Estimation) show the effect of variables in an absolute sense and are used to compare similar models in other populations (Bagozzi, 1977). If the proposed model is adequate, the respective exogenous and endogenous measurement models are evaluated seperately. Due to
Sörbom’s (1974) extension of the classical model of factorial invariance, these separate models are necessary to identify differences in both exogenous and endogenous latent variables. Consequently, the fit and invariance of these measurement models are also examined across groups.
The evaluation starts examining reliability and validity of the measurement model.
During the further course, the significance, sign and level of each estimated path coefficient are considered and interpreted with regards to hypotheses 1 to 6.
Model evaluation follows an analysis of potential mediators such as knowledge, credibility and criticality. Between-subject-effects are examined using ANOVA and multiple comparisons with Bonferroni correction. Within-subject-effects of paired samples are analyzed to identify differences in perceptions of distinct incidents (reference incident (RI) to corruption (T2) or product failure (T3)).
Immediate attitudinal changes triggered by various CI and invariance over time (pre-posttest) are examined using LISREL with mean structures. To evaluate the reactions, differences in latent factor means (κ) are simultaneously estimated within groups (pre-posttest). To obtain these group-specific differences, exogenous and endogenous factor models are estimated seperately. Furthermore, the latent variable mean (κ) of the pretest, including all respondents within one group, is used as reference point and consequently set (fixed) to be zero. In contrast, κ is set to be free regarding all treatment groups. Additionally, the factor loadings (λ), intercept terms (τ) and measurement errors (δ) are declared to be invariant between pre- and posttest measurement. As a result, latent variables are uniformly scaled within one simultaneously estimated group regardless of treatments. Consequently, absolute differences in latent factor means caused by various CI are directly comparable.
5 Sample
5.1 Data collection and profile of respondents
The data are collected online using a snowball-sampling. For this purpose, an internet link was spread via student mailing lists asking them to forward it via Facebook to friends. A total of 1,122 usable completed responses were gathered.
657 out of these 1,122 respondents (58.6%) used a smartphone at the date of the survey. Remaining treatments unconsidered, in comparison to 252 responses of current customers and 256 of non-customers regarding the Nokia survey, 227 current customer and 387 non-customer responses are collected regarding the Apple survey.
The demographic results are similar in all four groups with regard to gender ( (3)
= 4.38; .224) and age ( (18) = 28.36; .057) using Pearson chi-square tests and comparisons of column proportions with adjusted p-values (Bonferroni method, p <
.05). In general, the sample is balanced with a proportion of 49.4% female to 50.6%
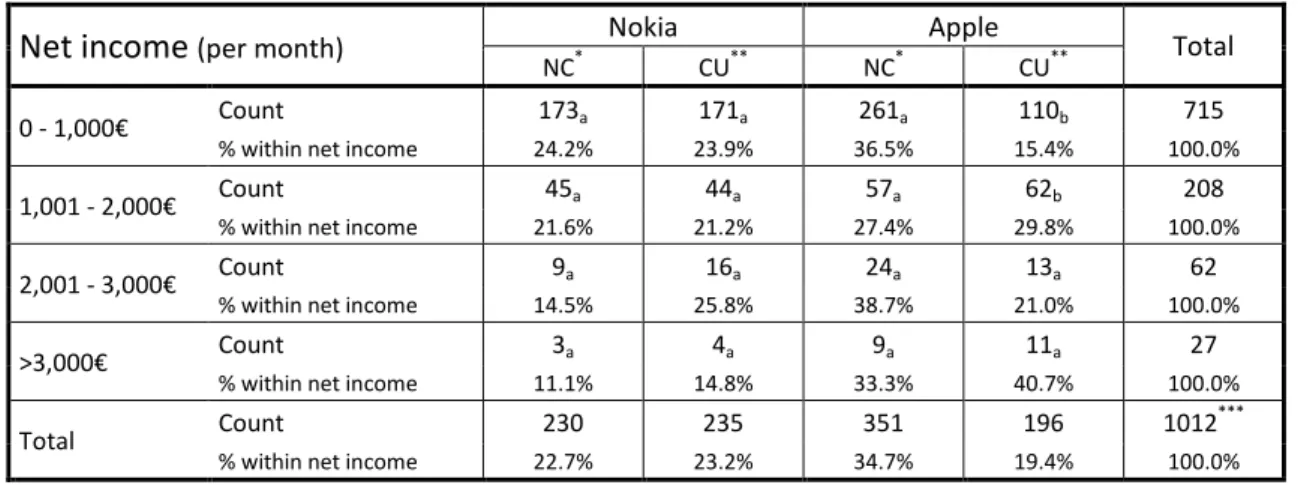
male respondents. However, the age cohort of 21- to 30-year old respondents is over-represented with 78.5 percent. Due to the addressing of students first, the sample includes an above-average share of 74.2% being students. Therefore, the lowest income group is over-represented with 63.7% including people who have no more than 1,000€ net income per month. Regarding monthly net income, chi-square test results reveal differences across groups ( (9) = 33.94; .000), but comparisons of column proportions show that only the Apple-customer group differs significantly from the remaining three comparable groups (see Table 2).
This means while the proportion of low paid persons earning monthly a maximum of 1,000€ is significant smaller in the Apple customers group, persons with a net income between 1,001€ and 2,000€ are over-represented in comparison to other groups. These higher incomes reflect the significant higher proportion of employed
persons in the Apple-customer group. Consequently, compared to the groups of potential customers of Apple or Nokia and loyal customers of Nokia, students are under-represented in the Apple customer group. As a result, the chi-square test leads to a rejection of hypothesized similar proportions regarding occupation in the groups ( (18) = 37.34; .005).
Table 2: Crosstab and comparisons of column proportions (net income and group)
Net income (per month) Nokia Apple
Total
NC* CU** NC* CU**
0 - 1,000€ Count 173a 171a 261a 110b 715
% within net income 24.2% 23.9% 36.5% 15.4% 100.0%
1,001 - 2,000€ Count 45a 44a 57a 62b 208
% within net income 21.6% 21.2% 27.4% 29.8% 100.0%
2,001 - 3,000€ Count 9a 16a 24a 13a 62
% within net income 14.5% 25.8% 38.7% 21.0% 100.0%
>3,000€ Count 3a 4a 9a 11a 27
% within net income 11.1% 14.8% 33.3% 40.7% 100.0%
Total Count 230 235 351 196 1012***
% within net income 22.7% 23.2% 34.7% 19.4% 100.0%
* Non-customer ** Customer *** Difference to 1,022 responses are missing values a,b Each subscript letter denotes a subset of group categories whose column proportions do not differ significantly from each other at the .05 level (adjusted p-values, Bonferroni method).
5.2 Missing values
The fact that a forced choice should be avoided results in some missing values.
The analysis of missing values regarding measurement models reveals that in only 880 out of 1,122 cases are the data complete. The remaining 242 cases have in total 1,072 missing values across all 32 variables (2 x 16 variables, PRE - POST). Overall, 2.98 percent of data are missing. However, Little´s (1988) test indicates on a five percent significance level that data are missing completely at random (MCAR) for both the overall sample ( (4643) = 4696.75; .287) and the subsamples of Nokia-NC ( (2318) = 2377.65; .190), Nokia-CU ( (2026) = 2109.17; .097), Apple-NC ( (580) = 554.77; .768) and Apple-CU ( (443) = 476.29; .133). In other words, lack of data depends neither on observed nor on missing values (Rubin, 1976). Based on these
results and to keep the sample size, missing values of the measurement model are imputed using expectation-maximization (EM) algorithm. The imputation procedure is executed seperately for the subsamples to avoid a loss of group specific characteristics.
6 Results
6.1 Brand associations (item level)
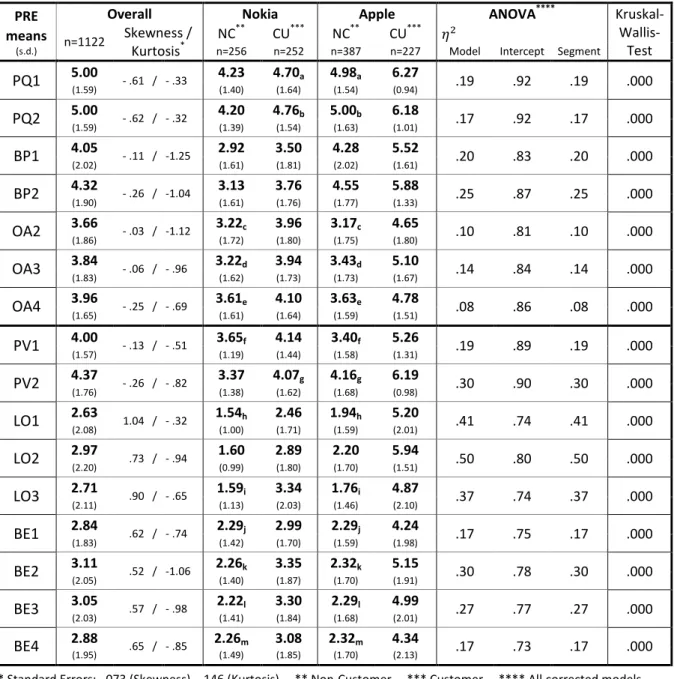
Table 3 shows descriptive statistics of the first measurement (actual attitudes) for both the whole sample and the subsamples. Furthermore, this table reports for each indicator the results of ANOVA with multiple comparisons. To assess the outcomes of ANOVA, the significance level is adjusted to p < 0.01 due to shown deviations from a normal distribution and part absence of homogeneity of variances. Although ANOVA is considered to be robust against such violations, in terms of multiple testing an additional non-parametric test is performed. This Kruskal-Wallis test and ANOVA indicate a significant main effect for group segmentation with regard to each item.
With regard to the assumed perceptional differences of both brands, the results are not consistent. Differences in all associations are significant comparing loyal customers of Nokia and Apple. But comparisons of potential customers suggest that associations differ significantly only regarding perceived quality (PQU), brand personality (BPE) as well as individual indicators of PV2 and LO2. However, focusing on more relevant associations of customers and the key benefit dimension of technical devices (functional quality), the conclusion can still be drawn that both brands differ considerably. Furthermore, Apple’s higher level of these associations is a first indication of high brand equity. The combination of this indication with the results of direct measures and key associations (loyalty) of brand equity implies that Nokia and Apple represent respectively a weak and a strong smartphone brand.
Hence, due to comparable perceptions, organizational associations are less relevant to create brand equity.
In principle, associations differ significantly between loyal and potential customers for both brands. Furthermore, as hypothesized, associations of loyal customers are more positive. Consequently, hypothesis 10 is supported.
Table 3: Descriptive statistics of actual attitudes (first measurement) and test of between-subject effects PRE
means
(s.d.)
Overall Nokia Apple ANOVA**** Kruskal-
Wallis- Test n=1122 Skewness /
Kurtosis*
NC** CU*** NC** CU***
n=256 n=252 n=387 n=227 Model Intercept Segment
PQ1 5.00 - .61 / - .33 4.23 4.70a 4.98a 6.27
.19 .92 .19 .000
(1.59) (1.40) (1.64) (1.54) (0.94)
PQ2 5.00 - .62 / - .32 4.20 4.76b 5.00b 6.18
.17 .92 .17 .000
(1.59) (1.39) (1.54) (1.63) (1.01)
BP1 4.05 - .11 / -1.25 2.92 3.50 4.28 5.52
.20 .83 .20 .000
(2.02) (1.61) (1.81) (2.02) (1.61)
BP2 4.32 - .26 / -1.04 3.13 3.76 4.55 5.88
.25 .87 .25 .000
(1.90) (1.61) (1.76) (1.77) (1.33)
OA2 3.66 - .03 / -1.12 3.22c 3.96 3.17c 4.65
.10 .81 .10 .000
(1.86) (1.72) (1.80) (1.75) (1.80)
OA3 3.84 - .06 / - .96 3.22d 3.94 3.43d 5.10
.14 .84 .14 .000
(1.83) (1.62) (1.73) (1.73) (1.67)
OA4 3.96 - .25 / - .69 3.61e 4.10 3.63e 4.78
.08 .86 .08 .000
(1.65) (1.61) (1.64) (1.59) (1.51)
PV1 4.00 - .13 / - .51 3.65f 4.14 3.40f 5.26
.19 .89 .19 .000
(1.57) (1.19) (1.44) (1.58) (1.31)
PV2 4.37 - .26 / - .82 3.37 4.07g 4.16g 6.19
.30 .90 .30 .000
(1.76) (1.38) (1.62) (1.68) (0.98)
LO1 2.63 1.04 / - .32 1.54h 2.46 1.94h 5.20
.41 .74 .41 .000
(2.08) (1.00) (1.71) (1.59) (2.01)
LO2 2.97 .73 / - .94 1.60 2.89 2.20 5.94
.50 .80 .50 .000
(2.20) (0.99) (1.80) (1.70) (1.51)
LO3 2.71 .90 / - .65 1.59i 3.34 1.76i 4.87
.37 .74 .37 .000
(2.11) (1.13) (2.03) (1.46) (2.10)
BE1 2.84 .62 / - .74 2.29j 2.99 2.29j 4.24
.17 .75 .17 .000
(1.83) (1.42) (1.70) (1.59) (1.98)
BE2 3.11 .52 / -1.06 2.26k 3.35 2.32k 5.15
.30 .78 .30 .000
(2.05) (1.40) (1.87) (1.70) (1.91)
BE3 3.05 .57 / - .98 2.22l 3.30 2.29l 4.99
.27 .77 .27 .000
(2.03) (1.41) (1.84) (1.68) (2.01)
BE4 2.88 .65 / - .85 2.26m 3.08 2.32m 4.34
.17 .73 .17 .000
(1.95) (1.49) (1.85) (1.70) (2.13)
* Standard Errors: .073 (Skewness), .146 (Kurtosis) ** Non-Customer *** Customer **** All corrected models, intercepts and fixed factors (group) are significant on p < .01; Levene-Tests are only not significant for all OA items (.05)
a,b Each subscript letter denotes a subset of groups whose (observed) mean differences are not significant on p < .01 using Multiple Comparisons (Post-Hoc-Test, Bonferroni)
6.2 Assessing reliability and validity
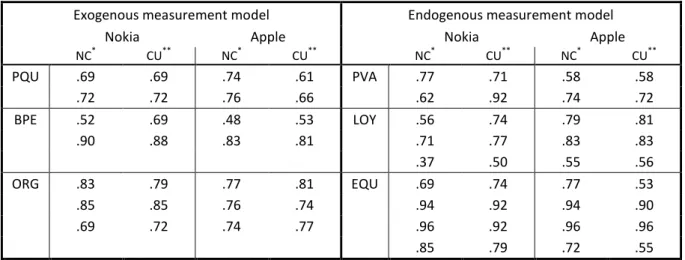
Table 4 and 5 report results of confirmatory factor analysis including indicator reliability, composite reliability, average variance extracted (AVE) and correlations between latent variables for each group. According to Bagozzi and Baumgartner (1994) calling for values exceeding .40, all indicators except one are reliable. The only exception concerns a loyalty item (LO3) in the potential customers group of Nokia (Nokia-NC) with an indicator reliability of .37. In order to apply one uniform measurement model across groups, a single item falling slightly below the threshold value is acceptable. Consequently, this item is not eliminated and indicator reliability is considered to be given.
Table 4: Indicator reliability (First measurement - PRE)
Exogenous measurement model Endogenous measurement model
Nokia Apple Nokia Apple
NC* CU** NC* CU** NC* CU** NC* CU**
PQU .69 .69 .74 .61 PVA .77 .71 .58 .58
.72 .72 .76 .66 .62 .92 .74 .72
BPE .52 .69 .48 .53 LOY .56 .74 .79 .81
.90 .88 .83 .81 .71 .77 .83 .83
.37 .50 .55 .56
ORG .83 .79 .77 .81 EQU .69 .74 .77 .53
.85 .85 .76 .74 .94 .92 .94 .90
.69 .72 .74 .77 .96 .92 .96 .96
.85 .79 .72 .55
* Non-customer ** Customer
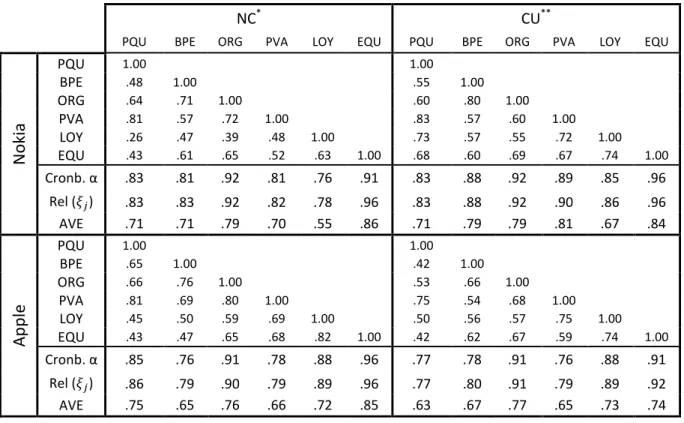
Evaluating internal consistency, this study uses Cronbach’s alpha, composite reliability as well as the AVE. Cronbach’s alpha exceeds the minimum level of acceptability of .70 (Nunnally, 1978) for all groups and constructs. Furthermore, composite reliability and AVE fully meet the limits of respectively > .60 (Bagozzi & Yi, 1988) and > .50 (Fornell & Larcker, 1981). Finally, following Anderson and Gerbing (1988), significance of all t-tests imply indicators which measure effectively the same constructs.
Assessing construct validity, first, following Fornell and Larcker (1981), the results of construct reliability imply convergence validity. Second, discriminant validity is given using the Fornell and Larcker (1981) test. AVE of all constructs exceeds the squared correlation between the considered and all other constructs. Third, according to Hildebrandt (1984), overall model fit is indicative of nomological validity (see next section). Fourth, after eliminating one brand personality and one perceived value indicator (see Measures), content validity is considered to be given due to positive judgments and reapplications of scales by experts (Cronbach & Meehl, 1955).
Table 5: Correlations of latent variables & reliability measures (First measurement - PRE)
NC* CU**
PQU BPE ORG PVA LOY EQU PQU BPE ORG PVA LOY EQU
Nokia
PQU 1.00 1.00
BPE .48 1.00 .55 1.00
ORG .64 .71 1.00 .60 .80 1.00
PVA .81 .57 .72 1.00 .83 .57 .60 1.00
LOY .26 .47 .39 .48 1.00 .73 .57 .55 .72 1.00
EQU .43 .61 .65 .52 .63 1.00 .68 .60 .69 .67 .74 1.00
Cronb. α .83 .81 .92 .81 .76 .91 .83 .88 .92 .89 .85 .96 Rel ( ) .83 .83 .92 .82 .78 .96 .83 .88 .92 .90 .86 .96
AVE .71 .71 .79 .70 .55 .86 .71 .79 .79 .81 .67 .84
Apple
PQU 1.00 1.00
BPE .65 1.00 .42 1.00
ORG .66 .76 1.00 .53 .66 1.00
PVA .81 .69 .80 1.00 .75 .54 .68 1.00
LOY .45 .50 .59 .69 1.00 .50 .56 .57 .75 1.00
EQU .43 .47 .65 .68 .82 1.00 .42 .62 .67 .59 .74 1.00
Cronb. α .85 .76 .91 .78 .88 .96 .77 .78 .91 .76 .88 .91 Rel ( ) .86 .79 .90 .79 .89 .96 .77 .80 .91 .79 .89 .92
AVE .75 .65 .76 .66 .72 .85 .63 .67 .77 .65 .73 .74
* Non-customer ** Customer
6.3 Structural model evaluation (fit indices)
Estimated path coefficients shown in Table 6 indicate a plausible and stable structural model across groups. This means, relations between all constructs are positive. However, path coefficients between ORG and PVA for Nokia-CU and
between BPE and LOY for Apple-NC are not significant. But the structural model is not changed in order to examine comparable models across groups. Consequently, hypotheses 1, 2, 3a, 4a and 4b as well as 6 are supported across groups. Hypothesis 3b is supported except for the group of Apple-NC. Hypothesis 3c and hence hypothesis 5 are also only supported for 3 out of 4 groups (all except Nokia-CU).
Table 6: Estimated standardized path coefficients of structural models (PRE) Coefficients
(t-value) Nokia-NC* Nokia-CU** Apple-NC* Apple-CU**
PQU - PVA .57 (7.20) .82 (9.72) .45 (7.37) .56 (6.22) BPE - LOY .40 (4.50) .28 (4.57) .06 (0.82) .25 (3.49) ORG - PVA .36 (5.02) .05 (0.75) .52 (8.55) .38 (4.99) ORG - EQU .47 (8.25) .40 (7.20) .27 (6.44) .39 (6.05) PVA - LOY .19 (2.25) .60 (9.07) .62 (7.74) .59 (7.31) LOY - EQU .45 (6.97) .53 (8.78) .67 (14.12) .51 (7.55)
* Non-customer ** Customer
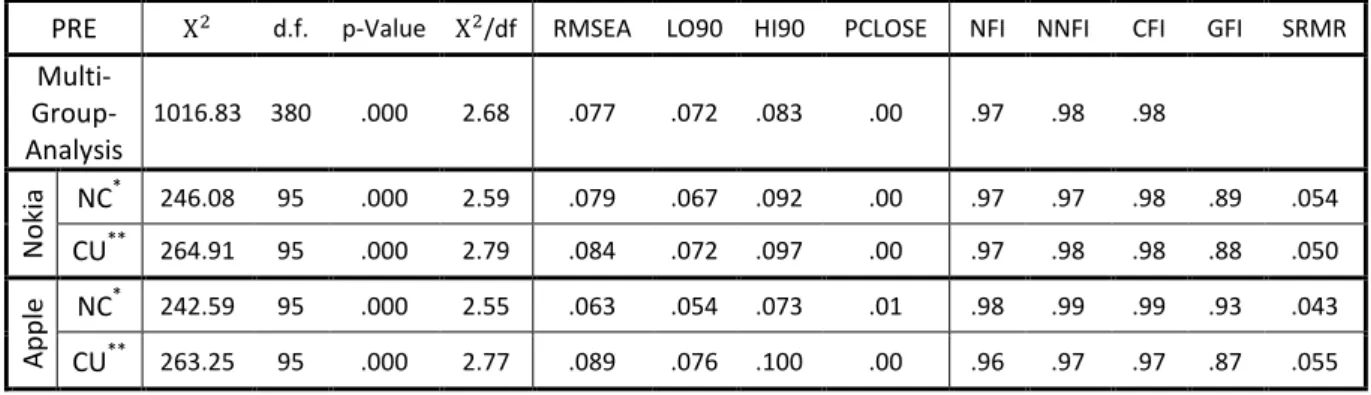
Table 7: Fit indices of the full model (overall model fit – PRE)
PRE Χ d.f. p-Value Χ /df RMSEA LO90 HI90 PCLOSE NFI NNFI CFI GFI SRMR Multi-
Group- Analysis
1016.83 380 .000 2.68 .077 .072 .083 .00 .97 .98 .98
Nokia NC* 246.08 95 .000 2.59 .079 .067 .092 .00 .97 .97 .98 .89 .054 CU** 264.91 95 .000 2.79 .084 .072 .097 .00 .97 .98 .98 .88 .050
Apple NC* 242.59 95 .000 2.55 .063 .054 .073 .01 .98 .99 .99 .93 .043 CU** 263.25 95 .000 2.77 .089 .076 .100 .00 .96 .97 .97 .87 .055
* Non-Customer ** Customer
Evaluating overall model fit, the fit indices shown in Table 7 suggest an acceptable fit for both multi-sample analysis and all analyses for separate groups applying the combination rules of Hu and Bentler (1999). This means, despite severe criticism against global cut-off values (see e.g. Barrett, 2007; Chen, Curran, Bollen, Kirby & Paxton, 2008) this study uses .95 for NNFI and .08 for SRMR (Hu & Bentler, 1999) as well as .95 for CFI (Carlson & Mulaik, 1993). Additional frequently-used fit indices are reported. Also NFI (> .90; Arbuckle, 2008), RMSEA (< .10; MacCallum,
Browne & Sugawara, 1996) and chi-square-value divided by degrees of freedom ( /d.f. < 3; Homburg & Giering, 1996) indicate an acceptable fit.
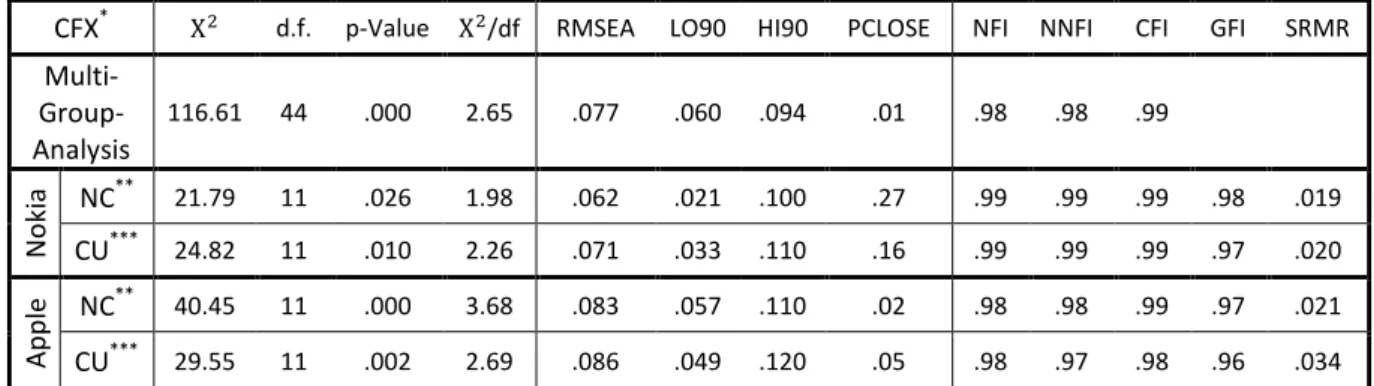
Tables 8 and 9 show the fit indices for the separate and multi-sample analyses of the respective exogenous and endogenous factor models. Based on the above used combination rules (Hu and &, 1999), fit criteria indicate an acceptable fit for the submodels.
Table 8: Fit indices of the exogenous measurement model (overall model fit – PRE)
CFX* Χ d.f. p-Value Χ /df RMSEA LO90 HI90 PCLOSE NFI NNFI CFI GFI SRMR Multi-
Group- Analysis
116.61 44 .000 2.65 .077 .060 .094 .01 .98 .98 .99
Nokia NC** 21.79 11 .026 1.98 .062 .021 .100 .27 .99 .99 .99 .98 .019 CU*** 24.82 11 .010 2.26 .071 .033 .110 .16 .99 .99 .99 .97 .020
Apple NC** 40.45 11 .000 3.68 .083 .057 .110 .02 .98 .98 .99 .97 .021 CU*** 29.55 11 .002 2.69 .086 .049 .120 .05 .98 .97 .98 .96 .034
* Containing perceived quality, brand personality and organizational associations ** Non-Customer *** Customer Table 9: Fit indices of the endogenous measurement model (overall model fit – PRE)
CFY* Χ d.f. p-Value Χ /df RMSEA LO90 HI90 PCLOSE NFI NNFI CFI GFI SRMR Multi-
Group- Analysis
313.13 96 .000 3.26 .090 .079 .100 .00 .98 .98 .99
Nokia NC** 83.46 24 .000 3.48 .099 .076 .120 .00 .97 .97 .98 .93 0.056 CU*** 73.32 24 .000 3.06 .090 .067 .110 .00 .98 .98 .99 .94 0.037
Apple NC** 71.21 24 .000 2.97 .071 .053 .091 .03 .99 .99 .99 .96 0.021 CU*** 85.14 24 .000 3.55 .106 .082 .130 .00 .97 .97 .98 .92 0.040
* Containing perceived value, loyalty and overall brand equity ** Non-Customer *** Customer
After supporting the equality of factor and model structure across groups with multi-sample analyses using same pattern and starting values, Tables 10, 11 and 12 contain results of the additionally required invariance tests. Following Little, Card, Slegers and Ledford (2007), the respective invariance across groups is rejected if the descriptive fit index of NNFI changes more than .01 compared to the prior and weaker invariance level. Based on this criteria, the results suggest an absence of
factorial invariance with regard to exogenous and endogenous measurement models.
This means, without factorial invariance, changes in latent variable means can only be estimated within groups. As a consequence, immediate reactions triggered by various critical incidents are not directly comparable in an absolute sense across groups.
Table 10: Invariance analyses across groups - overall model (PRE) Overall model
fit - PRE X2 d.f. p-Value X2/df RMSEA LO90 HI90 PCLOSE NFI NNFI CFI
Metric
invariance 1333.92 410 .000 3.25 .090 .084 .095 .00 .97 .97 .98
Strong factorial
invariance 1712.18 449 .000 3.81 .100 .095 .110 .00 .95 .96 .96
Table 11: Invariance analyses across groups - exogenous model (PRE)
Exogenous - PRE X2 d.f. p-Value X2/df RMSEA LO90 HI90 PCLOSE NFI NNFI CFI Metric
invariance 133.83 56 .000 2.39 .071 .055 .086 .02 .98 .98 .99
Strong factorial
invariance 265.48 68 .000 3.90 .102 .089 .120 .00 .96 .96 .97
Table 12: Invariance analyses across groups - endogenous model (PRE) endogenous -
PRE X2 d.f. p-Value X2/df RMSEA LO90 HI90 PCLOSE NFI NNFI CFI
Metric
invariance 590.17 114 .000 5.18 .122 .110 .130 .00 .96 .96 .97
6.4 Investigation of potential mediators
Differences between knowledge of the reference incident (RI) imply that this incident is widely known with regard to Apple and has been lost in media with regard to Nokia. In contrast to approximately 78% (86%) questioned about Apple, just about 19% (23%) of potential customers (loyal customers) questioned about Nokia know this critical incident. Hence, the Pearson chi-square test indicates that knowledge differs significantly between the groups ( (3) = 407.81; .000).
Reflected by a chi-square test ( (3) = 5010; .171), the hypothetical case of corruption (T2) is similarly unknown across groups (Nokia-NC - 97%, CU - 99%,