Lapin: Two-dimensional electrophoresis of urinary proteins 81 J. Clin. Chcm. Clin. Biochem.
Vol. 27, 1989, pp. 81-86
© 1989 Walter de Gruyter & Co.
Berlin · New York
A Practicable Two-Dimensional Electrophoretic Method for Routine Analysis of Urinary Proteins
By A. Lapin
Institut für Klinische Chemie und Laboratoriumsdiagnostik der Universität Wien (Received October 1/December 5, 1988)
Summary: A two dimensional electrophoretic method is described for the routine clinical analysis of urinary
proteins. Cellulose acetate electrophoresis is used for the first dimension, and SDS (sodium dodecyl sulphate) electrophoresis for the second dimension, the latter being performed together with gel staining (Coomassie Blue) on the „Phast System". The Separation media are supplied äs "ready-to-use" materials. The method is reliable and reproducible, and is complete within 100 minutes. The resulting two-dimensional pattern of major proteinuria contituents is evaluated visually from the distribution according to molecular weight (second dimension) and from the five zone pattern of cellulose acetate electrophoresis (first dimension). Certain
"marker" proteins specific for certain pathological changes, äs well äs certain characteristic changes in protein spot constellation, can be more easily recognized and evaluated than in one-dimensional SDS electrophoresis.
Introduction
Using two dimensional electrophoresis, a combination of paper and starch gel electrophoresis, Butler and coworkers demonstrated in 1961 a high variability of the composition of proteins in pathological urinary samples (1). Eleven years later, Pesce, Boreisha and
Pollak introduced a polyacrylamide SDS (sodium so-decyl sulphate) electrophoretic method for the Sepa- ration of urinary proteins according to their molecular weights (2), which made it possible to differentiate between glomerular (high molecular weight) and tu- bular (low molecular weight) urinary proteins. In 1980, Boesken developed a System for the classifica- tion of patterns obtained by SDS electrophoresis in relation to different aetiplogical aspects of proteinuria (3). He showed that renal äs well äs extrarenal dis- turbances can be reflected by changes in the protein- uric pattern. Other authors emphasized the impor- tance of a reliable recognition, especially of proteins known to be markers for specific pathological changes. They proposed technical improvements of SDS electrophoresis, such äs polychromatic silver
staining (4), immunoblotting (5), and high resolution, two-dimensional electrophoresis (6 — 8) for special purposes. The present paper describes a rapid method, suitable for routine conditions, for the Separation of urinary proteins by two-dimensional electrophoresis.
The first step of the Separation (first dimension) cor- fesponds to a routine cellulose acetate electrophoresis, while the second step, the SDS electrophoresis, is performed together with the final gel staining äs an autömatic procedure on the "PhastSystem". Urinary proteins are separated according to the five zone pattern of cellulose acetate electrophoresis äs well äs on the basis of their molecular weights. The resulting two-dimensional pattern of protein spots shows all the relevant urinary proteins, recognizable in most cases by their relative position. The resolution of the present method is higher than that of one-dimensional SDS electrophoresis alone. Due to a higher number of possible constellations of protein spots, the two- dimensional pattern is more suitable for the charac- terization of numerous aetiological aspects influenc- ing the composition of urinary proteins.
J. Clin. Chem. Clin. Biochem. / Vol. 27,1989 / No. 2
Materials and Methods A p p a r a t u s a n d M a t e r i a l s
The Separation in thc first dimension, by cellulose acetatc elec- trophoresis was done on a routine System from "CHEME- TRONT (Milano, Italy) using cellulose acetate film "Cellogel RS-10CT with the non-barbiturale buffer "02A03-10, TRIS- GLYC1NE SALICYLIC ACID" (pH 9,4).
The Separation in the second dimension s well s the final gel staining was carried out on "PhastSystem™" (Pharmacia Upps- ala, Sweden). The SDS electrophoresis was performed on pre- cast density gradient polyacrylamide gels "PhastGel Gradient 10-15" using "PhastGel SDS Buffer Strips". For the staining procedure "PhastBlue R tablets" (Coomassie Blue R 350) were used. Methanol, acetic acid and glycerol of analytical grade were supplied by Merck (Darmstadt, FRG).
For additional identification of proteins (immunofixation, im- munochemical detection in blotting experiments) antisera sup- plied by Behring (Marburg, FRG) were used.
The immunofixation was performed with "Immunofixation Kit" provided by "CHEMETRON".
Total urinary protein was determined quantitatively by the Coomassie Blue method, using the kit from Bio-Rad (Munich, FRG).
Procedure
Only samples of fresh "four hour" urines were analysed by the present method. Separations in both dimensions were per- formed according the Standard protocols recommended by manufacturers, with the following modifications. Application of the urinary sample to the surface of "Cellogel" was repeated len times, in order lo concenlrate the analysed proteins. The best results were obtained when a voltage of 20 V was applied during the whole application procedure. After each application the "drop" of sample was dried (by mouth blowing). It was advantageous to stain the sample with bromphenol blue before application.
The Separation by cellulose acetate electrophoresis was than performed at 260V for 25 min. During this time the total Separation distance reached 30 mm. Thereafter, a 3 χ 30 mm strip corresponding to the sample Separation was cut out with a scalpel. The "Celloger strip was then transferred with phi- latelic tweezers to the "PhastSystem" and overlayed onto the
"stacking gel area" of the "PhastGel Gradient 10-15", which was already in the apparatus. The Separation was then done at 300 V, 5 °C and for 80 Vh.
Thereafter, the "PhastGel Gradient 10—15" was transferred to the development unit of the "PhastSystem" and stained ac- cording to the application file No. 200. Ready gel was photo- copied with "zoom" enlargement of 141% for documentation.
Identification of spots
The main urinary proteins separated s spots on the two- dimensional patlern were identified by:
1. their known mobilities within the five zone pattern of cel- lulose aeetate electrophoresis (verified by immunofixation) (9, 10).
2. their known molecular weights (11, 12) and
3. s reported earlier by mobilities within the pattern of SDS electrophoresis (5, 13).
The definitive identification of proteins listed on figure l, was confirmed by blotting experiments. For this purpose the thermal diffusion blotting (PhastSystem Application file No. 220) and immunochemical detection on the nitrocellulose membrane (5) were used.
Results
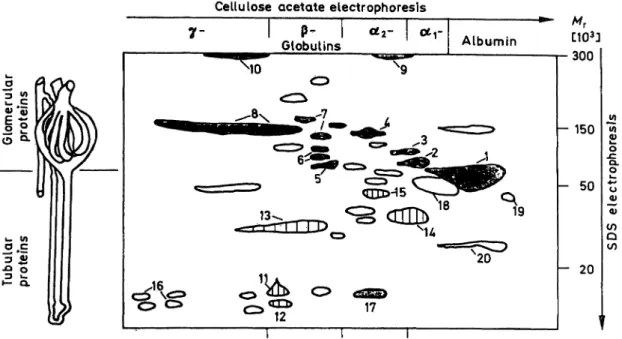
Figure l outlines the two-dimensional pattern of pro teins found in pathological urinary samples. The first dimension (horizontal axis) represents the five zone Separation by cellulose acetate electrophoresis known from serum electrophoresis. albumin, a
r, a
2-, - and γ-globulins. The second dimension (yertical axis) re- presents the Separation by SDS electrophoresis, where the distribution of proteins follows the logarithm of molecular weight ranging from 10 to 250 · l O
3. In cases of dysfunction of the glomerulo-tubular ap- paratus, spots situated in the upper half of the pattern correspond to proteins of glomerular origin, while spots in the lower part are relevant to tubular dys- function.
The glomerular selectivity is characterized by the rel- ative abundancies of spots corresponding to IgG, transferrin and albumin and they can be estimated by their visual comparison, s proposed for evaluation of one-dimensional SDS electrophoresis by oesken's classification (3). Moreover, the better res lution and recognition of urinary proteins in the two-dimensional pattern permits the identification of fufther patho->
genetic aspects of proteinuria s demomstrated by following examples:
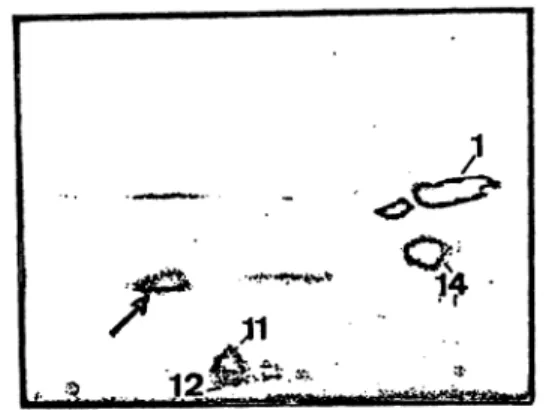
Figure 2 and 3 show two proteinuric patterns of tubular proteinuria. In both pictures, protein spots are situated in the lower part of the pattern. The albumin spots are of comparable intensity in both cases. The first pattern (fig. 2) contains 6 spots, whereas the second (fig. 3) shows identical but mofe intense spots, and several additional low molecular proteins (—>). The first proteinuric pattern (fig. 2) was obtained from a 30-year-old woman, 10 days after an intoxication by sodium chlorate. As reported (14), this substance causes tubular injuries. At the time of the analysis the kidney funetion was improved (serum creatinine 130 μπιοΐ/ΐ). It can be assumed that the mild proteinuria (total concentration of proteins in urine 0.4 g/l) is an expression of residual functional damage of the tubular apparatus. The second pattern (fig. 3) shows proteins in the urine of a 41-year-old man with a terminal kidney insufficiency caused by a chronic abuse of analgesics. The total concentration of urinary proteins was 0.9 g/l, the serum creatinine 760 μιηοΐ/ΐ. The patient was subrnitted to chronic haemodialysis. The proteinuric patterri can be consid- ered to show pronounced tubulointerstitial damage with low molecular weight proteins arising from the tissue degradation.
The next two pictures show proteinuric patterns due to diffefeiit glomerular disorders. The first case (fig.
4) was, a peracute glomerulonephritis followed by
Lapin: Two-dimensional electrophoresis of urinary proteins 83 Cellulose acetate etectrophoresis
P- l 0£2-
Globulins Albumin
^10
1
«OO 12 17
"r [ 3]
•300
- 150
- 50
- 20
l l l
Fig. 1. Schematic map of proteins found in different pathological samples. Horizontal axis (Ist dimension) cellulose acetate electrophoresis. Vertical axis (2nd dimension) SDS electrophoresis.
Glomerular proteins: l albumin, 2 otj-proteinase inhibitor, 3 arantichymotrypsin, 4 inter-a-trypsin inhibitor, 5 haemopexin, 6 transferrin, 7 C-3 complement, 8 IgG and IgA (monomer), 9 oc2-macroglobulin, 10 IgM.
Tubular proteins: 11 retinol binding protein, 12 ß2-micro globulin, 13 light chains of immunoglobulins, 14 armicroglobulin, 15 Zn-ot2-glyco protein, 16 lysozyme and post-y-globulin.
Other proteins: 17 haemoglobin (monomer), 18 orosomucoid (oc2-acid-glycoprotein), 19 prealbumin, 20 apolipoprotein A-
15
14 11
12
_-^<^ ;
6<^,4^2 7
15:
,13s , > *
^1
14 12vFig. 2. Urinary proteins froni a patient 10 days after her h>
toxication by sodium chlorate. Residual functional tu- bular damage.
Fig. 3. Urinary proteins from a patient with chronic abuse of analgesics. Pronounced tubulo-interstitial damage with a degenerative process. Tubular proteins äs reported in figure 2 with additional low moiecular weight proteins frora proteolytic degradation (-*).
Fig. 4. Urinary proteins frorn a patient suffering from a per- acute glomerulonephritis.
/·*" Acute phase of inflammation is marked by proteins of qcr and a2-zones such äs at-proteinase inhibitor (show- ing about the same intensity äs albumin).
-* Non selective glomerular proteinuria is indicated by proteins of high or very high moiecular weights (immunoglobulin area) [8].
-^ Massive haematuria marked by haemoglobin mon- omer [17].
— Tubular proteinuria can be characterized äs second- ary-functional.
kidney failure in a 38-year-old male patient. The serum creatinine was higher than 1000 /l and the total concentration of urinary proteins 9.8 g/l. The extraordinarily impressive clinical state of the patient were well confirmed by the proteinuric pattern: the picture is dominated by extensive Spots of albumin and oti-proteinase inhibitor, äs well äs by other t%glo-
J. Clin. Chem. Clin. Biochem. / Vol. 27,1989 / No. 2
merular" and acute phase proteins. The "line" of immunoglobulins IgG shows vertical streaks due to overloading artifacts. On the bottom of the picture in the a2-zone is a spot corresponding to haemoglobin monomer, confirming a haematuria. In contrast, "tu- bular" proleins are present only with average intensity and their constellation is comparable to the "func- tional tubular proteinuria" showed on figure 2.
Figure 5 shows another glomerular proteinuria from a 69-year-old woman suffering from focal-segmental sclerosing glomerulo-nephritis s revealed by biopsy.
The total concentration of proteins in urine was 1.1 g/l and serum creatinine 133 μηιοΐ/ΐ. The niain pro- portion of urinary proteins is represented by albumin [1]. Other "glomerular" proteins are present in rather low amounts. No "tubular" proteins can be seen.
Using the present method, some unusual findings were obtained. The protein pattern shown on figure 6 was found in the urine from a 37-year-old male patient suffering from a non-renal infection with body tem- perature 38.5 °Cand white blood cells 15 χ ΙΟ3. The serum creatinine was within the normal r nge, 90 μιηοΐ/ΐ, and the total urinary protein (0.6 g/l) was
8
Fig. 5. Urinary proteins from a patient suffering from a chronic, focal sclerosing, segmental glomerulonephritis.
Glomerular selective proteinuria. Main proportion of urinary proteins (80%) is represented by albumin [1].
147 λ17χ
12
Fig. 6. Urinary proteins from a patient suffering from a non- renal, febrile infection.
Fig. 7. Tubular proteinuria with monoclonal paraprotein of type kappa free light chain (—>).
apparently due to the fever accompanying proteinuria (15). The protein pattern can be characterized neither s glomerular nor s tubular. The albumin is repre- sented by a thin spot and is surrounded by a spot corresponding to orosomucoid (aracid glycoprotein) [17]. According to Edwards and coworkers (8), "the increases in concentration of orosomucoid in serum and (presumably) urine suggest disorders involving leukocyte proliferation".
Another occasional finding is presented on figure 7.
A 61-year-old man showed a progressive kidney fail- ure. At the time of the analysis the serum creatinine was 220 μπιοΙ/1 and total urinary protein 0.6 g/L Urinary proteins show a tubular pattern comparable to the case shown on figure 2. However, an additional spot was found (—») which was identified by subse- quent immunofixation s a monoclonal paraprotein of type "kappa free chain".
Discussion
The aim of this work was to develop a simple, fast and reliable method for clinical analysis of proteins in pathological urinary samples. As a combination of two electrophoretic separations, the present method shows a better resolution than SDS electrophoresis alone. In comparison with the conventional high res- olution electrophoresis, the use of cellulose acetate electrophoresis for the first dimension instead of iso- electric focusing results in somewhat lower resolution.
However there are several advantages: The cellulose acetate electrophoresis requires less time and less ex- perience s compared with isoelectric focusing. Prob- lems arising from the use of ampholytes, especially their interference with the gel of the second dimension (16) are avoided. Using the cellulose acetate electro- phoresis, the high salt content of the sample can be better c mpensated, and this in turn permits the c n-
Lapin: Two-dimensional electrophoresis of urinary proteins 85
centration of the investigated proteins by repeated
application of the urinary sample. The "paper-like"
consistency of "Cellogel" facilitates the transfer from the Ist to 2nd dimension. The second dimension, the SDS electrophoresis, äs well äs gel staining are per- formed automatically on "PhastSystem". Moreover, all Separation media are provided äs "ready-to-use"
with quality warranted by the manufacturers. Self- preparation of gels of their pretreatment or preincu- bation during the procedure is unnecessary. There- fore, the present method is less laborious than other comparable two-dimensional electrophoretic methods performed on a "micro scale" (13, 16—19).
With the exception of the application of the sample and its transfer from the first to the second dimension, no special manual skill is needed, so that the total analysis requires only 100 minutes. The method shows good reproducibility, äs shown by the fact that the analysis of diluted control serum on 20 consecutive days always revealed the same protein pattern, veri- fied by visual comparison of the resulting gels.
For gel staining, the Coomassie Blue R-350 method was preferred to the silver stain procedure. This was decided in view of better practicability and reliability, since the silver stain requires generally more technical experience, äs well äs reagents of high quality (espe- cially the water). Moreover, the Coomassie Blue R procedure only reveals urinary proteins when they are present in pathological concentrations. Samples from healthy persons with total urinary protein below 0.15 g/l show just a small spot of albumin. Since neither urea nor reducing reagents are used, the urinary pro- teins separated by the present method remained in their native unchanged form, so that the resulting two-dimensional pattern can be considered äs a "de- scriptive picture" of urinary proteins.
The distributiön of urinary proteins according to the five zones of cellulpse acetate electrophoresis repre- sents a familiär System in clinical chemistry. In the same way the molecular weight distributiön represents a comprehensive criterion.
Thus, the two-dimensional protein pattern is evalu- ated visually by following Steps:
(i) the evaluation of distributiön of proteins revealed by both Steps of Separation:
— five zone pattern of cellulose acetate electro- phoresis
— molecular weight distributiön revealed by SDS electrophoresis
(ii) recognition of "marker" proteins by their relative positions on the two-dimensional pattern and estimation of their diagnostic significance for spe- cific pathological changes.
(iii) evaluation of protein spot constellation; differ- entiation between patterns typical for certain dis- orders and irregulär or supplemental spots.
Especially the last step (iii) permits diagnoses that could not be achieved by one-dimensional SDS elec- trophoresis alone. Thus, the proposed diagnostic pro- cedure permits a deductive evaluation of two-dimen- sional protein patterns. For instance, äs shown on figure 2, 3 and 4, in all three cases the excretion of low molecular weight proteins into the urine was observed. However, the consideration of this "tubular proteinuria" in the context of each individual pattern of all urinary proteins, produces three different dia- gnoses:
figure 2: residual functional tubular damage
figure 3: degenerative process of kidney tissue and functional, tubular dysfunction
figure 4: secondary tubular proteinuria, due to over- loading of tubular reabsorption capacity (22).
The high variability of urinary proteins, which can be revealed and evaluated by the present method, re- quires a further systematic study in relation with anamnestic, clinical and especially patho-morphologic findings.
The present method represents a further improvement in the routine analysis of urinary proteins, and it can serve äs a non-invasive diagnostic method in nephrol- ogy.
References
1. Butler, E. A., Flynn, F. V., Harris, H. & Robson, E. B.
(1961) Clin. Chim. Ada 7, 34-41.
2. Pesce, A, J., Boreisha, I. B. & Pollak, V. R. (1972) Clin.
Chim. Acta 40,27 -34.
3. Boesken, W. ft. (1981) In: Electrophoresis' 81 (Allen, R.
C. & Arnaud, R, eds.) Walter de Gruyter & Co., Berlin, New York, pp. 453 - 462.
4. Wurster, U., Krall, F. & Ehrich, J. H. H. (1984) In: Elec- trophoresis' -84 (Neuhoff, V., ed.) Vlg. Chemie, Weinheim, Deerfield Beach, Basel, pp. 446-448.
5. Perini, J. M., Dehon, B., Marianne, T., Foulard, M. &
Roussel, Ph. (1987) Clin. Chim. Acta 169, 255-266.
6. Anderson, N. G., Anderson, N. L. & Tollaksen, S. L. (1979) Clin. Chem. 25, 1199-1210.
7. Edwards, J. J., Anderson, N. G., Tollakson, S. L., von Eschenbach, A. C. & Guevara, J. G. jr. (1982) Clin. Chem.
28, 160-163.
8. Edwards, J. J., Tollaksen, S. L. & Anderson, N. G. (1982) Clin. Chem. 28, 940-948.
J. Clin. Chem. Clin. Biochem. / Vol. 27,1989 / No. 2
9. Laurell, C. B. (1972) Scand. J. Clin. Lab. Invesl. 29 (Suppl.
124), 71-82.
10. Agguzzi, F., Poggi, N. & Chiara, T. (1978) La Ricerca Clin.
Lab. 8 (Suppl. 1) 171-177.
11. Putnam, F. W. (1975) In: The Plasma Proteins, Vol. 1/2 (Putnam, F. W., ed.) Academic Press, New York, San Fran- cisco, London: pp. 57 — 131.
12. Heide, K., Haupt, H. & Schwick, H. G. (1977) In: The Plasma Proteins, Vol. HI/8 (Putnam, F. W., ed.) Academic Press, New York, San Francisco, London, pp. 545 — 597.
13. Longberg-Holm, K., Bagley, A., Nussbacher, J. & Heal, J.
M. (1982) Clin. Chem. 28. 962-968.
14. Oliver, J. J., Smith, H. & Watson, A. A. (1972) J. Forensic.
Sei. Soc. 72,445-448.
15. Sandberg, T, Cooper, E. H., Lidin-Janson, G. & Yu, H.
(1985) Nephron 41, 39-44.
16. Cheong (Kim), K. S., Arold, N. & Neuhoff, V. (1986) In:
Electrophöresis' 86 (Proceedings of 6th discussion rneeting in Munich, 27.—29th Oct. 1986), (Radola, B. J., ed.) pp.
223-228.
17. Felgenhauer, K. & Hagedorn, D. (1980) Clin. Chim. Acta 700,121-132.
18. Marshall, T. (1983) Clin. Chem. 29, 592-593.
19. Hochstrasser, D., Augsburger, V, Pun, Th., Weber, D., Pellegrini, Ch. & Müller, A. F. (1988) Clin. Chem. 34,166-
170. · r
20. Yu, H., Yanagisawa, Y, Forbes, M. A., Cooper, E. H., Crockson, R. A. & Mac Lennan, I. C. M. (1983) J. Clin.
Pathol. 36, 253-259.
21. Schiwara, H. W., Hebeil, T. & Dräger, H. (1988) Fresenius Z. Anal. Chem. 330, 427.
22. Bernhard, A., Viau, C., Ouled, A. & Lauwerys, R. (1987) Nephron 45, 115-118.
DDr. Alexander Lapin Institut für Klinische Chemie und Laboratoriumsdiagnostik der Universität Wien
Lazarettgasse 14 A-1090 Wien