Molekularbiologische Untersuchungen zur Biodiversität
heterotropher Flagellaten
Inaugural-Dissertation zur
Erlangung des Doktorgrades
der Mathematisch-Naturwissenschaftlichen Fakultät der Universität zu Köln
vorgelegt von Frank Scheckenbach
aus Köln 2005
Druck: M & S Copy-Druckhaus
Berichterstatter:
Prof. Dr. H. Arndt Prof. Dr. D. Tautz
Tag der letzten mündlichen Prüfung: 17. Januar 2006
Inhaltsverzeichnis
Danksagung 9
Einleitung 11
Kooperationspartner 17
I. Molecular identity of strains of heterotrophic flagellates isolated from surface waters and deep-sea sediments of the South Atlantic
based on SSU rDNA 19
II. Molecular comparisons of freshwater and marine isolates of the same morphospecies of heterotrophic flagellates 35
III. Morphospecies of heterotrophic flagellates: A case study for Cae-
citellus spp. 51
IV. Where are all the protists? 73
Abstract 81
Kurzzusammenfassung 83
Literatur 85
Anhang 99
Abbildungsverzeichnis
I Schätzung der Anzahl Arten pro Größenklasse und des Verhältnisses S = L
-2. 12
1.1 Phylogenetic tree of Bodonidae . . . 28
1.2 Phylogenetic tree of Apusozoa . . . 28
1.3 Phylogenetic tree of Bicosoecida . . . 28
2.1 Phylogenetic tree of Apusozoa . . . 43
2.2 Maximum likelihood tree of Kinetoplastea . . . 43
2.3 Minimum evolution tree of Kinetoplastea . . . 46
3.1 Model of Caecitellus . . . 57
3.2–3.6 Differential interference contrast light micrographs of Caecitellus . . . 58
3.7 Differences in the length of the posterior flagellum between the surface and the deep-sea strain of Caecitellus . . . 59
3.8–3.11 Transmission electron micrographs of the general cellular organisa- tion of Caecitellus . . . 60
3.12–3.21 Transmission electron micrographs of the kinetid of Caecitellus . . . 61
3.22–3.31 Transmission electron micrographs of the microtubular structure of the feeding basket of Caecitellus . . . 63
3.32 Phylogenetic tree of Bicosoecida . . . 65
3.33–3.34 Reconstruction and whole cell drawings of Caecitellus . . . 68
4.1 Observed and estimated number of protist cryptic species and general
statistics of protist sequences retrieved from GenBANK . . . 79
Tabellenverzeichnis
I Anzahl benannter lebender Arten und Schätzung der Gesamtartenzahl . . . . 13
1.1 Sample location and accession number of all species studied . . . 23
1.2 External and internal SSU rDNA PCR primers . . . 24
1.3 P-distances of Rhynchomonas nasuta . . . 26
1.4 P-distances of Amastigomonas debruynei . . . 27
1.5 P-distances of Ancyromonas sigmoides . . . 27
1.6 P-distances of Cafeteria spp. . . 27
1.7 P-distances of Caecitellus parvulus . . . 28
2.1 Sample location and accession number of strains sequenced . . . 39
3.1 Sample location, sequence length and accession nnumber of strains se- quenced . . . 56
3.2 P-distances of Caecitellus . . . 64
3.3 Summary of differences between the species of the Caecitellus complex . . 67
Anhang A Basic statistics of all morphospecies retrieved from GenBANK . . . 99
Danksagung
• Prof. H. Arndt danke ich herzlich für die Möglichkeit zur Promotion und insbe- sondere für die finanzielle Unterstützung während dieser Zeit. Auch möchte ich mich dafür bedanken die Möglichkeit bekommen zu haben, im Laufe dieser Zeit an einer Expedition mit dem Forschungsschiff M eteor teilnehmen zu dürfen.
• Prof. D. Tautz danke ich herzlich für die Begutachtung der Promotion.
• Prof. K. Hausmann danke ich herzlich Petra Selchow die Möglichkeit gegeben zu haben, die ultrastrukturellen Untersuchungen von Caecitellus spp. vornehmen zu können. Auch möchte ich mich für die schöne Zeit auf der M eteor bedanken.
• Petra Selchow möchte ganz besonders danken die ultrastrukturellen Untersuchun- gen von Caecitellus spp. vorgenommen zu haben. Ohne ihre Ergebnisse würde dieser Arbeit ein entscheidender Teil fehlen. Noch einmal einen ganz herzlichen Dank.
• Claudia Wylezich möchte ich für ihre Hilfe bei alltäglichen Problemen und die Erstellung der Primer danken.
• Danke auch an die gesamte AG Arndt für die produktive Zusammenarbeit wäh- rend dieser Zeit.
• Der „Deutschen Forschungsgemeinschaft“ (DFG) möchte ich für die Bereitstel- lung der im Rahmen dieser Arbeit benötigten Sachmittel und vor allem für die Finanzierung meiner Stelle durch ein gefördertes Projekt (Ar 288/5) danken.
• Mein ganz besonderer Dank geht an meine Eltern, ohne die ich zwangsläufig nie-
mals die Möglichkeit zu dieser Arbeit bekommen hätte.
Einleitung
Protisten sind eine heterogene Zusammenfassung mikrobieller Eukaryoten bestehend aus Organismen wie Protozoa, einzelligen Algen oder Schleimpilzen (Hausmann et al.
2003). Sie entwickelten sich vor etwa 1.5 bis 2 Milliarden Jahren durch Endosymbiose aus Prokaryoten (Margulis et al. 1993). Die meisten Protisten sind mikroskopisch klein (< 100 µm) und spielen eine entscheidende Rolle in natürlichen Lebensräumen (Cor- liss 2002). Frei-lebende Protozoa sind phagotroph und kontrollieren die Abundanz von Bakterien und anderen Mikroben, einzellige Algen sind für die Fixierung des größ- ten Teils an CO
2in aquatischen Lebensräumen verantwortlich, und Schleimpilze sind wichtige Konsumenten von Bakterien und Pilzen im Boden, um nur einige Beispiele für ihre entscheidende Rolle in natürlichen Lebensräumen zu nennen. Neben Bakterien und kleinen Metazoa sind Protisten die wichtigste Komponente im mikrobiellen Nahrungs- gewebe aquatischer Ökosysteme (Arndt et al. 2000). Nach Viren und Prokaryoten stel- len Protisten die individuenreichste Organismengruppe überhaupt dar, mit Abundanzen von 10
4bis 10
7Individuen · m
-2. Als Gruppe weisen Protisten eine unglaubliche mor- phologische und ultrastrukturelle Vielfalt auf und ihre Morphologie – und somit das morphologische Artkonzept – ist seit über 200 Jahren der beherrschende Faktor für ihre Bestimmung (Hausmann et al. 2003). Bis heute ist das Maß ihrer Artenvielfalt nicht bekannt und es besteht kein Konsens ihre Phylogenie betreffend (Andersen 1998).
Flagellaten dominieren Protistengemeinschaften in planktischen Lebensräumen. Sie umfassen eine taxonomisch sehr diverse Gruppe einzelliger oder koloniebildender Or- ganismen (oder einen Lebensabschnitt anderer Protisten), welche sich durch das Vor- handensein eines oder mehrerer Flagellen, bzw. Cilien, in der trophischen Phase aus- zeichnen und keinen Makronukleus besitzen. Sie stellen eine rein morphologisch defi- nierte, polyphyletische Gruppe eukaryotischer Einzeller dar, welche in 111 Ordnungen, 60 Klassen, 16 Stämmen und 3 Königreichen eingeordnet werden und wahrscheinlich die ursprünglichste eukaryotische Organisationsform sind (Cavalier-Smith 2000). Sie besitzen meistens eine begrenzte Anzahl morphologischer Merkmale, was ihre Iden- tifizierung erschwert und oftmals elektronenmikroskopische Aufnahmen nötig macht.
Primäre Bestimmungsmerkmale sind, neben ihrer Färbung, die Anordnung und der Auf- bau ihrer Flagellen, ebenso wie die allgemeine Körperform und Bedeckung. Auf unteren taxonomischen Ebenen gleichen sich die morphologischen Merkmale häufig und kom- plizierte, polymorphe Lebenszyklen einiger Flagellaten erschweren ihre Bestimmung zu- sätzlich (Medlin et al. 2000).
In der Ökologie gibt es eine Reihe grundlegender Muster (Lawton 1999). Eines dieser
makroökologischen Muster ist das der beinahe schon kanonischen log-normalen Arten-
vielfalt. Hutchinson und MacArthur (1959) hatten beobachtet, dass die Anzahl an Ha-
bitaten und demzufolge an Arten (S), umgekehrt proportional zur Körperlänge (L) im
Quadrat abnahm (S = L
-2; Abbildung I). Eine ähnliche Beziehung wurde von Siemann
et al. (1996) für die Beziehung zwischen Artenzahl (S) und Abundanz (I) beobachtet
(S = I
2). Hiervon abweichende Muster wurden von Robert M. May (1988) für terrest-
rische und von Tom Fenchel (1993) für aquatische Gemeinschaften gefunden. Robert
log
10(Länge in mm)
A n za h l A rt en
-0.5 0 0.5 1 1.5 2 2.5 3 3.5 4
10
010
110
210
310
410
510
610
7Abbildung I: Schätzung der Anzahl Arten pro Größenklasse (schwarze Linie) und des Verhält- nisses S = L
-2(S Anzahl Arten, L Länge; rote Linie). Quelle: Robert M. May „How many species are there on earth?“ Science 241:1441-1449, 1988.
M. May (1988) hatte die Anzahl beschriebener Arten in den jeweiligen Größenklassen
zusammengetragen. Dabei nehmen die Artenzahlen in logarithmischen Größenklassen
mit abnehmender Größe zu mit der a priori Erwartung, dass es insgesamt mehr klei-
ne, als große Arten geben solle. Bei einem Schwellenwert, welcher annähernd bei einer
Größe von 1 mm liegt, nehmen die Artenzahlen hingegen wieder kontinuierlich ab (Ab-
bildung I). Mit Ausnahme einiger weniger Taxa liegen alle Protistenarten unterhalb die-
ses Schwellenwertes. Extrapoliert man die von Robert M. May dargelegte Beziehung,
müssten bereits in der Größenklasse von 1 mm 10 bis 50 Millionen Arten vorhanden
sein; die Anzahl an Protozoa müsste demzufolge astronomisch hoch sein und bei über
10
8Arten liegen. Wie Robert M. May bemerkte, ist dem aber augenscheinlich nicht
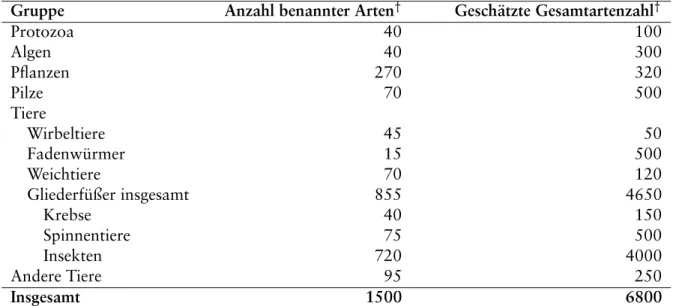
so (Tabelle I). Weltweit sind etwa 720000 Insektenarten beschrieben (May 1997) und
die geschätzte Gesamtzahl mag bei über 5 Millionen liegen (Gaston 1992). Demgegen-
über sind aber gerade einmal 30000 Protozoa (Fenchel 1993) beschrieben und Schät-
zungen der Gesamtartenzahl kommen auf ungefähr 100000 (Corliss 1982, May 1997)
bis 200000 („Global Biodiversity Estimate for the UN“, Heywood 1995). Selbst die
am besten untersuchten Protisten – die Ciliaten – sind mit geschätzten 3000 Arten ver-
gleichsweise artenarm (Finlay & Fenchel 1999), auch wenn anerkannte α-Taxonomen
auf diesem Gebiet, wie Wilhelm Foissner (1999), ihre Gesamtzahl um den Faktor 10
höher schätzen (40000 Arten). Die so wichtige Gruppe der Flagellaten brachte es 1982
(Corliss 1982) ohne Dinoflagellaten (4200 Arten) und Haptophyta (1500 Arten) auf
200 Arten. Schätzungen der Gesamtzahl heterotropher Flagellaten (ohne Dinoflagella-
Tabelle I: Anzahl benannter lebender Arten und Schätzung der Gesamtartenzahl.
Gruppe Anzahl benannter Arten
†Geschätzte Gesamtartenzahl
†Protozoa 40 100
Algen 40 300
Pflanzen 270 320
Pilze 70 500
Tiere
Wirbeltiere 45 50
Fadenwürmer 15 500
Weichtiere 70 120
Gliederfüßer insgesamt 855 4650
Krebse 40 150
Spinnentiere 75 500
Insekten 720 4000
Andere Tiere 95 250
Insgesamt 1500 6800
†
Anzahl in Tausend.
Quelle: Robert M. May „The Dimension of Life on Earth“ in Nature and Human Society:
The Quest for a Sustainable World, Peter H. Raven (Herausgeber), National Academy Press, Washington, D. C., 1997.
ten) kommen auf 3000 Arten (Lee & Patterson 1998). Das geschätzte „grand total“ an Eukaryoten mag bei 6.8 Millionen Arten liegen (May 1997). Protozoa würden demzu- folge nur 1,47 % aller Arten weltweit stellen.
Eine Erklärung für diese geringen Artenzahlen bei Protisten liegt möglicherweise in
ihren hohen Abundanzen, welche zusammen mit einer einfachen Verbreitungsmöglich-
keit (Griffin et al. 2002) zu einem weltweiten Vorkommen aller Arten in ihrem jewei-
ligen Habitat führt („everything is (almost) everywhere, the environment selects“, Fen-
chel & Finlay 2003). Nach Ernst Mayr (1942) ist aber für die Entstehung neuer Arten
eine räumliche und zeitliche Trennung von Populationen notwendig. Da diese Ansichts-
weise in der Protistologie nach wie vor Lehrbuchcharakter hat, muss bei einer welt-
weiten Verbreitung von Protisten die Rate allopatrischer Artbildung niedrig sein und
folglich wäre mit einer niedrigen Gesamtartenzahl zu rechnen (Finlay 2002). Proka-
ryoten, welche in der Mehrzahl noch eine Größenordnung unter den Protisten liegen,
bei zugleich höheren Gesamtzahlen (10
30Individuen weltweit), müssten Autoren wie
Bland J. Finlay und Tom Fenchel zufolge, entsprechend wenige Arten aufweisen, und
in der Tat sind lediglich 4500 Arten benannt (Torsvik et al. 2002). Aktuelle Schätzun-
gen ihrer Gesamtartenzahl gehen aber in die Millionen (Curtis et al. 2002, Torsvik et
al. 2002), ja sogar Milliarden (Dykhuizen 1998). Hochrechnungen basierend auf der
kleinen ribosomalen Untereinheit (SSU) kommen je nach Maß für die zulässige intras-
pezifische genetische Distanz auf 35000 (maximal 3 % genetische Distanz) bis 325000
(0 % genetische Distanz) Bakterienarten (Schloss & Handelsmann 2004).
Robert M. May (1988) und Wilhelm Foissner (1999) haben als Grund für die mögli- cherweise zu niedrige Artenzahl an Protisten fehlendes taxonomisches Interesse, und demzufolge fehlende taxonomische Arbeit auf diesem Gebiet, genannt. Demzufolge müssten noch eine Vielzahl Arten an nicht näher untersuchten Orten dieser Welt auf ihre Entdeckung warten (z. B. im Boden, im tropischen Regenwald oder im Tiefsee- benthos). Aktuelle molekularbiologische Arbeiten konnten in der Tat eine Fülle unbe- kannter Phylotypen in natürlichen Lebensräumen entdecken und zeigen, dass die mi- krobielle Diversität viel größer ist, als mit konventionellen Methoden aufgedeckt wer- den kann (Moon-van der Staay et al. 2001, López-García et al. 2001, Dawson & Pace 2002). Es scheint aber unwahrscheinlich, dass mehrere Größenordnungen an Arten, mit klassischen Methoden übersehen wurden (Lawton 1998). Des Weiteren könnten die Diversitätsmaxima in weniger gut untersuchten Gruppen, wie etwa den heterotro- phen Flagellaten, liegen, aber auch dies scheint unwahrscheinlich (Lawton 1998).
Besondere Aufmerksamkeit muss grundsätzlichen Problemen mit dem morphologi- schem Artkonzept gewidmet werden (Schlegel & Meisterfeld 2003). Die unzureichende taxonomische Auflösung der morphologischen Merkmale vieler Protisten ist möglicher- weise der entscheidende Grund für ihre geringen Artenzahlen (May 1988). So ist es z. B.
nicht möglich einige marine, kokkenähnliche Picoplankter („brown tiny balls“) mor- phologisch über das taxonomische Level der Klasse zu bestimmen (Potter et al. 1997);
einige morphologisch identische Stämme der Art Tetrahymena pyriformis können sich nicht miteinander paaren (Nanney et al. 1998); verschiedene Stämme der Morphoart Neobodo designis haben unterschiedliche Toleranzen gegenüber dem Salzgehalt ihrer Umgebung (Ekelund 2002); und grundsätzlich können morphologisch identische Stäm- me große genetische Unterschiede aufweisen (Scheckenbach et al. 2005). Das morpho- logische Artkonzept führt demnach möglicherweise zu einem „lumping“ unterschiedli- cher Arten unter dem Mantel einer Morphoart (Patterson & Lee 2000). Aktuelle Ar- beiten deuten auf ein eher hohes Maß an kryptischer Diversität hin und Bakteriologen, ebenso wie Hefe-Systematiker, sind sich sich seit längerem darüber im Klaren, dass eine morphologische Klassifikation eigentlich bedeutungslos ist (Lachance 2004). Sollte eine hohe Anzahl kryptischer Arten, d. h. Arten, welche mit dem derzeit vorherrschenden morphologischen Artkonzept nicht mehr unterschieden werden können („sibling spe- cies, cryptic species, genetic species, physiological/ecological species“), der Grund für die geringe Artenzahl an Protisten sein? Sollte John J. Cairns (1993) mit seiner Vermu- tung Recht behalten, dass Morphoarten lediglich eine Fassade sind, hinter welcher sich eine Fülle taxonomisch eigenständiger Einheiten verbergen?
Diese Arbeit soll am Beispiel heterotropher Flagellaten, Hinweise darauf liefern, dass die Diversität von Protisten durch das morphologische Artkonzept unterschätzt wird.
Darüber hinaus soll versucht werden eine Abschätzung über das Maß an kryptischer
Diversität zu geben. Hierzu soll der Grad an intraspezifischer genetischer Divergenz
und somit möglicher kryptischer Diversität der ökologisch so bedeutsamen Gruppe he-
terotropher Flagellaten ermittelt werden. Dazu wurden einige der weltweit häufigsten
Arten heterotropher Flagellaten untersucht (Amastigomonas debruynei, Ancyromonas
sigmoides, Apusomonas proboscidea, “Bodo” curvifilus, Bodo saltans, Cafeteria ro-
enbergensis, Caecitellus parvulus, Dimastigella mimosa, Neobodo designis, Neobodo
saliens, Parabodo caudatus, Pseudobodo tremulans, Procryptobia sorokini, Rhyncho- bodo sp. und Rhynchomonas nasuta). Eine Datenbankrecherche soll die kryptische Diversität in Gruppen, welche ausschließlich Protisten enthalten, ermitteln. Als Maß für die kryptische Diversität wird dabei die genetische Divergenz innerhalb einer Mor- phoart angenommen ebenso wie deren Phylogenie. Hierbei spielt es zunächst einmal keine Rolle, was der Grund für das Entstehen kryptischer Arten ist, da unterschiedliche Arten prinzipiell mit der Zeit genetisch divergieren und dies wiederum mit geeigneten molekularen Markern nachweisbar ist. Als molekularen Marker dient die kleine riboso- male Untereinheit (SSU), deren Auflösung auf der taxonomischen Ebene der Morphoart bei Protisten in aller Regel als ausreichend angesehen wird (Medlin et al. 2000, Avise 2004).
Da Artbildung in Sympatrie eine weitaus bedeutendere Rolle zu spielen scheint, als bisher angenommen (Tautz 2003), und dies am leichtesten entlang steiler ökologischer Gradienten (Dieckmann & Doebeli 1999, Doebeli & Dieckmann 2003), wurden Stäm- me von geographisch und ökologisch unterschiedlichen Orten isoliert, um evolutionär relevante Muster zu finden. Der Vergleich von Stämmen aus Süßwasser mit Stämmen aus marinen Habitaten und insbesondere der Tiefsee (May 1992, Morin & Fox 2004), schien besonders viel versprechend, um eventuell ökologische, bzw. biogeographische Muster, innerhalb von Morphoarten heterotropher Nanoflagellaten (Zellgröße der un- tersuchten Arten 6 16 µm), welche weltweit verbreitet sind und zu den ökologischen Generalisten zählen, zu finden. Die Arbeit gliedert sich in 4 Kapitel.
• Kapitel 1 untersucht die intraspezifische genetische Divergenz innerhalb von Mor- phoarten, für welche Stämme zugleich von der Oberfläche und der Tiefsee des Südatlantiks isoliert wurden, und geht der Frage nach, ob ein und dieselbe „Art“
in derart unterschiedlichen, geographisch getrennten Lebensräumen vorkommen kann.
• Kapitel 2 untersucht die intraspezifische genetische Divergenz innerhalb von Mor- phoarten, für welche Stämme aus unterschiedlichen Habitaten isoliert wurden, und geht insbesondere der Frage nach, inwieweit die ökologischen Unterschiede zwischen Süßwasser und marinen Habitaten für ein und dieselbe „Art“ ein Hin- dernis für ihre Verbreitung darstellen, bzw. inwieweit unterschiedliche Habitate unterschiedliche ökologische Nischen darstellen, und somit andere Arten beher- bergen sollten.
• Kapitel 3 untersucht die intraspezifische genetische Divergenz und Ultrastruktur von Caecitellus spp., und geht der Frage nach, worin die Unterschiede zwischen genetisch divergierenden Stämmen einer kryptischen Morphoart liegen.
• Kapitel 4 versucht eine Abschätzung des Maßes an kryptischer Diversität anhand
der von mir bearbeiteten Morphoarten, zusammen mit Daten anderer Protisten-
arten aus GenBANK, zu geben.
Kooperationspartner
Für die Auswertung in der vorliegenden Arbeit wurden teilweise Daten Dritter zur Ver- fügung gestellt, bzw. Daten mit Hilfe Dritter erhoben. Dies waren im einzelnen:
• Die morphologischen und v. a. ultrastrukturellen Untersuchungen von Caecitellus paraparvulus (DQ220712) und Caecitellus pseudoparvulus (DQ220713) wurden von Petra Selchow bei Prof. K. Hausmann, AG Protozoologie, Institut für Biolo- gie/Zoologie, Freie Universität Berlin, durchgeführt. Von Petra Selchow stammen ebenfalls Teile von Kapitel 3.
• Die externen und internen Primer wurden von Claudia Wylezich erstellt.
• Im Rahmen der „Heterotrophic Flagellate Culture Collection Cologne“ (HFCC) standen die Stämme mit folgenden GenBANK-Zugriffsnummern zur Verfügung:
AY827841–AY827846, AY827849–AY827852, AY827855, DQ207563, DQ207- 567, DQ207569–DQ207571, DQ207576–DQ207581, DQ207589–DQ207593, DQ207595, DQ220712–DQ220713, DQ220718.
• Apusomonas proboscidea (DQ207568) wurde von Nina Loquay isoliert und se- quenziert. Die Fragmente wurden von Rosita Bieg zusammengefügt und korri- giert.
• Bodo saltans (DQ207574) und Rhynchomonas nasuta (DQ207598) wurden von Markus Weitere isoliert, bzw. zur Verfügung gestellt.
• Caecitellus pseudoparvulus DQ230538 stammt aus der „American Type Culture
Collection“ (Caecitellus parvulus ATCC50091).
Part I.
Molecular identity of strains of
heterotrophic flagellates isolated from surface waters and deep-sea sediments of
the South Atlantic based on SSU rDNA
Abstract
Whereas much is known about the biodiversity of prokaryotes and macro-organisms in the deep sea, knowledge concerning the biodiversity of protists remains very lim- ited. Molecular studies have changed our view of the marine environments and have revealed an astonishing number of previously unknown eukaryotic organisms. Mor- phological findings show that at least some widely distributed nanoflagellates can also be found in the deep sea. Whether these flagellates have contact with populations from other habitats is still uncertain. We performed a molecular comparison of strains isolated from deep-sea sediments (> 5000 m depth) and surface waters on the basis of their small subunit ribosomal DNA (SSU rDNA). Sequences of Rhynchomonas nasuta, Amastigomonas debruynei, Ancyromonas sigmoides, Cafeteria roenbergensis, and Cae- citellus parvulus were analysed, and 2 contrasting results obtained. Firstly, we found nearly identical genotypes within 1 morphospecies, and secondly, quite different geno- types within certain morphospecies (R. nasuta, A. sigmoides, and C. parvulus). In addition, high genetic distances between the different strains of A. sigmoides and C.
parvulus indicate that these morphospecies should be divided into different at least ge- netically distinguishable species. In contrast, some heterotrophic nanoflagellates must indeed be regarded as being cosmopolitan. According to the low genetic distances be- tween isolates of R. nasuta, A. debruynei and C. roenbergensis as well as between our isolates of A. sigmoides from deep-sea and surface waters, exchanges between these habitats and also on a global scale might be possible. In summary, our results show that 3 morphospecies obviously contain several cryptic species, while some of the in- vestigated genotypes occur in both deep-sea as well as in surface waters.
Key Words Biodiversity · Deep sea · Heterotrophic flagellates · Molecular ecology ·
Phylogeny · Angola Basin · SSU rDNA
Introduction
Heterotrophic flagellates are recognised as being fundamental components of aquatic ecosystems. Within planktonic and benthic food webs these micro-organisms function as nutrient remineralizers and intermediaries to higher trophic levels. They are the primary consumers of bacteria, cyanobacteria and microalgae. Because of their high abundance, metabolic activity and their ability to ingest significant amounts of organic material, heterotrophic flagellates have been considered to be major nutrient recyclers in marine environments (Azam et al. 1983, Gasol & Vaqué 1993). The ecology of heterotrophic flagellates has been fairly well characterised; however, our knowledge of population structure and species diversity still remains quite limited (Arndt et al. 2000).
Although many studies on species diversity of different locations of the marine littoral throughout the world have been carried out (e. g. Patterson & Simpson 1996, Ekelund
& Patterson 1997, Tong 1997a, Lee & Patterson 2000), little is known about the bio- geography of most species, as many have only been reported to occur in a few locations.
This might be an indicator for endemism, although studies on the community structure have not revealed a specific geographic distribution (Lee & Patterson 1998, Patterson
& Lee 2000, Al-Qassab et al. 2002). The composition of flagellate communities in deep-sea environments and whether it is unique or not, is still unclear (Turkey et al.
1988, Turley & Carstens 1991, Atkins et al. 1998, Hausmann et al. 2002a, Arndt et al. 2003). Nearly all flagellates found in the deep sea have also been reported to occur in other locations (Patterson et al. 1993, Patterson & Lee 2000, Atkins et al. 2000, Arndt et al. 2003).
The geographic distribution of organisms is determined by their evolutionary history, their physiological preferences and by forces of dispersal (e. g. Fenchel et al. 1997).
Small species with very high abundances and the possibility to form resting stages (such as many flagellates) have a high probability of dispersal by (e. g.) global oceanic cir- culation, convective transport into the high strata of the atmosphere, or transport by animals such as birds (Finlay et al. 2001). Thus, large scale dispersal across physical and geographical barriers may be possible and may have led to a global distribution (Finlay 2002). As ubiquity would limit the local speciation and extinction rate, the global number of species might be relatively small (Fenchel 1993). In contrast, our knowledge of the dispersal rates of micro-organisms is very limited. Exchange rates between soil, groundwater and deep-sea habitats should be very low, although several morphospecies seem to occur in all 3 habitats (Arndt et al. 2003).
Most gaps in the available data on total number of species and their distribution are primarily the result of difficulties associated with identifying heterotrophic flagellates to the species level (Patterson & Lee 2000). Sufficient criteria for morphological tax- onomic characterisation of flagellates can be obtained from electron microscopy (EM;
Foissner 1999), but even when molecular data indicate significant differences, EM stud- ies may not always reveal significant morphological differences (A. P. Mylnikov, pers.
comm.). In addition, most field studies and species descriptions have been conducted
using light microscopy, a method which may not be sufficiently discriminatory. Thus, it
is possible that traditional morphospecies comprise a much greater number of ecolog-
ically or molecularly defined species. Recent studies based on small subunit ribosomal DNA (SSU rDNA) sequence data have revealed that morphospecies from different lo- cations can be nearly genetically identical (Atkins et al. 2000, Darling et al. 2000). In contrast, some morphospecies of flagellated algae and ciliates (Proeschold et al. 2001) comprise groups clearly distinguishable by DNA comparison. Eukaryotic protist diver- sity, at least in marine environments, seems to be much greater than presently assumed (López-García et al. 2001, Moon-van der Staay et al. 2001, Stoeck & Epstein 2003), but very little is known about the deep-sea benthic protists (Edgcomb et al. 2002).
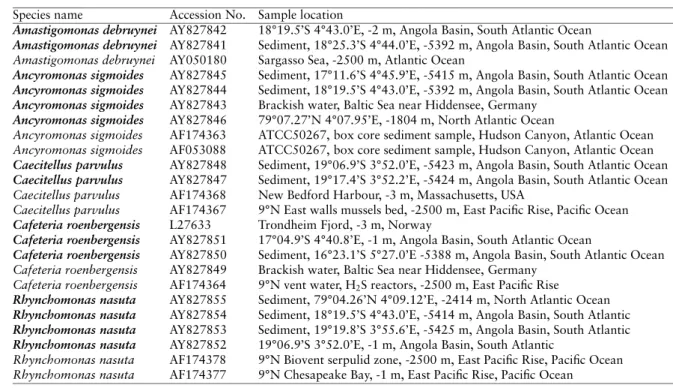
Although the deep-sea floor represents the largest part of earth’s surface, its most abundant eukaryotic inhabitants have been little studied. In order to investigate the possible ubiquitous distribution of heterotrophic protists (Finlay 2002, 2004), we iso- lated flagellate strains from the Atlantic deep sea (South Atlantic, Angola Basin) from depths down to 5425 m. We were especially interested in the isolation of very com- monly distributed species in order to determine whether these morphospecies can really be called cosmopolitan. We sequenced the SSU rDNA of Rhynchomonas nasuta Klebs, 1892, Amastigomonas debruynei De Saedeleer, 1931, Ancyromonas sigmoides Kent, 1880, and Cafeteria roenbergensis Fenchel & Patterson, 1988, and cf. Caecitellus (identified by light microscopy as Caecitellus parvulus Griessmann, 1913) (Patterson et al. 1993). These 5 morphospecies are widely distributed heterotrophic flagellates be- longing to the 20 most common flagellate species world-wide (Patterson & Lee 2000).
We compared the SSU rDNA from strains recovered from the deep sea with the SSU rDNA from strains recovered from surface waters.
Materials and Methods
Organism collection
All species were collected in July 2000 during the expedition with R/V “Meteor”
(Cruise 48, leg 1; Expedition DIVA 1) in the oligotrophic South Atlantic, Angola Basin
(a detailed overview is given in Table 1.1). They were collected from surface waters and
from multicorer samples from depth between 5300 and 5500 m. Salinity was about
37 h and temperature was 17 °C at the surface and 2.5 °C in the deep sea. Plankton
samples were taken from the surface by a water sampler. On deck, the samples were
immediately filled into sterile 50 ml tissue flasks (Sarstedt). Benthos samples were taken
by means of a multiple corer system (MUC). Only cores with undisturbed sediment and
overlying water were used for sampling. The top and the bottom of corers were closed
after sampling at the relevant depth. In addition, large sediment particles (max. 1 cm
3)
were incubated for cultivation. The possibility of contamination during the transport
through the water column was checked with “blind” samples (autoclaved material ex-
posed with the sampling device during the whole sampling procedure), and displayed
negative results in all cases (n = 10). On deck, sterile plastic syringes were used to fill
organisms into sterile 50 ml tissue culture flasks (Sarstedt) and diluted 1:3 with au-
toclaved artificial sea water (35 h : 28.15 g NaCl, 0.67 g KCl, 5.51 g MgCl
2· 6H
2O,
Table 1.1: Location and depth of collection of all species studied, with accession numbers for GenBank. Species sequenced in this study are in bold.
Species name Accession No. Sample location
Amastigomonas debruynei AY827842 18°19.5’S 4°43.0’E, -2 m, Angola Basin, South Atlantic Ocean
Amastigomonas debruynei AY827841 Sediment, 18°25.3’S 4°44.0’E, -5392 m, Angola Basin, South Atlantic Ocean Amastigomonas debruynei AY050180 Sargasso Sea, -2500 m, Atlantic Ocean
Ancyromonas sigmoides AY827845 Sediment, 17°11.6’S 4°45.9’E, -5415 m, Angola Basin, South Atlantic Ocean Ancyromonas sigmoides AY827844 Sediment, 18°19.5’S 4°43.0’E, -5392 m, Angola Basin, South Atlantic Ocean Ancyromonas sigmoides AY827843 Brackish water, Baltic Sea near Hiddensee, Germany
Ancyromonas sigmoides AY827846 79°07.27’N 4°07.95’E, -1804 m, North Atlantic Ocean
Ancyromonas sigmoides AF174363 ATCC50267, box core sediment sample, Hudson Canyon, Atlantic Ocean Ancyromonas sigmoides AF053088 ATCC50267, box core sediment sample, Hudson Canyon, Atlantic Ocean Caecitellus parvulus AY827848 Sediment, 19°06.9’S 3°52.0’E, -5423 m, Angola Basin, South Atlantic Ocean Caecitellus parvulus AY827847 Sediment, 19°17.4’S 3°52.2’E, -5424 m, Angola Basin, South Atlantic Ocean Caecitellus parvulus AF174368 New Bedford Harbour, -3 m, Massachusetts, USA
Caecitellus parvulus AF174367 9°N East walls mussels bed, -2500 m, East Pacific Rise, Pacific Ocean Cafeteria roenbergensis L27633 Trondheim Fjord, -3 m, Norway
Cafeteria roenbergensis AY827851 17°04.9’S 4°40.8’E, -1 m, Angola Basin, South Atlantic Ocean
Cafeteria roenbergensis AY827850 Sediment, 16°23.1’S 5°27.0’E -5388 m, Angola Basin, South Atlantic Ocean Cafeteria roenbergensis AY827849 Brackish water, Baltic Sea near Hiddensee, Germany
Cafeteria roenbergensis AF174364 9°N vent water, H2S reactors, -2500 m, East Pacific Rise
Rhynchomonas nasuta AY827855 Sediment, 79°04.26’N 4°09.12’E, -2414 m, North Atlantic Ocean Rhynchomonas nasuta AY827854 Sediment, 18°19.5’S 4°43.0’E, -5414 m, Angola Basin, South Atlantic Rhynchomonas nasuta AY827853 Sediment, 19°19.8’S 3°55.6’E, -5425 m, Angola Basin, South Atlantic Rhynchomonas nasuta AY827852 19°06.9’S 3°52.0’E, -1 m, Angola Basin, South Atlantic
Rhynchomonas nasuta AF174378 9°N Biovent serpulid zone, -2500 m, East Pacific Rise, Pacific Ocean Rhynchomonas nasuta AF174377 9°N Chesapeake Bay, -1 m, East Pacific Rise, Pacific Ocean
1.45 g CaCl
22 · H
2O, 6.92 g MgSO
4· 7H
2O, 0.1 g KNO
3, 0.01 g K
2HPO
4· 3H
2O · l
-1).
In the laboratory, clonal cultures were established under sterile conditions both from surface water and from sediments using the serial dilution method and kept in culture at 10 °C in artificial seawater with sterilised wheat grains at 1 atm. Experiments with deep-sea protists indicated that several organisms can be cultivated under normal at- mospheric pressure (Patterson et al. 1993, Atkins et al. 2000, Arndt et al. 2003).
Additional strains of Ancyromonas sigmoides (AY827843) and Cafeteria roenbergensis (AY827849) were isolated from shallow waters in the Southern Baltic Sea near Kloster (Island Hiddensee, Germany). We isolated 2 additional deep-sea strains from the North Atlantic (Rhynchomonas nasuta AY827855 and A. sigmoides AY827846) from samples collected in a similar way as described above. Isolated cells were identified to the species level using light microscopy following descriptions of the respective species. All strains sequenced in this study and all sequences retrieved from GenBANK are referred to by their GenBANK accession numbers.
DNA isolation and sequencing
The cultured isolates were grown to high densities (10
4–10
6cells · ml
-1) and harvested by centrifugation. Collected cells were lysed and their DNA was isolated using a modi- fied Kavenoff-Zimm procedure (Kavenoff & Zimm 1973, Steinbrück & Schlegel 1983).
The entire SSU rDNA gene was amplified by PCR using general eukaryotic specific SSU
rDNA primers (Table 1.2). Typical 50 µl PCR reaction conditions comprised 0.1 µM
of each primer, 200 µM dNTPs, up to 100 ng genomic DNA, 1.5 mM MgCl
2, 1× re-
action buffer and 1 U AmpliTaq DNA polymerase (Applied Biosystems). PCR was
Table 1.2: External and internal SSU rDNA primers used in this study.
Primer 5
′–sequence–3
′18Sfor-Bodo
aCTG GTT GAT TCT GCC AGT AGT
18Srev-Bodo
aTGA TCC AGC TGC AGG TTC ACC
Kin-500for
bGAT TCC GGA GAG GGA GCC
Kin-500rev
bCTC TCC GGA ATC GAA CCC
Kin-740for
bTGT TAA AGG GTT CGT AGT TG
Kin-740rev
bTCA ACT ACG AAC CCT TTA AC
Kin-1220for
bGAC GAA CTA CAG CGA AGG C
Kin-1240rev
bGCC TTC GCT GTA GTT CGT C
Kin-1700for
bTGG TCG GTG GAG TGA TTT G
Kin-1720rev
bAAC AAA TCA CTC CAC CGA C
18Sfor
c,dAAC CTG GTT GAT CCT GCC AGT
18Srev
cTGA TCC TTC CGC AGG TTC ACC TAC
18Sfor-590¤
eCGG TAA TTC CAG CTC CAA TAG C
18Srev-600¤
eGCT ATT GGA GCT GGA ATT ACC G
18Sfor-900i¤
eATT AAT AGG GAC AGT TGG GGG
18Sfor-1280¤
eTGC ATG GCC GTT CTT AGT TGG TG
18Srev-1300¤
eCAC CAA CTA AGA ACG GCC ATG C
400for
dAGA ATT AGG GTT CGA TTC CGG
450rev
dTAT TTC TTG TCA CTA CCT CCC
900for
dATT AAT AGG GAC AGT TGG GGG
1000rev
dGAT TAA TGA AAA CAT CCT TGG
1350for
dATT CCG ATA ACG AAC GAG ACC
1450rev
dATC ACA GAC CTG TTA TTG CC
a
External primers used for Rhynchomonas nasuta
bInternal primers used for R. nasuta
cEx-
ternal primers used for Ancyromonas sigmoides, Amastigomonas debruynei, Cafeteria roenber-
gensis and Caecitellus parvulus
dInternal primers used for C. roenbergensis and C. parvulus
eInternal primers used for A. sigmoides and A. debruynei
started with an initial denaturation step at 97 °C for 5 min after which the polymerase was added, followed by 35 cycles of 94 °C for 30 s, 56 °C for 45 s and 72 °C for 2 min PCR products were purified with the Rapid PCR Purification System from Marligen Biosciences (BIOCAT). Cycle sequencing was carried out with the BigDye Terminator Cycle Sequencing Kit V 3.1 from Applied Biosystems. Cycle sequencing reactions were purified with AutoSeq G-50 columns from Amersham Biosciences and sequenced on an ABI 3100 Automated Sequencer. All these steps were performed following the manu- facturer’s protocols.
Phylogenetic analysis
Determined sequence fragments were assembled manually and aligned together with other sequences retrieved from GenBANK/EMBL using the ClustalX multiple alignment program (Thompson et al. 1994). Uncorrected genetic distances (p-distances) were calculated using the programme PAUP Version 4.0b (Swofford 2000). Phylogenetic analyses were carried out by the distance matrix (neighbour joining, NJ) method (Saitou
& Nei 1987), the maximum parsimony (MP) method (Swofford & Olsen 1990) and the maximum likelihood (ML) method (Felsenstein 1981). The HKY85 (Hasegawa et al. 1985) model of nucleotide substitution was chosen for the NJ and ML analyses.
The reliability of internal branches was assessed by bootstrapping (Felsenstein 1985) with 100 resamplings.
Results
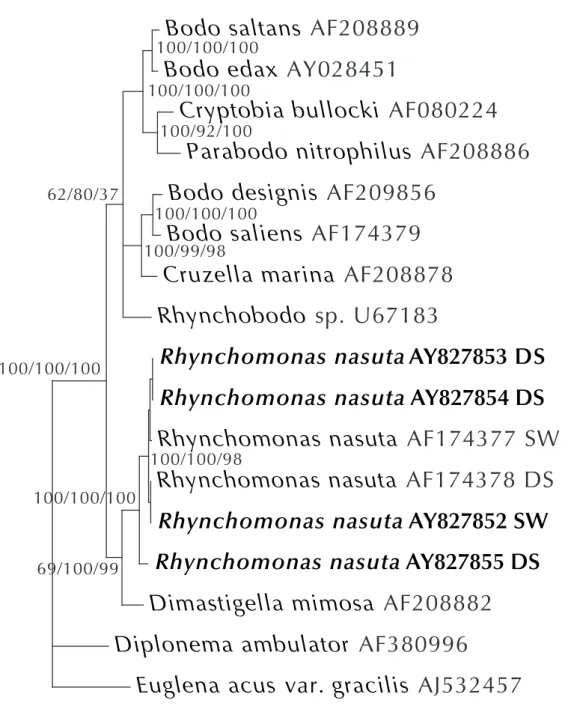
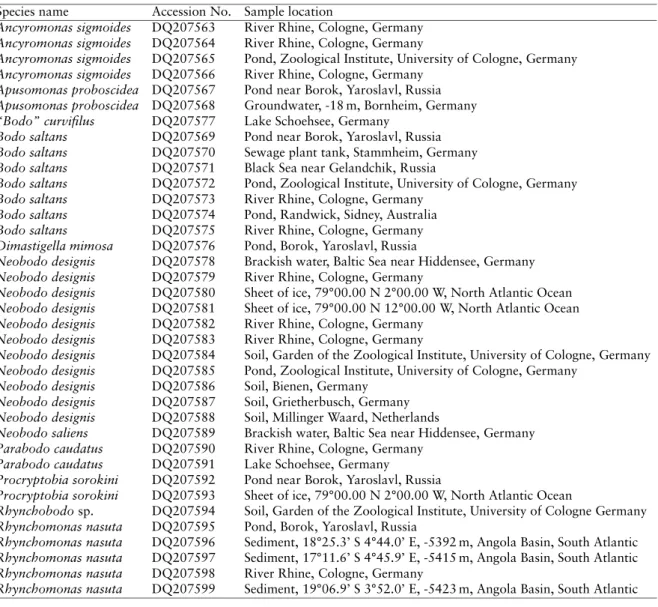
Analysis of the complete SSU rDNA sequences conducted by NJ and ML methods ap- plying the HKY85 model (Hasegawa et al. 1985), and by MP yielded principally iden- tical phylogenetic trees. In the phylogenetic tree of Bodonidae (Fig. 1.1), all strains of Rhynchomonas nasuta formed a very well supported monophyletic clade. The branch- ing order of most strains of R. nasuta was not well resolved. Only sequence AY827855 branched off just below the cluster comprising all other isolates of R. nasuta, indi- cated a close relationship of the different strains of R. nasuta. Besides the 2 deep-sea strains from the South Atlantic (AY827853 and AY827854) that were sequenced in this study, 2 other sequences (GenBANK) that had been isolated from different geographi- cal locations (South Atlantic and Pacific) and habitats (surface water and hydrothermal vents) were nearly identical (AY827852 and AF174378; Table 1.3). As indicated by the branching order (Fig. 1.1), sequence AY827855 was genetically highly distant from other strains of R. nasuta, with distances ranging from 5.95 up to 6.30 %. Sequence AY827855 had an intron of 478 bases in a highly conserved region of the SSU, starting at Position 453. This region was excluded from phylogenetic studies and did not occur in any other strain of R. nasuta. All other distances calculated were relatively low (1.5 to 1.8 %).
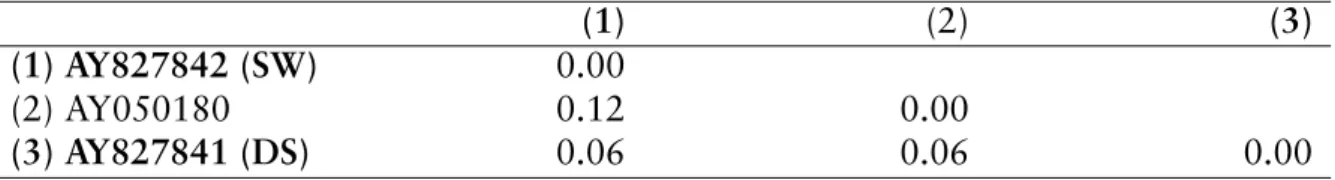
All strains of Amastigomonas debruynei formed a clade with high bootstrap support
(Fig. 1.2). According to the genetic distances of SSU rDNA, all 3 strains of A. debruynei
(from deep sea and surface water of South Atlantic, and the deep sea of Sargasso Sea)
Table 1.3: Rhynchomonas nasuta. Uncorrected genetic distances (p-distances) (%) of pairwise sequence comparison. Strains sequenced in this study are in bold. All sequences are referred to by their GenBank accession numbers (see Table 1.1 for collection details). DS:
strains isolated from deep sea; SW: strains isolated from surface water.
(1) (2) (3) (4) (5) (6)
(1) AY827853 (DS) 0.00
(2) AY827854 (DS) 0.00 0.00
(3) AF174378 1.75 1.75 0.00
(4) AY827852 (SW) 1.80 1.80 0.05 0.00
(5) AF174377 1.30 1.30 1.50 1.55 0.00
(6) AY827855 (DS) 6.30 6.30 6.15 6.20 5.95 0.00
were nearly identical, with a maximum genetic distance of 0.12 % (Table 1.4). The iso- lates of Ancyromonas sigmoides formed a monophylum divided into 2 sister groups, one composed of both sequences retrieved from GenBANK, the other of the 4 sequences obtained in this study. The 2 deep-sea strains of A. sigmoides from the South Atlantic (AY827844 and AY827845) were identical (Table 1.5), as had been shown for R. na- suta. Pairs of sequences retrieved from GenBANK that had been isolated from different geographical regions (North Atlantic deep sea and Baltic Sea) were also nearly iden- tical. The genetic distance between both closely related pairs of sequences obtained in this study was relatively low (1.98 %) compared to the distance between our 4 se- quences and both sequences retrieved from GenBANK (9.41 to 10.05 %).
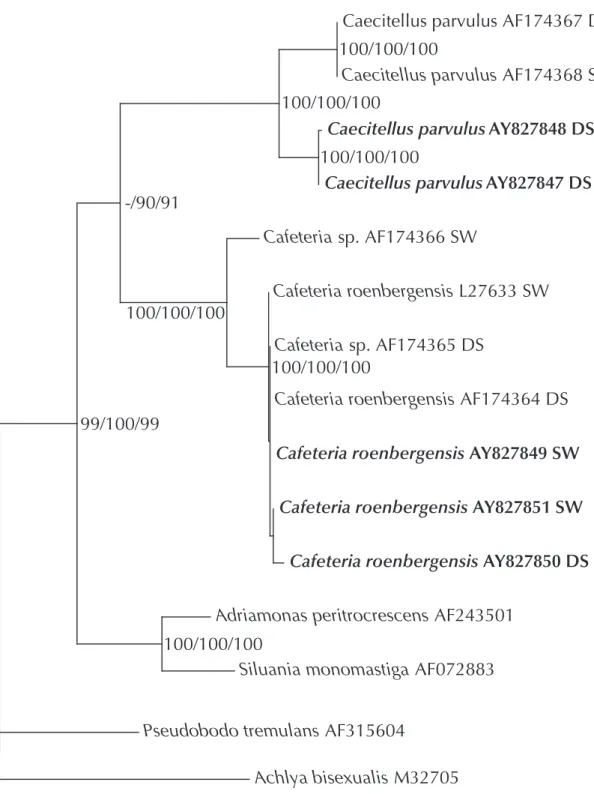
Like the other species considered so far, all sequences of Cafeteria roenbergensis (and Cafeteria sp.) formed a monophyletic clade with high bootstrap support (Fig. 1.3).
In contrast to Cafeteria sp. sequence AF174365, Cafeteria sp. AF174366 not only branched below the cluster comprising all other sequences of Cafeteria with high boot- strap support, but was also genetically highly distant from the other sequences, with a maximum of 2.63 % (Table 1.6). As within the other species considered, identical or nearly identical sequences were found over great geographic distances and within very different habitats from the Pacific, the South Atlantic, North America and the Baltic Sea.
Table 1.4: Amastigomonas debruynei. Uncorrected p-distances (%) of pairwise sequence com- parison. Notation as in Table 1.3.
(1) (2) (3)
(1) AY827842 (SW) 0.00
(2) AY050180 0.12 0.00
(3) AY827841 (DS) 0.06 0.06 0.00
Table 1.5: Ancyromonas sigmoides. Uncorrected p-distances (%) of pairwise sequence com- parison. Notation as in Table 1.3.
(1) (2) (3) (4) (5) (6)
(1) AY82744 (DS) 0.00
(2) AY827845 (DS) 0.00 0.00
(3) AY827846 (DS) 0.98 1.98 0.00
(4) AY827843 (SW) 1.98 1.98 0.00 0.00
(5) AF053088 9.41 9.41 9.82 9.82 0.00
(6) AF174363 (DS) 9.65 9.65 10.05 10.05 0.64 0.00
Table 1.6: Cafeteria spp. Uncorrected p-distances (%) of pairwise sequence comparison. No- tation as in Table 1.3.
(1) (2) (3) (4) (5) (6) (7)
(1) AF174365 (DS) 0.00
(2) AY827849 (SW) 0.00 0.00
(3) AF174364 (DS) 0.00 0.00 0.00
(4) AY827851 (SW) 0.06 0.06 0.06 0.00
(5) AY827850 (DS) 0.31 0.31 0.31 0.25 0.00
(6) L27633 (SW) 0.06 0.06 0.06 0.13 0.38 0.00
(7) AF174366 (SW) 2.44 2.44 2.44 2.50 2.63 2.38 0.00
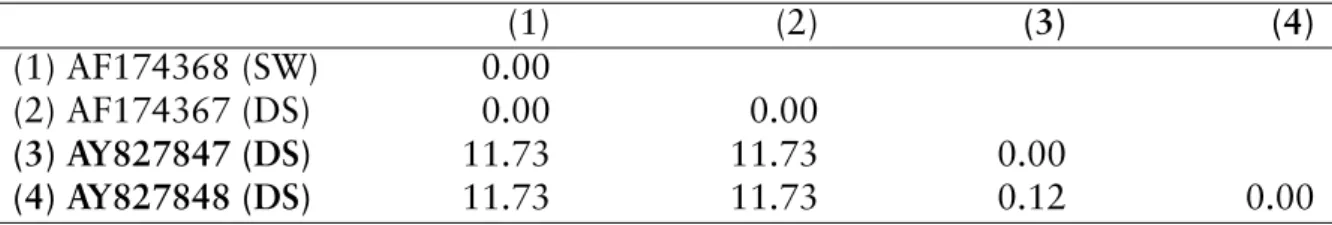
Both pairs of sequences of the genus Caecitellus were separated by very high genetic distances (11.73 %, Table 1.7) as has been found within the genus Ancyromonas sig- moides. As determined for Rhynchomonas nasuta and Ancyromonas sigmoides, both strains isolated from the South Atlantic deep sea were identical.
Discussion
This study has shown that an exchange of flagellate populations between the upper parts of the water column and the deep sea may occur. At least some widely dis- tributed flagellates such as Amastigomonas debruynei or Cafeteria roenbergensis, and some genotypes of other cosmopolitan heterotrophic flagellated morphospecies (Rhyn-
Table 1.7: Caecitellus parvulus. Uncorrected p-distances (%) of pairwise sequence compari- son. Notation as in Table 1.3.
(1) (2) (3) (4)
(1) AF174368 (SW) 0.00
(2) AF174367 (DS) 0.00 0.00
(3) AY827847 (DS) 11.73 11.73 0.00
(4) AY827848 (DS) 11.73 11.73 0.12 0.00
Bodo saltans Bodo edax
Cryptobia bullocki Parabodo nitrophilus Bodo designis
Bodo saliens Cruzella marina Rhynchobodo
Rhynchomonas nasuta AY827853 DS Rhynchomonas nasuta AY827854 DS Rhynchomonas nasuta
Rhynchomonas nasuta
Rhynchomonas nasuta AY827852 SW Rhynchomonas nasuta AY827855 DS
Dimastigella mimosa Diplonema ambulator
Euglena acus var. gracilis
1 substitution per position
Figure 1.1: Phylogenetic tree of Bodonidæ using NJ (neighbour joining), MP (maximum par- simony) and ML (maximum likelihood) methods. Numbers on the left are support values for the NJ tree, those in the middle for the ML tree, and those on the right for the MP tree (i. e. NJ/ML/MP). Tree was rooted using Diplonema ambulator and Euglena acus var. gracilis as outgroups. Organisms sequenced in this study are in bold. All sequences are referred to by their GenBank accession numbers. DS: strains isolated from deep sea;
SW: strains isolated from surface water. The number of informative sites for ML and MP
analysis was 1050 and 787, respectively.
Amastigomonas debruynei AY827842 SW Amastigomonas debruynei AY827841 DS
Amastigomonas debruynei AY050180 DS Amastigomonas bermudensis
Apusomonas proboscidea Amastigomonas mutabilis
Amastigomonas Amastigomonas
Ancyromonas sigmoides Ancyromonas sigmoides
Ancyromonas sigmoides AY827846 DS Ancyromonas sigmoides AY827843 SW Ancyromonas sigmoides AY827844 DS Ancyromonas sigmoides AY827845 DS
Dictyostelium discoideum
100/100/100
1 substitution per position