High-frequency impact ionization and nonlinearity of photocurrent induced by intense terahertz radiation in HgTe-based quantum well structures
S. Hubmann,1S. Gebert,1G. V. Budkin,2V. V. Bel’kov,2E. L. Ivchenko,2A. P. Dmitriev,2S. Baumann,1M. Otteneder,1 J. Ziegler,1D. Disterheft,1D. A. Kozlov,3N. N. Mikhailov,3S. A. Dvoretsky,3Z. D. Kvon,3D. Weiss,1and S. D. Ganichev1
1Terahertz Center, University of Regensburg, 93040 Regensburg, Germany
2Ioffe Institute, 194021 St. Petersburg, Russia
3Rzhanov Institute of Semiconductor Physics, 630090 Novosibirsk, Russia
(Received 4 December 2018; published 28 February 2019)
We report on a strong nonlinear behavior of the photogalvanics and photoconductivity under excitation of HgTe quantum wells (QWs) by intense terahertz (THz) radiation. The increasing radiation intensity causes an inversion of the sign of the photocurrent and transition to its superlinear dependence on the intensity. The photoconductivity also shows a superlinear raise with the intensity. We show that the observed photoresponse nonlinearities are caused by the band-to-bandlightimpact ionization under conditions of a photon energy less than the forbidden gap. The signature of this kind of impact ionization is that the angular radiation frequency ω=2πfis much higher than the reciprocal momentum relaxation time. Thus the impact ionization takes place solely because of collisions in the presence of a high-frequency electric field. The effect has been measured on narrow HgTe/CdTe QWs of 5.7 nm width; the nonlinearity is detected for linearly and circularly polarized THz radiation with different frequencies ranging from f =0.6 to 1.07 THz and intensities up to hundreds of kW/cm2. We demonstrate that the probability of the impact ionization is proportional to the exponential function, exp(−E02/E2), of the radiation electric field amplitudeEand the characteristic field parameterE0. The effect is observable in a wide temperature range from 4.2 to 90 K, with the characteristic field increasing with rising temperature.
DOI:10.1103/PhysRevB.99.085312
I. INTRODUCTION
With the emergence of high-power pulsed terahertz (THz) sources such as molecular lasers, free-electron lasers, and few-cycle difference-frequency based terahertz systems there has been a surge in studies of intense terahertz excitations of semiconductors, see, e.g., Refs. [1–9]. High-intensity electro- magnetic radiation of the terahertz range gives rise to a variety of novel nonlinear phenomena whose characteristic features are basically different from the corresponding effects at mi- crowave frequencies as well as for the visible light. In particu- lar, high electric or magnetic fields of the THz radiation allow one a direct access to a number of low-energy elementary excitations such as phonons, plasma oscillations, spin waves, etc. or can drive the system into a nonperturbative regime of light-matter interaction. Moreover, the latest advances in ter- ahertz technology made it possible to study nonlinear optical and optoelectronic phenomena on the femtosecond timescale with subcycle time resolution. Broadly speaking, experiments with powerful THz laser sources have potential to define limits of existing high-frequency electronics, where the radiation field has a classical amplitude, and uncover new approaches in the development and application of future electronics at these frequencies.
The intense THz radiation can be used to convert topo- logically trivial HgTe QWs into a nontrivial 2D Floquet topological insulator as suggested theoretically by Lindner et al. [10]. This would result in an appearance of chiral edge states which can be proved via the generation of edge
photocurrents induced by circularly polarized THz radiation.
The latter has recently been demonstrated in Ref. [11] study- ing 2D topological insulators based on HgTe QW of 8 nm width with inverted band ordering [12,13]. Being inspired by Ref. [10], we have investigated photoresponses in 5.7-nm- thick QWs excited by monochromatic intense THz radiation under the conditions suggested in that work. By examining the intensity dependence of the photogalvanic current, we have observed a strong nonlinearity resulting in a current sign inversion with increasing the radiation intensityIfrom a frac- tion of W/cm2 up to hundreds of kW/cm2and a superlinear behavior at high power.
Further investigation and analysis have demonstrated, how- ever, that the observed effect is caused by the light impact ionization [14]. This phenomenon is shown to cause the generation of electron-hole pairs by radiation with photon energy considerably smaller than the forbidden gap under the condition where the radiation angular frequency ω exceeds the reciprocal momentum relaxation time τ−1. Under this condition, the charge carriers acquire high energies solely because of collisions in the presence of a high-frequency electric field [1,14,15]. Being primarily observed in bulk InSb crystals this effect was further demonstrated for very different three- and two-dimensional semiconductor systems [16–23].
A distinction of the light impact ionization reported in the present work is that it occurs in a system with the Fermi level larger than the forbidden gap. Thus, in contrast to all the previous works, the electron gas heating is needed in order to deplete the occupied states in the region of the
conduction-band bottom rather than to increase the number of hot electrons with high energies exceeding the energy gap. As shown below, the experiments and theoretical anal- ysis demonstrate that in our study the probability of impact ionization is proportional to exp(−E02/E2), where E is the radiation electric field amplitude andE0 is the characteristic field parameter. This dependence has been also confirmed by experiments on the THz radiation-induced photoconductivity showing that, in line with the theory, the characteristic fieldE0 is proportional to the radiation frequencyω. Lastly, we show that the observed nonlinearity in the photocurrent is caused by the interplay of the photogalvanic effect excited in the conduction and valence bands.
II. SAMPLES AND METHODS
The nonlinear phenomena described here were studied in HgTe/HgCdTe QWs grown on (013)-oriented GaAs substrates by molecular beam epitaxy [24]. We used quantum wells with two barriers made of Hg0.4Cd0.6Te, each 30 nm thick. The width of the used QWs wasd =5.7 nm yielding a noninverted parabolic energy spectrum [12]. The structures have been grown on 4-μm-thick CdTe layers, which completely relax an initial strain caused by the lattice mismatch with the GaAs substrate. We used van-der-Pauw sample geometry with a size of 5×5 mm2. To measure the photoresponse, six Ohmic contacts, four at the corners and two at the middle of opposite edges, have been fabricated. Besides the van-der-Pauw sam- ples we fabricated Hall bar structures with a semitransparent gate. These structures were used to study dependence of the nonlinear photoresponse on the Fermi energy level position.
The 200-μm-wide and 450-μm-long Hall bars were pat- terned with photolithography and a Br-based wet etch pro- cess [25]. They are covered by an insulating oxide and a Ti/Au top gate electrode. The oxide layer consists of 30-nm SiO2and 100-nm Al2O3.
Additionally, Hall bar structures with a size of 6×50μm have been prepared and used for magnetotransport measure- ments. From the latter measurements we obtained mobil- ity μ and carrier density n at T =4.2 K being μ=2.5× 104cm2V−1s−1andn=3×1011cm−2, respectively.
For optical excitation we used a high-power pulsed molec- ular gas THz laser [26–28] optically pumped by a tunable CO2
laser [29]. Using CH3F, D2O, and NH3as active media, laser radiation with frequencies of 0.6, 0.77, and 1.07 THz ( ¯hω= 2.5, 3.2, and 4.4 meV) were obtained. The laser operated in single pulse regime with a pulse duration of about 100 ns and a repetition frequency of 1 Hz. The radiation power P has been measured by a fast room temperature photon drag detector made of n-type Ge crystals [30]. The laser beam had an almost Gaussian shape as measured by a pyroelectric camera [31]. The radiation was focused by a parabolic mirror to a spot diameter of about 2.5 mm being smaller than the sample size. This allowed us to distinctly illuminate the edges or the center of the sample. In the following, the latter case is referred to as “bulk.” The highest peak intensities obtained for these frequencies were 60, 80, and 200 kW/cm2, respectively.
Note that in the used laser the intensity varies from pulse to pulse by about 15%. The samples were placed in either an optical cold finger cryostat with TPX windows or an optical
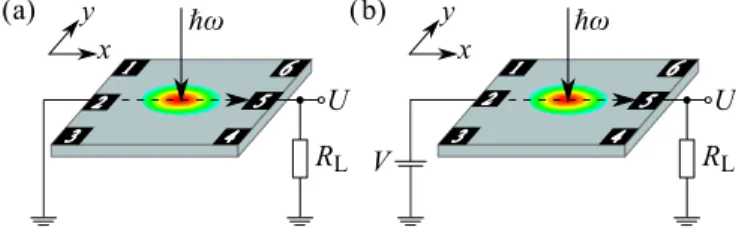
FIG. 1. (a) Setup scheme for a photocurrent measurement be- tween contacts 2 and 5. The current is measured as a voltage drop U across a load resistor. (b) Setup scheme for a photoconductivity measurement between contacts 2 and 5. The signal is measured as a voltage dropU along a load resistorRL, while a bias voltageV is applied.
temperature-regulated continuous flow cryostat with quartz windows. While in the former case we were able to obtain the highest level of radiation intensity at highest frequencies used in the work, in the latter case we studied the temperature dependence of the nonlinear response at the lowest frequency.
The measurement have been carried out in the temperature range fromT =4.2 to 90 K. In all measurements the samples were illuminated at normal incidence, see Fig.1.
To vary the laser radiation intensity, we used either cal- ibrated attenuators or crossed polarizers. In the latter case, the linearly polarized laser radiation first passed through the wire grating polarizer. Rotation of this polarizer resulted in the decrease of the radiation intensity and the rotation of polarization state. The second polarizer, being at a fixed position, causes a further decrease of the radiation intensity and ensured that the radiation is always equally polarized.
By this method, we obtained a controllable variation of the radiation intensity. To modify the radiation polarization state, crystal quartz quarter-wave plates were used. Rotating the plate by the angleϕwith respect to the laser polarization along thexaxis, we changed the degree of circular polarizationPcirc
according to
Pcirc=sin 2ϕ, (1)
and two other Stokes parameters PL and ˜PL, defined as the degrees of linear polarization in the axesx,yand the axesx,y rotated by 45◦, according to [32]
PL= cos(4ϕ)+1
2 , P˜L= sin(4ϕ)
2 . (2)
Photocurrent and photoconductivity studied in this work have been measured using the setups shown in Figs. 1(a) and 1(b), respectively. The photocurrent was measured in unbiasedsamples via a voltage dropU across a load resistor RL amplified by a voltage amplifier and detected by a digital broad-band oscilloscope. The dc photoconductivity was mea- sured applying a bias voltageV =0.3 V, see Fig.1(b). This voltage was applied either as a dc voltage or as a pulsed bias with a pulse length much longer than the laser pulse, so that the voltage bias is in a “quasi-dc” regime with respect to the laser pulse. By subtracting the signals detected for positive and negative polarities of the bias, the photoconductivity signal was extracted. From this signal, the relative change of the conductivityσ/σ has been calculated.
FIG. 2. (a) Reference laser pulse shape over time in arbitrary units. The signal is measured by the fast room temperature photon drag detector [30]. [(b)–(f)] Time variation of the photocurrent response excited by the illumination of the sample bulk with right- handed circularly polarized radiation at different intensities with a frequency of f =0.6 THz and measured diagonally between contacts 3 and 6. At low intensities, the current response follows the reference pulse with a negative amplitude, while at the higher inten- sities a nonlinear positive contribution is observed, which results in a change of sign of the photocurrent at approximately 10 kW/cm2.
III. RESULTS A. Photocurrent
We firstly describe the results of the photocurrent measure- ments. Illuminating the edges or the bulk of the HgTe QWs with linearly or circularly polarized radiation we observed complex dynamics of the photoresponse at high radiation intensities. Figure2demonstrates an example of the genesis of the photoresponse with rising intensity detected for right- handed circularly polarized radiation with f =0.6 THz. At relatively low incident intensities, the signal pulse is negative for any moment in time and its temporal shape repeats that of the reference laser pulse, Figs.2(b)and2(a), respectively.
As the intensity is increased, the signal dynamic changes.
Now, at first the negative signal amplitude increases, but then it rapidly drops to zero at the maximum of the excitation pulse (t =tmax), rises again and finally vanishes following the excitation pulse, see Fig.2(c). On further increasing the intensity, the photosignal changes its sign at some valueIinv
and becomes positive at the maximum of the excitation pulse.
At even higher intensities, the positive part of the signal pulse dominates the photoresponse, Figs.2(d)–2(f). The com- plicated temporal structure of the signal can be understood assuming that it emerges simply due to the change of sign of the photocurrent as a function of radiation intensity. On this assumption, at the rising edge of the laser pulse, the
FIG. 3. (a) The intensity dependences of the edge photocurrent excited by right-handed (open circles) and left-handed (full circles) circularly polarized radiation with a frequency of f =0.6 THz. The signal was picked up from contacts 1 and 6 under illumination of the corresponding sample edge. The change of sign and the nonlinear raise of the photocurrent is clearly seen, while there is no differ- ence within the measuring accuracy between signals for the left- and right-handed excitation polarizations. (b) Dependencies of the photocurrent at the edge (blue, picked up from contacts 1 and 6) and in the sample bulk (red, picked up from contacts 2 and 5) excited by linearly polarized radiation with a frequency of f=0.6 THz on the intensityI. (c) Dependence of the photocurrent induced in the sample bulk on the quarter-wave plate angle ϕ measured at the intensity of I=6.5 kW/cm2 for the radiation frequency of f =0.6 THz.
The solid line shows a fit after Eq. (3) with the fitting parameters J0= −1.0μA,J1= −1.1μA,J2= −0.3μA, andJ3=0.1μA.
intensity increase upon time causes the dynamic inversion of the photoresponse, whereas at the falling pulse edge, the inten- sity decreases and the signal dynamic mirrors. Consequently, the peak of the photocurrent occurs at the timetmaxof the laser intensity maximum.
Figure3shows the intensity dependence of the photocur- rent measured at timet =tmax. The open and full circles in Fig. 3(a) are obtained for illumination of the sample edge by circularly polarized radiation with opposite helicities. The data reveal almost no difference in the behavior of the pho- tocurrents excited by the σ+ andσ− polarizations: the both dependences show the inversion of sign at the intensity of aboutIinvC =15 kW/cm2. The independence of the radiation helicity is additionally confirmed by studying the current variation with the phase angleϕ(not shown). Similar intensity dependence, but with the higher value ofIinvL ≈25 kW/cm2, has been observed for excitation with linearly polarized radi- ation, empty squares in Fig.3(b). Studying the photoresponse in a wide temperature range from 4 to 90 K, we observed
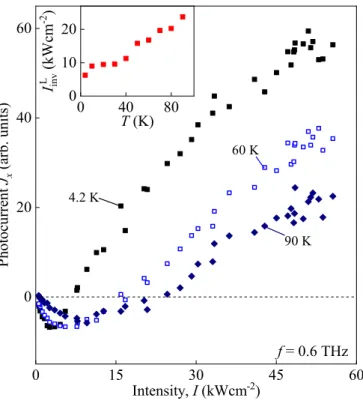
FIG. 4. Intensity dependencies of the photocurrent excited by linearly polarized radiation with a frequency of f =0.6 THz for the temperatures ofT =4.2, 60, and 90 K. The signal was picked up from contacts 2 and 5 under illumination of the sample bulk. The inset shows the temperature dependence of the inversion intensity IinvL , which shifts to higher intensities at higher temperatures.
that qualitatively the nonlinear behavior remains the same, see Fig.4. The only difference is that the intensity of the sign inversion increases with increasing temperature.
The insensitivity of the photoresponse to the radiation helicity demonstrates that the nonlinear photocurrent is not caused by helical edge photocurrents as a consequence of a transition from topologically trivial to nontrivial phase. More- over, the current is not even generated at the sample edges:
shifting the beam spot into the sample bulk (illumination of the sample center) and measuring the photocurrent across the sample we also observed the photocurrent sign change with rising the intensity. Figure3(b)shows the comparison of the photocurrent excited by linearly polarized radiation at the edge (blue empty squares) and in the sample bulk (red full squares). The data reveal no measurable difference between the sample bulk and edge results excluding edge mechanisms as a driving force for the observed nonlinear photocurrent.
In the following, we will present only the data obtained illuminating the bulk of the sample.
Furthermore, we have observed that switching of the radia- tion helicity from the right- to left-handed polarized radiation does not substantially affect the nonlinearity (not shown).
The photocurrent at low intensity is most likely caused by photogalvanic effects, well known for HgTe QWs [11,33].
This is supported by the polarization dependence detected at low intensities, see Fig.3(c), which is described well by
Jx=J0+J1(|ex|2− |ey|2)+J2Re(2e∗xey)+J3Pcirc
=J0+J1PL(ϕ)+J2P˜L(ϕ)+J3Pcirc(ϕ), (3)
FIG. 5. Dependencies of the normalized photoconductivity σ /σ excited by linearly polarized radiation in the bulk of the QW for the radiation frequencies of 0.6 (blue triangles), 0.77 (red trian- gles), and 1.07 THz (black triangles) on the intensityI. The signal is measured for contacts 2 and 5 using the setup shown in Fig.1(b).
Solid lines present the corresponding fits after Eq. (4) [see also theoretical Eq. (10)] with the fitting parametersAandI0. A nonlinear raise of the signal is clearly seen for all frequencies. Inset shows the kinetics for an exemplary photoconductivity pulse (solid line) measured in the bulk of the samples for linearly polarized radiation with a frequency of 0.6 THz and an intensity of 57 kW/cm2. The dashed line shows the reference laser pulse.
whereeis the polarization unit vector and the Stokes parame- ters are defined by Eqs. (1) and (2). The fitting parametersJ0, J1, andJ2 correspond to different contributions of the linear photogalvanic effect (LPGE) and the parameterJ3 describes the circular photogalvanic effect. Figure3(c)reveals that the photocurrent is dominated by the LPGE.
As we show below (Sec.IV) the observed strong nonlinear- ity resulting in the change of the direction of the photogalvanic current with rising intensity is caused by the generation of electron-hole pairs by the THz radiation as a result of light impact ionization. To study the rate of electron-hole pair generation, we have measured the THz radiation induced change of conductivityσ.
B. Photoconductivity
A positive photoconductivity response was detected for all measured frequencies. In contrast to the photocurrent, the photoconductivity response time is twice longer than the laser pulse, see inset in Fig.5. The observed increase of the sam- ple’s conductivity together with the photoresponse kinetics reveals that it is caused by the generation of electron-hole pairs, in spite of the fact that the photon energy is smaller than the band gap, ¯hω < εg. Note that the detected response times correspond to the recombination of electron-hole pairs known for HgTe QWs [34]. The characteristic intensity dependencies of the photoconductivity are shown in Fig.5for illumination of the sample bulk by linearly polarized radiation of differ- ent frequencies. Figure 6 shows the photoconductivity as a
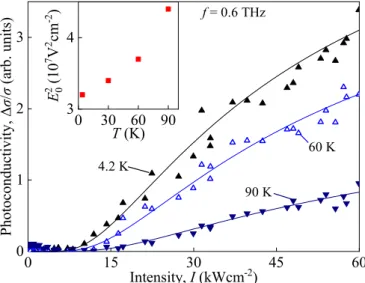
FIG. 6. Intensity dependences of the normalized photoconduc- tivity σ /σ excited by linearly polarized radiation with f = 0.6 THz in the bulk of the QW. The signal was measured for three temperatures ofT =4.2, 60, and 90 K for the contacts 2 and 5 using the setup shown in Fig.1(b). Solid lines show corresponding fits after Eq. (4) [see also theoretical Eq. (10)] with the fitting parameters A and I0. A nonlinear raise of the signal is clearly seen for all frequencies. Inset shows the temperature dependence of the fitting parameterE02∝I0.
function of the radiation intensity for the frequency of 0.6 THz and three temperatures in the range between 4 and 90 K.
The results clearly show a superlinear raise of the photo- conductive signal and reveal that the nonlinearity decreases with increasing the radiation frequency. The data can be well described by
σ
σ =Aexp
−E02 E2
=A·exp
−I0
I
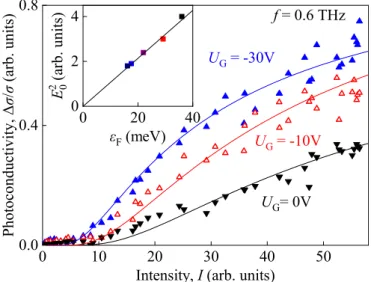
(4) with the prefactorAand the characteristic electric fieldE0as fitting parameters. Replotting the data in a half-logarithmic plot as a function of the inverse squared electric fieldE−2∝ I−1 we see that the above equation describes the data well, see Fig. 7(a). Extracting E0 from the slope of the fit lines we obtained that it changes according toE0∝ f, see inset in Fig. 7(b). We note that at low intensities and high fre- quencies a deviation from Eq. (4) occurs. This is attributed to a contribution of μ photoconductivity (bolometric pho- toresponse) [1]. Varying the Fermi energy by applying gate voltage in samples with a semitransparent gate we observed that reduction ofεFincreases the nonlinearity, see Fig.8. The inset in Fig. 8 shows the dependence of the characteristic electric fieldE0 on the Fermi level position. It demonstrates thatE0 almost linearly rises with the Fermi energy increase.
Note that in the studied samples up to the highest possible negative gate voltages, the conditionεFεgis satisfied.
To summarize the experimental part, we have shown that the intense terahertz excitation of HgTe QW structures results in a strongly nonlinear photoresponse which is caused by the generation of electron-hole pairs despite of the fact that the photon energy is substantially smaller than the energy gap. Electron-hole pair generation results (i) in a nonlinear
FIG. 7. Logarithmic plot of the relative photoconductivityσ /σ excited by linearly polarized radiation in the bulk of the sample on the inverse squared electric fieldE−2. Data are shown for the radiation frequencies of 0.6 (blue triangles), 0.77 (red triangles), and 1.07 THz (black triangles) and have been measured between the con- tacts 2 and 5. Solid lines present the corresponding fits after Eq. (4) [see also theoretical Eqs. (10) and (11).] with fitting parametersAand E02. Inset shows a dependence of the fitting parameterE02 extracted from the corresponding fits from panel (a) on the squared radiation frequencyf2.
photoconductivity, which scales as exp(−E02/E2) withE0∝ f, and (ii) in a sign inversion of the photogalvanic currents at high intensities. The fact that for smaller photon energies the nonlinearity is observed at substantially smaller radiation intensities, see Fig. 7, together with the lack of the linear- circular dichroism (not shown), excludes multiphoton pro- cesses as an origin of the nonlinearities. The observed electric field and frequency dependencies of the photoconductivity give a hint that the observed nonlinearity is caused by the light impact ionization, previously observed in bulk InSb and InAs-based materials [14,16,17,35].
IV. THEORY AND DISCUSSION
Now we discuss the microscopic origin of the observed nonlinear photoconductivity and photocurrent. We begin with the discussion of the band structure of the studied sam- ples which is required to understand the mechanism of the electron-hole pair generation. The band structure of 3D HgTe is related to the work of Groveset al.[36]. Here we calculate electron states and dispersion of the (013)-oriented 5.7-nm- thick HgTe QW in the eight-band model including the conduc- tion ( 6), valence ( 8), and spin-orbit split-off bands ( 7). The effectivek·pHamiltonian in the second-order Kane model, see, e.g., Ref. [37], is taken from Ref. [38]. Figure9shows the energy dispersion for three subbandsE1,H1, andH2. Here, at k=0, the|E1,±1/2quantum well subband state is formed from the linear combination of the| 6,±1/2and| 8,±1/2 states, while |H1 and |H2 states are the first and second levels of the size quantization of heavy holes, respectively.
Figure 9 reveals that the band gap in the studied QWs is
FIG. 8. Intensity dependencies of the normalized photoconduc- tivity σ /σ excited by linearly polarized radiation with f = 0.6 THz in the sample with semitransparent gate. Solid lines show corresponding fits after Eq. (4) [see also theoretical Eq. (10)] with the fitting parametersAandI0∝E02. Inset shows the dependence of the fitting parameterE02 on the Fermi energy. The latter has been obtained from the corresponding magnetotransport measurements.
Note that due to unknown intensity acting on 2DEG after transmis- sion through the gate all values are given in arbitrary units.
εg=17.6 meV. From magnetotransport measurements we ob- tained that the Fermi level isεF=54 meV, i.e., is substantially larger than the band gap.
A. Photoconductivity
In all previous works aimed to impact ionization, the typi- cal values of the electron energyεin the equilibrium state are much lower than the threshold energy of impact ionizationεi. Therefore, to achieve an appreciable rate of generation of the pairs, a sufficiently strong heating of the electron gas is
0
Ener gy , ε (meV)
100 50
-50
0 0.2 0.4
Electron wavevector, k (nm-1)
E1
H2 H1 17.6 meV
40.3 meV ε
F= 54 meV
FIG. 9. Calculated energy dispersion for a quantum well with a thickness of 5.7 nm using thek·pHamiltonian from Ref. [38]. Here, the band gap between the electron subband E1 (red) and the hole subband H1 (blue) isεg=17.6 meV. The dashed line indicates the Fermi level.
necessary, leading to an increase in the number of electrons with high energy.
In the samples studied here at rather high electron con- centrations, the Fermi energy εF exceeds εi already in the equilibrium. In our case εi is about half as much as εF. Thus the generation of pairs is limited not by the lack of electrons with high energy, but rather by the small number of unoccupied levels in the low-energy region. In such a situation, heating is needed in order to deplete the occupied levels in the region of relatively low energies.
We consider the dominant mechanisms of electron scatter- ing in the discussed polar HgTe crystals at low temperatures to be spontaneous emission of polar optical phonons with the energy ε0=hω¯ 0 and elastic scattering by point impurities with timeτi(ε). We also take into account that for the exper- iments discussed above the conditionωτ >1 is fulfilled. In- deed, from the width of the cyclotron resonance, we obtained ωτ ≈2 for the studied range of frequencies.
For a radiation electric field polarized along the x axis relevant to the experiment, the kinetic equation has the form
∂f(p,t)
∂t +eEcos(ωt)∂f(p,t)
∂px
= −f(p,t)−f0(ε,t)
τi(ε) −St−ph{f} +St+ph{f}. (5) Here, f(p,t) is the distribution function depending on elec- tron momentumpand timet,eis the electron charge,p(ε) and v(ε)=∂ε/∂pare the momentum and velocity of an electron with the energy ε; f0(ε,t) is the part of the distribution function that is independent of the direction of the electron momentum p; τi(ε)=τi0g(0)/g(ε), where τi0 is scattering time at the bottom of the conduction band [39,40]; g(ε)= p(ε)/v(ε)πh¯2is the density of states in the conduction band.
The combinationSt+ph{f} −St−ph{f}describes the collision integral due to interaction with optical phonons. Separately, St+ph{f}(St−ph{f}) describes the number of electrons entering (leaving) the state with momentumpin an unit of time due to emission of phonons.
For the considered dominant mechanisms of electron scat- tering, the distribution function f(p,t) is almost isotropic, i.e., f(p,t)= f0(ε)+ f1(p,t), where f1(p,t) is a small anisotropic correction. We assume that the electron gas heat- ing is sufficiently strong, so that the effective electron temper- ature exceeds the phonon energy and, therefore, the function f0(ε) only slightly changes on the energy scale of the order of ε0. By that forε > ε0, f0(ε) is given by the balance equation
D(ε)∂f0
∂ε + ε0
τph(ε)f0(ε)[1−f0(ε)]=0, D(ε)=e2E2v2(ε)
4ω2τi(ε) , 1
τph(ε) = 4πε0e2g(ε)
p(ε)¯ , (6) where 1/¯=1/∞−1/0; ∞ and 0 are high- and low- frequency dielectric permittivities; D(ε) is the diffusion co- efficient of electrons in the energy space, and τph(ε) is the characteristic time of phonon emission. The first term in Eq. (6) describes the heating of the electron gas by the electric field of the electromagnetic wave, whereas the second term corresponds to the energy losses due to emission of phonons.
The solution of Eq. (6) has the form f0(ε)= 1
1+exp[−L(ε)], L(ε)= εE
ε
ε0
D(ε)τph(ε)dε, (7) whereεE is determined fromn=∞
0 f0(ε)g(ε)dε, i.e., nor- malization by the densityn.
For the considered condition of a slowly changing function f0(ε) on the energy scale of the order ofε0, the value 1−f0(ε) also varies only slightly with energyε. Atf0(ε) close to unity, 1− f0(ε) is proportional to exp[−L(ε)]. The above condition is fulfilled for|L(ε+ε0)−L(ε)| 1, which as it follows from Eq. (7) is equivalent to ε20 Dτph. For the opposite inequality,ε < ε0, the distribution function obeys the equation
− 1 g(ε)
∂
∂ε
g(ε)D(ε)∂f0
∂ε
= 1
tph+(ε)f0(ε+ε0)[1−f0(ε)], (8) where f0(ε+ε0) is given by Eq. (6) and tph+ is given by Eq. (A12) in Appendix.
While it is not possible to solve this equation analytically, under the conditionsε02Dτphand f0(ε)≈1 relevant to the considerate case the right part of Eq. (8) becomes vanishingly small and, therefore, the distribution function in the region ε < ε0 can be considered as almost constant. It can be cal- culated from Eq. (7) taking into account ε=ε0. For a not so strong electron gas heating, so that the effective electron temperature is smaller than the Fermi energy, the distribution function is close to unity in the whole range of energies 0<
ε < εE. By contrast, at high energiesεεE, it approaches zero. Consequently one obtains thatn≈εE
0 g(ε)dε, which for εE yields the value equal to the Fermi energy in equi- librium. This is because for the degenerated electron gas the latter is determined by the same integral.
The ionization rate is determined, as stated before, by the number of unoccupied levels in the low-energy region, i.e., by 1−f0(ε)≈exp[−L(ε)]. The exact value of the lower limit of integration in the expression for L(ε) depends on the characteristics of the elementary act of impact ionization unknown to us, and therefore we shall consider it to be an adjustable parameter ε∗. Subsequently, field and frequency dependencies of the number of generated pairs are determined by the exponent exp[−L∗], where
L∗= εF
ε∗
ε0
D(ε)tph(ε)dε. (9) Within the Bernevig-Hughes-Zhang model [12], the en- ergy is described byε(p)=√
εg2/4+p2εg/2m−εg/2, which yields g(ε)=m(2ε+εg)/πh¯2εg, p(ε)=√
2mε(ε+εg)ε−g1 andv2(ε)=2ε(ε+εg)εg/m(2ε−εg)2. Here,mis the effec- tive mass of the electron at the bottom of the conduction band.
Substituting these expressions into Eq. (6), we obtain the rate of ionization:
W =Wiexp(−L∗)=Wiexp
−E02 E2
(10)
with
E02 =8πω20ω2m3/2τi0
¯ 2εg
εF/εg
ε∗/εg
(2z+1)2
(z2+z)3/2dz, (11) where Wi is the probability of the single impact ionization event. This equation describes well the main features of the observed photoconductivity. Indeed, as discussed above, at high electric fields the relative change of the conductivity σ/σ ∝W varies exponentially with the square of the in- verse radiation electric field, see Fig. 7. Furthermore, the above equation reveals that the characteristic electric field E0 scales linearly with the radiation angular frequency ω, which also corresponds to the results of the experiments, see inset in Fig. 7. The observed increase of the E02 with the increase of the Fermi energy is also in a qualitatively agreement with Eq. (11). Note that a quantitative description of the Fermi energy dependence is not an easy task because with the increase of the upper limit of the integration the lower limit, being a fitting parameter in our calculations, will change as well. Finally we note that the observed increase of the characteristic fieldE0 with rising temperature, see inset in Fig. 6, is not surprising, showing that the generation rate of electron-hole pairs decreases with increasing temperature.
Indeed, typically at higher temperatures, the same relative increase of the electron temperature is obtained at higher electric fields.
B. Photocurrent
Now we discuss the observed photocurrent and its non- linearity at high intensities. Instead of the quasimomentum p, we use the wave vector k=p/¯h for the description of the charge carrier states. We start with the analysis of the photocurrent formation mechanism. As addressed above it is mainly caused by the LPGE, in the experiment under study the circular photocurrent contribution is unessential. Two mechanisms can contribute to the LPGE current generation:
(i) the shift photocurrent which arises from the second-order interaction with the electromagnetic wave and is related to the carrier displacement in the real space under direct or indirect optical transitions [33,41–47]; and (ii) the ballistic photocurrent, which arises beyond the Born approximation in calculating the optical matrix element. In the latter case, the carrier transition rate is asymmetric in the k space, and the photocurrent is stabilized by the momentum scattering time τ [42,44,48].
In general, both contributions appear due to the same asymmetries of elementary processes of photon absorption and charge carrier scattering by phonons or defects and are comparable in order of magnitude. Here we fix the attention on the shift contribution and employ a model which describes solely the LPGE.
We consider the photocurrent generated under intraband indirect (Drude-like) optical transitions in the lowest con- duction band (c) and the highest valence band (v). Taking into account that in our experiment at high intensities both electrons and holes are simultaneously present in the sam- ple, the shift photocurrent density is a sum j(c)+j(v) of the electron and hole contributions. The shift photocurrent density j(l)(l =c,v) is given by the following microscopic
equation [44]:
j(l)=2ql kk
Wl(k,k)Rl(k,k), (12) whereWl(k,k) is the probability rate of the optical transitions from the free-carrier state|lkto|lk,ql is the charge of free carriers,qc=efor an electron andqv= −e= |e|for a hole, Rl(k,k) is the elementary shift under an indirect one-photon transition, and the factor of 2 accounts for the spin degeneracy.
The intraband photon absorption process involves partici- pation of a static defect or a phonon. In the limitωτ−1, the transition rate is calculated using Fermi’s golden rule for indirect transitions. For static-defect-assisted transitions, this rule reads
Wl(k,k)=2π
¯
h Nd|Mlk,lk|2(flk−flk)δ(Elk−Elk−hω),¯ (13) with the compound matrix element being
Mlk,lk=Vl(k)−Vl(k)
hω¯ Ul(k,k). (14) Here,Ul(k,k) is the matrix element of scattering by a defect, ml is the effective mass mc or mv,Nd is density of scatter- ing defects,Elk =h¯2k2/(2ml), flkis the electron distribution function,Vl(k) is the matrix element of carrier-light interac- tion, the difference of the matrix elements can be presented as
Vl(k)−Vl(k)=qlhA¯ 0
mlc e·(k−k), (15) whereA0is the scalar amplitude of the light vector potential.
While deriving Eq. (14) we took into account the energy conservation law Elk−Elk =hω. Using the theory of the¯ shift LPGE [45] derived for the indirect optical transitions, we obtain for the elementary shift in Eq. (12)
Rl(k,k)= −Im[Ul∗(k,k)(∇k+∇k)Ul(k,k)]
|Ulk,lk|2
+Alk−Alk, (16) whereAlkis the Berry connection. In the steady-state regime of photoexcitation, the contributions of the Berry connections from all the processes cancel each other. Because of the her- miticity of the operator of carrier-defect interaction, one has
Ul∗(k,k)=Ul(k,k). (17) It is worth to note that if the matrix elementUl(k,k) depends only on the differencek−kthe shift (16) vanishes. Therefore we have to make allowance for the dependence ofUl(k,k) not only on the difference but also on the sumk+ k. For brevity, we shall leave aside the general case and discuss a special model leading to a nonvanishing shift (16). Namely, we expand the matrix element (17) up to the second order as follows:
Ul(k,k)=U0(l)+iU1(l,α)(kα −kα)+ U2(l),βγ(kβkγ +kβkγ), (18)
where α, β, γ =x,y and U2(l,βγ) =U2(l),γ β. The shift contributing to the photocurrent is given by
|Ul(k,k)|2Rlβ(k,k)=2U1,α(l)U2,βγ(l) (kα−kα)(kγ +kγ).
(19) We omit intermediate calculations and give final formulas for the photocurrents. For the linearly polarized light (Ex) passed through theλ/4 plate, the result reads
jl,x=
χl(0),x +χl(1),x
1+cos 4ϕ 2 +χl(2),x
sin 4ϕ 2
nlI, jl,y=
χl(0),y −χl(1),y
1+cos 4ϕ 2 +χl(2),y
sin 4ϕ 2
nlI, (20) in agreement with Eq. (3). Here,nl are the electron and holes densities, n for l=c and p for l =v, coefficients χi(l),α are given by
χl(0),α =2ηl(I) nl
qlml
¯ h2
U2(l),αγU1(l),γ U0(l)2 , χl(1),α =ηl(I)
nl
qlml
¯ h2
U2,αγ(l) U1,γ(l)(2δαγ −1)
U0(l)2 , (21) χl(2),α =ηl(I)
nl
qlml
¯ h2
U2,αβ(l) U1,γ(l)(1−δβγ) U0(l)2 , whereηl(I) is the absorbance defined by
ηl(I)=Wl(I)hω¯
I , (22)
andWl(I) is the absorption rate per unit area contributed by the charge carriersl. Because the electron and hole densities are nonequilibrium the absorbance is dependent on the light in- tensity. While deriving Eqs. (21) we assumed thek-dependent terms in the expansion (18) to be smaller as compared with the first termU0(l). The analysis shows that in the experimental conditions related to Fig.10the ratioηl(I)/nl is independent of nl and the introduction of concentration as a factor in Eqs. (20) is justified.
The (013)-oriented HgTe quantum-well structure has no point-group symmetry elements except for the trivial identity operationC1. As a result, the structure has no special in-plane axes, the symmetry impose no restrictions on the coefficients U1(l),α andU2(l),α in Eq. (18) and that, in Eq. (20), the sets of coefficientsχc(i),αfor the conduction electrons and coefficients χv(i),αfor the holes are linearly independent. This means, partic- ularly, that the electron and hole photocurrents are not neces- sarily parallel to each other, see the final remarks at the end of the section. Equations (20) describe well the experimentally observed polarization dependences of the photocurrentJ∝ j as shown in Fig.3(c). To fit experimental data, we consider polarized radiation with electric field vectorEpolarized along thexaxis and the photosignal measured along thexdirection, between the contacts 2 and 5.
Now we discuss the observed nonlinearity and dynam- ical sign change of the photocurrent. The process of light impact ionization creates electron-hole pairs resulting in an increase of the photogalvanic effect in the conduction band
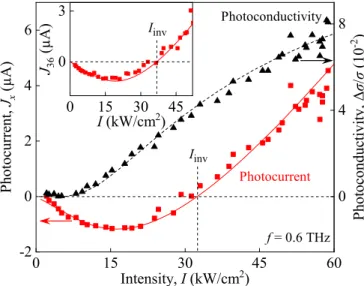
FIG. 10. Dependencies of the photoconductivity (black trian- gles) and the photocurrent (red squares) excited by linearly polarized radiation with a frequency of f =0.6 THz on the intensity. Signals were measured between contacts 2 and 5. Dashed black line shows fit after Eq. (4). Here the fitting parameters A=0.15 and I0= 41 kW/cm2obtained from the photoconductivity measurements, see Figs.5 and 7, are used. Solid red line shows a fit according to Eq. (25) [also see Eqs. (23) and (24)]. Here,A and I0 are taken from the photoconductivity fit,n=3×1011 cm−2 from transport measurements and the parametersχc=3.4×10⁻¹³μA cm4kW−1 andχv=8.2×10⁻¹²μA cm4 kW−1 are obtained from fitting. At low intensities, the photocurrent varies linearly with the intensity, while the photoconductivity signal is negligibly small. At higher intensities the photocurrent starts to show nonlinear behavior as the photoconductivity increases superlinearly. The inset shows the dependence of the diagonal photocurrent between contacts 3 and 6 excited by linearly polarized radiation with a frequency of f = 0.6 THz on the intensity. The solid line shows a fit according to Eq. (25) with the fitting parametersχc=2.7×10⁻¹³μA cm4kW−1 and χv =6×10⁻¹² μA cm4 kW−1. It is seen that the inversion intensityIinvincreases in this measurement direction.
described by
jx(c)=χc(n0+n)I, (23) as well as in the generation of holes and appearance of a hole photogalvanic current described by
jx(v)=χvpI. (24) Here, n0 is the equilibrium electron density, n=p∝ exp(−I0/I) are the densities of electrons and holes generated by the light impact ionization,
χc=κ
χc(0),x+χc(1),x
, χv=κ
χv(0),x+χv(1),x
,
κ is the parameter that relates the measured photocurrent to the current density (20) and is determined by the sample geometry and the laser spot position and diameter. With increasing the intensity the hole density increases and, in case
|χv|>|χc|, the valence band contribution of the photogal- vanic effect may become comparable to and even exceed that of the conduction band.
Fitting our data by the sum
jx= jx(c)+jx(v) (25) and assuming the contributions of electrons and holes to have opposite signs, we have obtained a good agreement taking the value of χv by an order of magnitude larger than χc, see Fig.10. In this figure, the data are fitted using only one adjustable parameterχv/χc. The coefficientAdetermining in Eq. (4) the number of photogenerated carriers is obtained from the photoconductivity data, see the dashed line in Fig.10. The free carrier densities are calculated from the magnetotransport measurements, andχcfrom the data at low intensities where the nonlinearity does not play a role, see squares in Fig.10, and the hole photocurrent is absent. The larger value of the inversion intensity for the linear polarization,IinvL >IinvC, compare Figs.3(a)and3(b), is attributed to the inequality
χv(0)
χc(0)
>
χv(0)+χv(1)
χc(0)+χc(1)
.
The possibility of the valence band contribution to be indeed larger than that of the conduction band is also sup- ported by numerical computation carried out for a phonon- involved indirect optical transitions. Calculations of the shift photocurrent for free charged carriers described by using the Bernevig–Hughes–Zhang model [12] with indirect optical transition processes involving scattering by acoustic phonons in the (013)-oriented HgTe QWs [49], show that the hole photocurrent can exceed the electron contribution by an order of magnitude. Details of this calculations are out of focus of the current paper.
Finally, it is important to note that a difference between the inversion points for the current measured in thexand diagonal directions, Fig.10and the inset in the figure, is caused by the nonparallel directions of the electron and hole photocurrents predicted by Eqs. (20). In agreement with the prediction for theC1symmetry, the interplay of the differently oriented vec- torsJ(c)andJ(v)yields different inversion points for different pairs of contacts. A larger value of the inversion intensityIinv for the diagonal contacts is attributed to a smaller ratio|χv/χc| in the ydirection as compared with that in the x direction.
At last but not at least we note that the observed shift of the inversion intensityIinv to higher intensity due to temperature increase, see inset in Fig.4, is in agreement with the reduction of the nonlinearity confirmed by the photoconductivity data, see inset in Fig.6.
V. SUMMARY
To summarize, our experiments demonstrate that excitation of doped HgTe-based QW structures exhibiting a noninverted band order results in light impact ionization, despite the fact that the Fermi energy exceeds the energy of the forbidden gap. This effect results in strongly nonlinear photogalvanic current exhibiting a dynamic sign inversion and positive pho- toconductivity due to the electron-pair generation. We show that for a fixed radiation electric field the ionization proba- bility, being proportional to exp(−E02/E2) with characteristic field E0∝ω, exponentially increases with the reduction of the square of radiation frequency and/or the Fermi energy level. The probability also rises under sample cooling. The
developed theory of the observed phenomena describes well all characteristic features of the nonlinear optoelectronic phe- nomena. It demonstrates that under the conditionωτ1 the ionization occurs because of collisions in the presence of the oscillating electric field of light wave. A distinguish feature of thelightimpact ionization reported in the present work is that it occurs even for the Fermi level lying in the conduction band.
In the latter case, in contrast to all previous works on impact ionization, the electron gas heating is needed to deplete the occupied states enabling the ionization process.
The observed strong nonlinearity, being caused by elec- tron gas heating and electron scattering, reveals importance of scattering processes in the search on Floquet states and realization of Floquet topological insulator. Note that the influence of scattering and electron gas heating effects on the formation of dressed states and band modification are ignored in almost all theoretical works on this topic. As for the future work, we expect that experiments on QW structures with Fermi energy in the forbidden gap should allow to examine photoreponse under conditions with suppressed impact ion- ization process and may explore the Floquet states formation.
Such experiments require structures with a semitransparent gate robust to high power terahertz radiation and allowing application of substantially higher negative gate voltages as used in the present work.
ACKNOWLEDGMENTS
We thank I.A. Dmitriev and S.N. Danilov for helpful dis- cussions. The support from the DFG priority program (SFB- 1277, Project A04), the Elite Network of Bavaria (K-NW- 2013-247) and the Volkswagen Stiftung Program is gratefully acknowledged. E.L.I. and G.V.B. acknowledge the support from the Russian Science Foundation (Project No. 17-12- 01265). G.V.B also acknowledges the support from BASIS foundation. D.W., J.Z., and D.D. have received funding from
the European Research Council (ERC) under the European Union’s Horizon 2020 research and innovation programme (Grant Agreement No. 787515).
APPENDIX
1. Electron-optical phonon collision integral
We start with description of the loss term of collision integral corresponding to electron transitions out of the state with momentum p due to spontaneous phonon emission.
We denote ask=p/h¯ andk=k−q, correspondingly, the electron wave vectors before and after emission of phonon of wave vectorq=q+qz, whereqandqzare the in-plane and zcomponents of vectorq, respectively (here the momentum conservation law is taken into account). In these terms,
St−ph{f} = 2π
¯ h
|Mq|2δ(εk−εk−ε0)
×θ(εk−ε0)f(k,t)[1−f(k,t)]d2kdqz
(2π)3 , (A1) where Mq is the matrix element of electron-phonon interac- tion [50]:
Mq=
4πe2ηω0
¯
J(qz)
q2+qz2 , J(qz)=
ψ2(z)eiqzzdz. (A2) Here, the Heaviside step functionθ(ε−ε0)=1 atεε0and θ(ε−ε0)=0 atε < ε0.
The 2D electron wave function ψ(z) decays on a scale of the quantum well width W. Substituting Eq. (A2) in Eq. (A1) and integrating overqzand over the modulus ofkfor qW 1 (only the lowest energy level is populated) yield
St−ph{f} = 2π2e2ε0g(ε−ε0) ¯
2π
0
f(ε, ϕ,t)[1−f(ε−ε0, ϕ,t)]θ(ε−ε0) p2(ε)+p2(ε−ε0)−2p(ε)p(ε−ε0) cos(ϕ−ϕ)
dϕ
2π. (A3)
Similarly we obtain
St+ph{f} = 2π2e2ε0g(ε+ε0) ¯
2π
0
[1−f(ε, ϕ,t)]f(ε+ε0, ϕ,t)
p2(ε)+p2(ε+ε0)−2p(ε)p(ε+ε0) cos(ϕ−ϕ) dϕ
2π. (A4)
2. Derivation of balance equations We look for a solution of the kinetic equation (5) in the form of series
f(ε, ϕ,t)= ∞
n=0
fn(ε,t) cos(nϕ). (A5)
Substituting this series in Eq. (5), we obtain an infinite chain of equations for the functions fn(ε,t). For high rate of collisions with impurities, the distribution function is almost isotropic, which allows us to consider only the first two terms of the series (A5).
The corresponding equations for the functions f0(ε,t) and f1(ε,t) f0(ε,t) have the form:
∂f0
∂t +eEv(ε) cosωt 2
∂f1
∂ε +eEcosωt
2p(ε) f1= −St−ph{f0} +St+ph{f0}, ∂f1
∂t +eEv(ε) cosωt∂f0
∂ε = − 1
τi(ε)f1. (A6) In accordance with the assumptions made, in the second of these equations we neglect the contribution of phonon scattering to relaxation of the first harmonic, i.e., to the transport relaxation time. At frequencies exceeding all inverse scattering times,
![FIG. 2. (a) Reference laser pulse shape over time in arbitrary units. The signal is measured by the fast room temperature photon drag detector [30]](https://thumb-eu.123doks.com/thumbv2/1library_info/3742577.1509389/3.884.450.821.92.478/reference-laser-arbitrary-signal-measured-temperature-photon-detector.webp)